[Preprint]. 2024 Nov 13:2024.11.12.24317184.
doi: 10.1101/2024.11.12.24317184.

Remoscope: a label-free imaging cytometer for malaria diagnostics

Affiliations

Remoscope: a label-free imaging cytometer for malaria diagnostics

Paul M Lebel et al. medRxiv. .

Update in

  • Remoscope: a label-free imaging cytometer for malaria diagnostics.
    Lebel PM, Jeyakumar I, Khoo MWL, Emorut J, Charlton C, Saxena A, Jacobsen A, Huynh E, Wu W, Courville G, Fu PC, Raghavan M, Puccinelli R, Olwoch P, Dorsey G, Rosenthal PJ, DeRisi J, Gomez-Sjoberg R. Lebel PM, et al. Trans R Soc Trop Med Hyg. 2025 Sep 2;119(9):1100-1111. doi: 10.1093/trstmh/traf070. Trans R Soc Trop Med Hyg. 2025. PMID: 40631413

Abstract

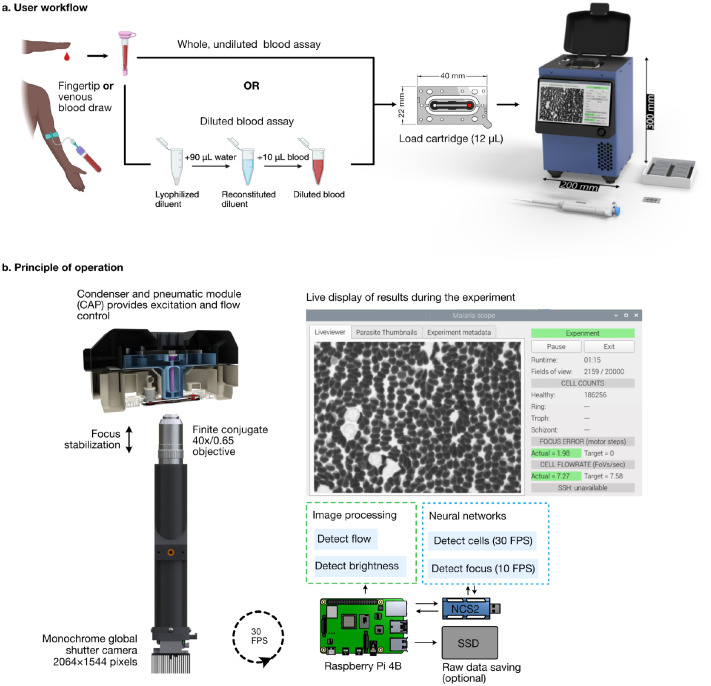
Malaria diagnostic testing in high transmission settings remains a burden on healthcare systems. Here we present Remoscope, a portable automated imaging cytometer that scans fresh, unstained whole blood using a custom neural network on low-cost hardware. By screening up to two million red blood cells, Remoscope performs label-free quantitative stage-specific detection of Plasmodium falciparum (Pf) in 1-12 minutes without sample fixation, staining, or slide scanning. Flow is used to achieve high cellular throughput, with blood confined to a 4.5 μm monolayer in low-cost disposable flow cartridges. Remoscope performance was benchmarked in vitro by titration of cultured parasites into uninfected whole blood at concentrations of 17.1-710,000 parasites/μL. Counts generated by Remoscope demonstrated a linear response across the entire range. Considering drug susceptibility assays, the half-maximal effective concentration (EC50) of chloroquine (CQ) for the W2 strain of Pf was 211 nM by Remoscope, compared to 191 nM for conventional flow cytometry. Remoscope's real-world diagnostic accuracy was evaluated in a cohort of 500 individuals in eastern Uganda, comprising 601 unique clinic visits. Parallel measurements of parasitemia were performed using Remoscope, qPCR targeting the multicopy conserved var gene acidic terminal sequence, and microscopic evaluation of Giemsa-stained thick blood smears. Remoscope's limit of detection with respect to qPCR was 95.1 parasites/μL. At this threshold, the system had a sensitivity of 83%, specificity of 96%, Positive Predictive Value (PPV) of 91%, and a Negative Predictive Value (NPV) of 93%. Remoscope's speed, accuracy, low cost, and ease of use address practical challenges in malaria diagnostic settings around the world. As a general imaging flow cytometer, Remoscope may also inform the development of recognition models for the diagnosis of other infectious and noninfectious blood disorders.

Keywords: Malaria; diagnostics; label-free imaging; machine learning.


Conflict of interest statement

Competing interests PML, RGS, and JLD declare international patent application No. PCT/US2021/047974.

Figures

Fig. 1 |
Fig. 1 |. Overview of Remoscope’s workflow and principle of operation.
a, The user workflow consists of a blood draw (either fingertip or venous, with EDTA anticoagulation), followed by an optional dilution step, chamber loading, metadata entry, run start, and monitoring for completion (1–12 minutes). b, High-level overview of the system processes. During continuous image acquisition, the rate of blood flow and image brightness are monitored by classical image processing on the Raspberry Pi, while focal position and cell detection are both performed using neural networks executed on the Neural Compute Stick 2 (NCS2). Intermediate results are updated and displayed to the user throughout the course of the experiment, while focus, brightness, and flow rate are stabilized using feedback. During the run, the statistics of the parasite counts are updated once per second, triggering the end of the experiment if the stop conditions are met. Raw data can optionally be saved to a Solid State Drive (SSD) during the experiment.
Fig. 2 |
Fig. 2 |. Examples of label-free blood cell images classified by Remoscope.
a, Ring-infected RBCs of various sub-morphologies including amoeboid, dendritic, and canonical rings. b, Trophozoite-infected RBCs of various sub-morphologies including early trophozoites, late trophozoites, and multiply-infected RBCs (upper and lower right). c, Schizont-infected RBCs showing partial and full merozoite segmentation. d, Gametocytes, ranging from stage 3–5. Stage 1–2 gametocytes were not distinguished from trophozoites due to lack of sufficiently unique features. e, White blood cells f, Uninfected RBCs exhibiting a variety of morphologies. g, A region of interest with a high density of platelets, which are called out with red arrows in panels g-j. h, A complete field of view containing uninfected, undiluted blood under flow. RBCs are seen with shear distortion features such as rarified trailing edges. i, A complete field of view containing uninfected RBCs diluted to 5% hct, with normal hemoglobin content. j, A complete field of view containing diluted blood at 5% hematocrit, exhibiting low hemoglobin pigmentation.
Fig. 3 |
Fig. 3 |. Remoscope performance on lab-cultured Pf.
a. Life stage-specific parasitemia quantification over a 16-point serial dilution of parasite culture into uninfected, undiluted whole blood. Remoscope results are shown in black and gray markers. Thin smear microscopy counting ~1,000 cells per point are shown for the first eight titration points only, and flow cytometry (2×10⁶ events per point) are plotted as blue ‘+’ signs. Remoscope data has undergone linear transformation with parameters m=0.7, b=0. b. Parasite life stage time course experiment over a continuous 28 hour period showing the assessed fractional compositions of each asexual life stage in the culture as a function of time. c. Uncertainty quantification of the titration data as a function of the number of cells analyzed. Contour regions span the overall mean +/− one standard deviation across data subsampled at the indicated number of cells. d. Theoretical prediction of the experimental uncertainty shown in c, as described in Supplementary Note 2.
Fig. 4 |
Fig. 4 |. Clinical study in a Ugandan cohort using 10× diluted blood.
a, Overall data collection and vetting strategy: venous blood samples were sent to Remoscope, qPCR, and thick blood smear microscopy with duplicate readings. Remoscope datasets underwent a quality vetting process to discard low quality datasets due to technical failures, according to seven vetting criteria. A linear transformation (slope and offset correction) was used to adjust for the average recall and false positive rates. b, Histogram of participant ages. c, Histogram of cohort parasitemias by qPCR. d, Stacked histogram of Remoscope dataset vetting results. “Fl” = Flow rate, “RBC” = RBC integrity, “SC” = Stuck Cells, “DP” = Diluent Precipitate, “TD” = Toner and Debris, “AB” = Air Bubbles, and “Fo” = Focus quality. e, Histogram of total red blood cell counts per experiment in the cohort (diluted blood), after filtering for N>132,735 cells (bottom 5% removed). f, Comparison of Remoscope and microscopy against qPCR. The horizontal dashed line indicates the computed Remoscope limit of detection (LOD). The vertical dotted line indicates the corresponding threshold on the qPCR axis. The two lines partition the plot into true negatives (lower left), true positives (upper right), false positives (upper left), and false negatives (lower right). g, The same Remoscope data as f, but plotted with delineation of visit type and febrility status. h, Direct comparison of Remoscope with microscopy. Non-falciparum Plasmodium species are denoted by distinct markers. ‘Other’ refers to samples testing positive by microscopy, but negative for both Pf-PCR as well as the species PCR panel. i-n, Respectively: Sensitivity, Specificity, Positive Predictive Value (PPV), Negative Predictive Value (NPV), + Likelihood Ratio, and - Likelihood ratio of the diagnostic test as a function of a common swept positivity threshold. Performance metrics were computed for three confidence thresholds: 0.9, 0.95, and 0.99. Linear transformation parameters were computed independently for each confidence threshold. In all subpanels, parasitemia values were clipped to one parasite/μL.
Fig. 5 |
Fig. 5 |. EC50 assessment of chloroquine (CQ) effectiveness
a, Stage-specific parasitemia assessments as a function of CQ concentration after a 72 hour drug exposure under cell culture conditions. Remoscope overall parasitemia is shown in filled black circles, while rings, trophozoites, and schizonts are shown in gray rings, triangles, and stars, respectively. Schizont counts above 100 nM drug concentration were zero, but set to 1 for display on the logarithmic scale. Flow cytometer data of the same samples is shown for comparison. Dashed lines represent sigmoidal curve fits to both all-stages datasets. b, Montages containing example rings and trophozoites from the 1nM and 1μM conditions, respectively.

References

    1. World malaria report 2023. Available at: https://www.who.int/teams/global-malaria-programme/reports/world-malaria... [Accessed 3 September 2024].
    1. World malaria report 2022. Available at: https://www.who.int/publications-detail-redirect/9789240064898 [Accessed 27 October 2023].
    1. Mnzava, Monroe A. C., Okumu F., Anopheles stephensi in Africa requires a more integrated response. Malar. J. 21, 156 (2022). - PMC - PubMed
    1. Emiru T., et al. , Evidence for a role of Anopheles stephensi in the spread of drug- and diagnosis-resistant malaria in Africa. Nat. Med. 29, 3203–3211 (2023). - PMC - PubMed
    1. Poostchi M., Silamut K., Maude R. J., Jaeger S., Thoma G., Image analysis and machine learning for detecting malaria. Transl. Res. 194, 36–55 (2018). - PMC - PubMed

Publication types