[Preprint]. 2024 Nov 12:rs.3.rs-4997138.
doi: 10.21203/rs.3.rs-4997138/v1.

Identification of a Resistance Exercise-Specific Signaling Pathway that Drives Skeletal Muscle Growth

Affiliations

Identification of a Resistance Exercise-Specific Signaling Pathway that Drives Skeletal Muscle Growth

Wenyuan G Zhu et al. Res Sq. .

Update in

Abstract

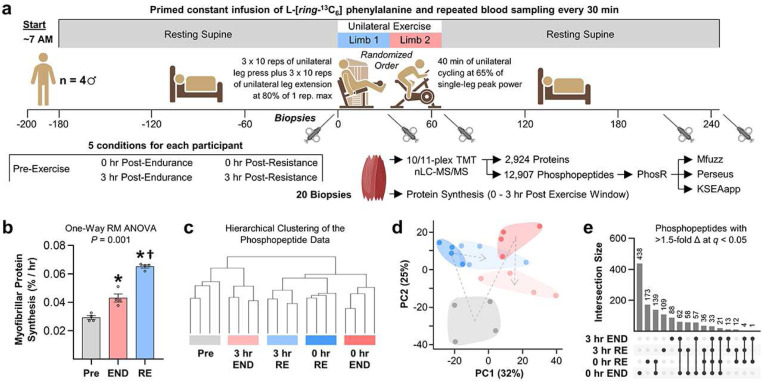
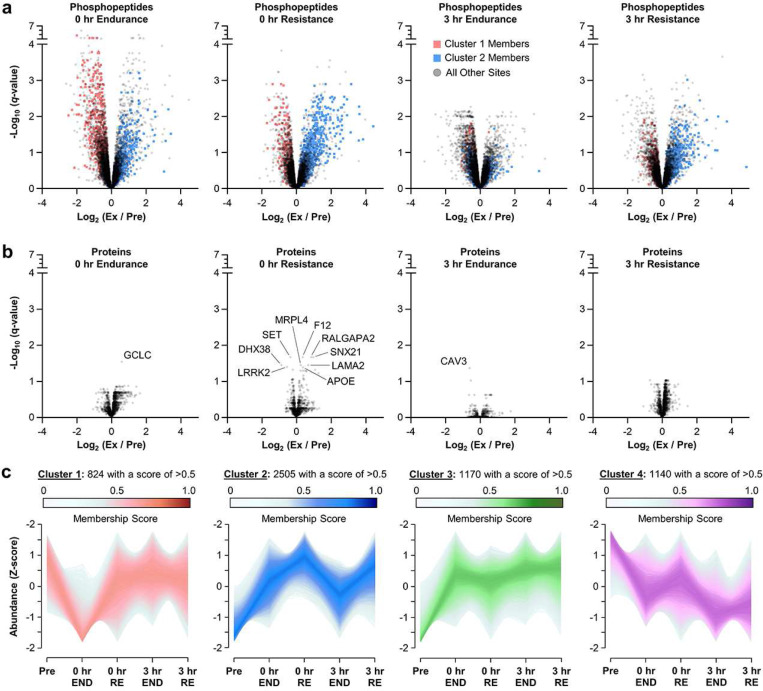
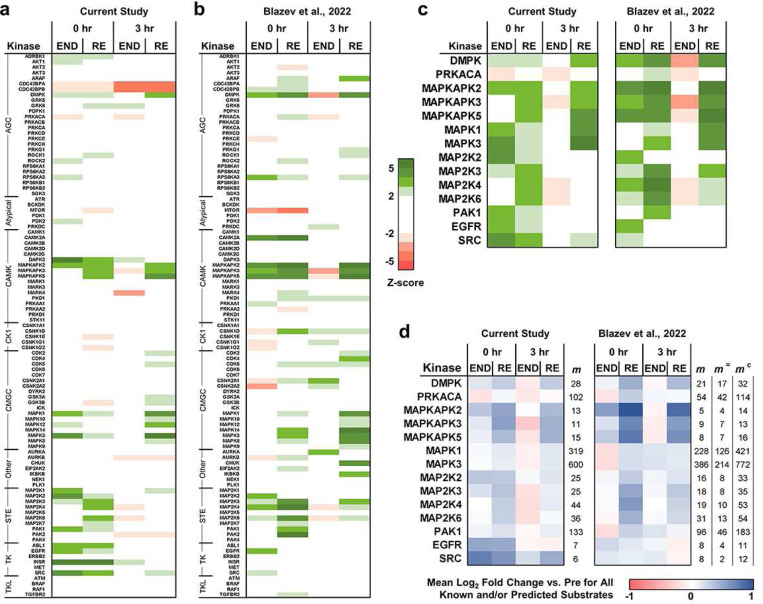
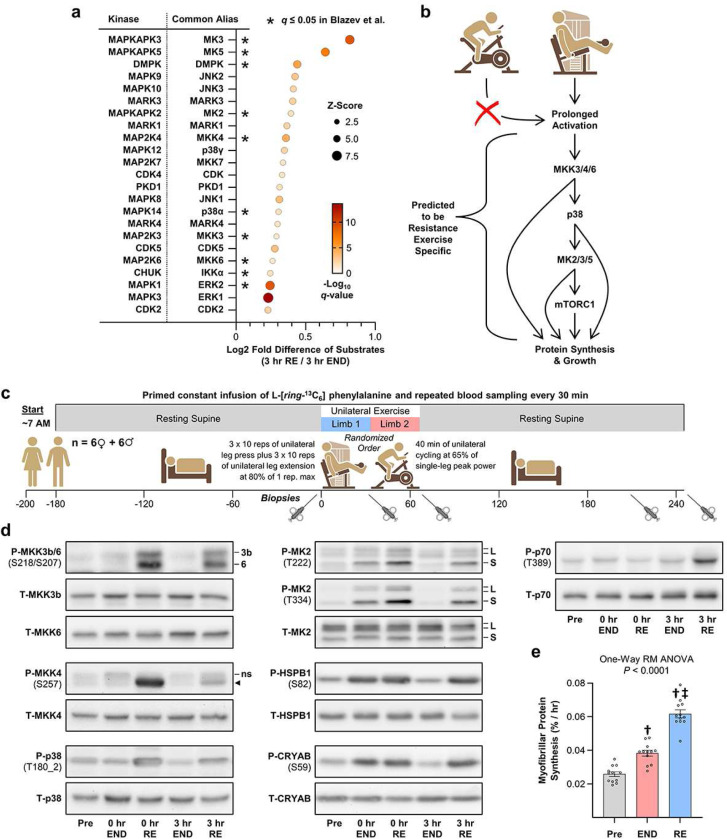
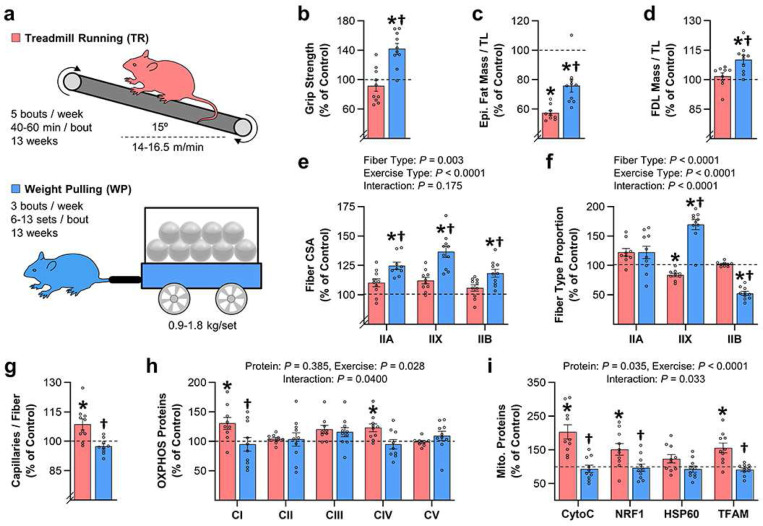
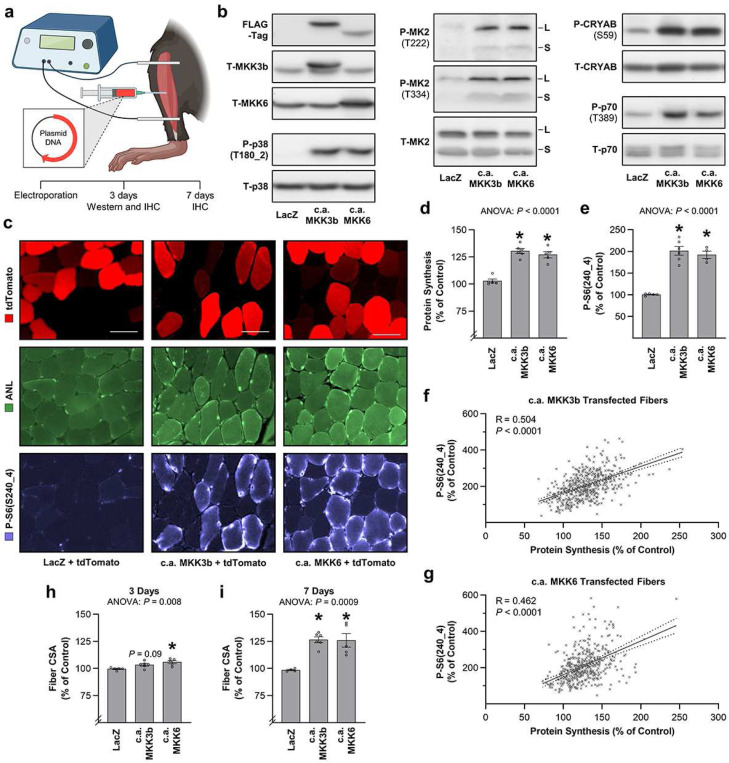
A human model of unilateral endurance versus resistance exercise, in conjunction with deep phosphoproteomic analyses, was used to identify exercise mode-specific phosphorylation events. Among the outcomes, a resistance exercise-specific cluster of events was identified, and a multitude of bioinformatic- and literature-based predictions suggested that this was mediated by prolonged activation of a pathway involving MKK3b/6, p38, MK2, and mTORC1. Follow-up studies in humans and mice provide consistent support for the predictions and also revealed that resistance exercise-induced signaling through MKK3b and the induction of protein synthesis are highly correlated events (R = 0.87). Moreover, genetic activation of MKK3b/6 in skeletal muscles was sufficient to induce signaling through the members of the resistance exercise-specific pathway, as well as an increase in protein synthesis and fiber size. Thus, we propose that we have identified some of the core components of a signaling pathway that drives the growth-promoting effects of resistance exercise.


Conflict of interest statement

Additional Declarations: Yes there is potential Competing Interest. Troy A. Hornberger received a research grant from Novo Nordisk. This could be perceived as a potential conflict of interest, however, Novo Nordisk and Troy A. Hornberger do not have any agreements that could lead to a financial gain or loss from this publication.

Figures

Figure 1.
Figure 1.. Overview of the phosphoproteomic alterations that occur after a bout of endurance versus resistance exercise in humans
a, Timeline of the experimental interventions and a general description of the analytical procedures that were employed. b, Measurement of the mean rate of myofibrillar protein synthesis during three different 3 hr windows of time including: i) 3 hr pre-exercise (Pre), ii) immediately post (0 hr) to 3 hr post endurance exercise (END), and iii) 0 hr to 3 hr post resistance exercise (RE). Values are group means ± SEM, n = 4 per group. Data were analyzed with one-way repeated measures (RM) ANOVA. * Significantly different from Pre, † significantly different from END, P < 0.05. c, Unsupervised hierarchical clustering of the phosphopeptide data from each of the participants. d, Principal component analysis of the phosphopeptide data from each of the participants. Dots represent the values for each participant and the color of the dot indicates the experimental condition (as described in c). e, UpSet plot illustrating the number of phosphopeptides for each condition that experienced a > 1.5-fold exercise-induced change (Δ) in abundance at an FDR-corrected P-value (q) of < 0.05 when compared with Pre.
Figure 2.
Figure 2.. Cluster-based identification of phosphorylation events that are specific to endurance and resistance exercise in humans
a, Volcano plots from the phosphoproteomic analyses at 0 hr or 3 hr post endurance (END) or resistance (RE) exercise. b, Volcano plots from the proteomic analyses for the same conditions listed in a. The highlighted proteins experienced a significant alteration in abundance, q ≤ 0.05. c, Soft clustering of the phosphoproteomic data revealed four major clusters of phosphopeptides that were affected by exercise. In a, the phosphopeptides that had a membership score of ≥ 0.5 for cluster 1 are highlighted in pink, while those with a membership score of ≥ 0.5 for cluster 2 are highlighted in blue.
Figure 3.
Figure 3.. Identification of kinases that are reproducibly inferred as being regulated by endurance and/or resistance exercise in humans
a, Heatmap of Z-scores for the KSEAapp inferred alterations in kinase activity at 0 hr or 3 hr post endurance (END) or resistance (RE) exercise when compared to the pre-exercise state. Kinases are listed by their gene names and only kinases expressed in skeletal muscle (see methods) that possessed at least 5 known and/or predicted substrates in the phosphopeptide dataset are listed. The list of kinases was clustered according to their group (e.g., AGC) and then listed in alphabetical order. b, The results from the current study are compared with the results that were derived from identical processing of the phosphopeptide dataset published by Blazev et al., 2022 . c, Heatmaps of the Z-scores for the kinases whose activity was inferred to be significantly altered (q ≤ 0.05) in at least one condition in both the Blazev et al., 2022 dataset and the current dataset. d, Heatmaps of the mean exercise-induced change in the phosphorylation of the known and/or predicted substrates of each kinase listed in (c). Also shown is the number of known and/or predicted substrates for each kinase (m), the number of m that were common to both datasets (m=), and the combined number of distinct m from the two datasets (mc).
Figure 4.
Figure 4.. Prediction and validation of a signaling pathway that is activated specifically by resistance exercise in humans
a, Multivariable plot with Z-scores, q-values, and the mean differences in the phosphorylation of the known and/or predicted substrates for each kinase that was inferred by KSEAapp to have a significant difference (q ≤ 0.05) in activity at 3 hr post resistance (3 hr RE) vs. 3 hr post endurance (3 hr END) exercise. The list includes the gene name of each kinase as well as its common alias. Also highlighted with a * are kinases that were inferred by KSEAapp to have significant differences in activity at 3 hr RE vs. 3hr END as determined from the phosphopeptides dataset published by Blazev et al., 2022 . b, Manually curated prediction of the interconnectivity and functional outcomes of the most robustly perturbed kinases listed in (a). c, Schematic of the experimental intervention that was used to test the predictions in (b). d, The samples from (c) were subjected to western blot analysis for the phospho (P) and total (T) levels of the indicated proteins. Non-specific band (ns), long isoform of MK2 (L), short isoform of MK2 (S). The quantitative analysis of the western blots are provided in Extended Figure 4. e, Measurement of the mean rate of myofibrillar protein synthesis during three different 3 hr windows of time including: i) 3 hr pre-exercise (Pre), ii) immediately post (0 hr) to 3 hr post END, and iii) 0 hr to 3 hr post RE. Values are group means ± SEM, n = 12 per group. Data was analyzed with one-way repeated measures (RM) ANOVA. † Significantly different from Pre, ‡ significantly different from END, P < 0.0001.
Figure 5.
Figure 5.. Changes in MKK3b(S218) phosphorylation are highly correlated with the resistance exercise-induced increase in myofibrillar protein synthesis
For each of the signaling events analyzed in Figure 4, linear regression was used to compare each participant’s endurance (END) and resistance exercise (RE) induced change (Δ) in myofibrillar protein synthesis (MyoPS) with the mean (x¯)Δ of the phospho to total protein ratio (P/T) at 0 hr and 3 hr post-exercise. a, Multivariable plot illustrating the coefficient of determination (R-squared) and P-value of the co-relationship for all comparisons that revealed an R-squared value of >0.1. NS indicates not significant. b, Graph of the co-relationship between the Δ in MyoPS and the Δ in the P/T for MKK3(S218). Individual values for each participant were expressed as a percentage of the value obtained in their respective pre-exercise sample. Dashed lines represent the 95% confidence intervals.
Figure 6.
Figure 6.. Mouse models of endurance and resistance exercise lead to distinct adaptations
a, Mice were subjected to 13 weeks of endurance exercise with treadmill running (TR) or resistance exercise with weight pulling (WP). Values in each exercise group were expressed relative to their respective mock-trained (control) groups (see Extended Figures 6, 7 and Zhu et al. 2021 ), and then the effects of the different modes of exercise were compared. b, Measurements of grip strength. c-d, The mass of the individual epididymal (Epi.) fat pads (c), and flexor digitorum longus (FDL) muscles (d), after being normalized to tibia length (TL). e-g, The average cross-sectional area (CSA) of the different fiber types (e), the proportion of the fibers that were represented by each fiber type (f), and the average number of capillaries per fiber (g), as assessed in mid-belly cross-sections from FDL muscles. h-i, FDL muscles were subjected to western blot analysis for (h) members of the five OXPHOS complexes (i.e., CI - CV), and (i) other mitochondrial (mito.) proteins. Values in the graphs are presented as the group means ± SEM, n = 8–10 per group. * Significantly different from the condition-matched control group as presented in Extended Figures 6, 7 and Zhu et al. 2021, or † significant difference between the effect of endurance and resistance exercise, P < 0.05. The data were analyzed with Student’s t-tests (b-d, and g), or two-way ANOVA (e, f, h, and i).
Figure 7.
Figure 7.. Mouse models affirm that prolonged activation of signaling through MKK3/4/6, p38, MK2, and mTORC1 occurs specifically in response to resistance exercise
a, Schematic of how transgenic mice that express a mutated form of the methionyl-tRNA synthetase (MetRSL274G +/−) were subjected to endurance exercise with treadmill running (TR), resistance exercise with weight pulling (WP), or their respective mock-trained (control) conditions. At the end of the last training bout, the mice were injected with azidonorleucine (ANL) which is an azide-bearing analog of methionine that can be incorporated into newly synthesized proteins of mice that possess the MetRSL274G transgene. The FDL muscles were collected at 3 hr post-training and subjected to the analyses described below. b, The muscles were homogenized and whole lysates were separated into myofibrillar and sarcoplasmic fractions. The different fractions were then subjected to western blot analysis for myofibrillar and sarcoplasmic proteins. c, As illustrated in (a), a DBCO-based ‘click’ reaction was used to label the ANL-containing proteins with a fluorophore (Cy5.5). Fluorescently labeled proteins in the myofibrillar fraction were then subjected to SDS-PAGE and used to visualize the in-gel amount of ANL-labeled proteins as well as the total amount of protein in each sample. d, The ANL-labeled to total protein ratio for each sample was quantified and used as a readout for the rate of myofibrillar protein synthesis. e, The FDL muscles were subjected to western blot analysis for the phospho (P) and total (T) levels of the indicated proteins. Non-specific band (ns), long isoform of MK2 (L), short isoform of MK2 (S). The quantitative analysis of these western blots is provided in Extended Figure 9. Values in the graph are presented as the group mean ± SEM, n = 4–8 per group. Data were analyzed with two-way ANOVA. * Significantly different from TR control, or † WP control, P < 0.05.
Figure 8.
Figure 8.. Genetic activation of MKK3b and MKK6 is sufficient to induce resistance exercise-specific signaling events, protein synthesis, and growth
a, Schematic describing the electroporation procedure that was used to transfect mouse tibialis anterior (TA) muscles. b, TA muscles of C57BL6 mice were transfected with plasmid DNA encoding FLAG-tagged and constitutively active (c.a.) mutants of human MKK3b or MKK6, or with LacZ as a control condition. The muscles were collected at 3 days post-transfection and subjected to western blot analysis for the phospho (P) and total (T) levels of the indicated proteins. Long isoform of MK2 (L), short isoform of MK2 (S). Quantitative analysis of the western blots is provided in Extended Figure 10. c, TA muscles of MetRS +/− mice were co-transfected with tdTomato and c.a. MKK3b, c.a. MKK6, or LacZ as the control condition. At 3 days post-transfection the mice were injected with ANL to label newly synthesized proteins. At 3 hr after the ANL injection, the muscles were collected for histological analysis. Cross-sections were used to visualize the transfected (tdTomato positive) vs. non-transfected (control) fibers, ANL-labeled proteins, and phosphorylated (P) S6(S240_4) as a marker of signaling through mTORC1, scale bars = 50 μm. For each sample, the intensity of the signal for ANL (i.e., protein synthesis) (d), and P-S6(S240_4) (e) were simultaneously measured in randomly selected fibers, and then the values in the transfected fibers were expressed relative to the mean values observed in the non-transfected fibers within that sample (n = 60–120 transfected and non-transfected fibers per sample). f,g, Graphs of the co-relationships between protein synthesis and P-S6(S240_4) in the fibers from (d,e) that were transfected with c.a. MMK3b (f), or c.a. MKK6 (g). The data were analyzed with linear regression, dashed lines represent the 95% confidence intervals. h, The cross-sectional area (CSA) of the same fibers analyzed in (d,e) was measured and then the CSA of the transfected fibers was expressed relative to the mean of the non-transfected fibers within that sample. i, TA muscles of C57BL6 mice were transfected, collected at 7 days post-transfection, and analyzed for fiber CSA as described above (n = 46–140 transfected and non-transfected fibers per sample). Values in the graphs are presented as the group mean ± SEM, n = 4–5 samples per group (290–526 fibers per group). The data in (d,e,h,i) were analyzed with one-way ANOVA. * Significantly different from LacZ, P < 0.05.

Similar articles

References

    1. Hughes D. C., Ellefsen S. & Baar K. Adaptations to Endurance and Strength Training. Cold Spring Harb Perspect Med 8 (2018). 10.1101/cshperspect.a029769 - DOI - PMC - PubMed
    1. Egan B. & Zierath J. R. Exercise metabolism and the molecular regulation of skeletal muscle adaptation. Cell Metab 17, 162–184 (2013). 10.1016/j.cmet.2012.12.012 - DOI - PubMed
    1. Hoppeler H. Molecular networks in skeletal muscle plasticity. The Journal of experimental biology 219, 205–213 (2016). 10.1242/jeb.128207 - DOI - PubMed
    1. Ramazi S. & Zahiri J. Posttranslational modifications in proteins: resources, tools and prediction methods. Database (Oxford) 2021 (2021). 10.1093/database/baab012 - DOI - PMC - PubMed
    1. Sharma K. et al. Ultradeep human phosphoproteome reveals a distinct regulatory nature of Tyr and Ser/Thr-based signaling. Cell Rep 8, 1583–1594 (2014). 10.1016/j.celrep.2014.07.036 - DOI - PubMed

Publication types

LinkOut - more resources