[Preprint]. 2024 Nov 21:rs.3.rs-5454588.
doi: 10.21203/rs.3.rs-5454588/v1.

An orally available Mpro/TMPRSS2 bispecific inhibitor with potent anti-coronavirus efficacy in vivo

Affiliations

An orally available Mpro/TMPRSS2 bispecific inhibitor with potent anti-coronavirus efficacy in vivo

Hin Chu et al. Res Sq. .

Update in

  • An orally available Mpro/TMPRSS2 bispecific inhibitor with potent anti-coronavirus efficacy in vivo.
    Shuai H, Qiao J, Yoon C, Zhang G, Hou Y, Xia X, Wang L, Deng X, Wang Y, Li Q, Du L, Liu Y, Zhou M, Wong HT, Hu J, Liu H, Hu B, Wang D, Su J, Pan Y, Ye Y, Chen Y, Fang Z, Xia Z, Chai Y, Shi J, Wang Y, Zhu T, Zhang H, Yuan S, Zhou J, Chan JF, Yuen KY, Xu C, Lei J, Yang S, Chu H. Shuai H, et al. Nat Commun. 2025 Jul 16;16(1):6541. doi: 10.1038/s41467-025-60832-z. Nat Commun. 2025. PMID: 40670362 Free PMC article.

Abstract

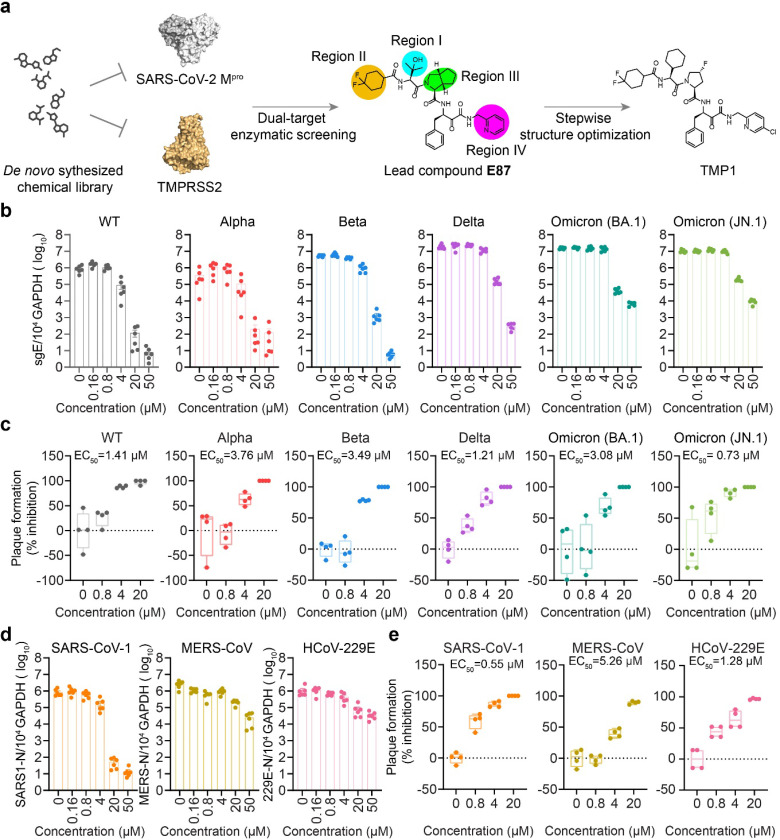
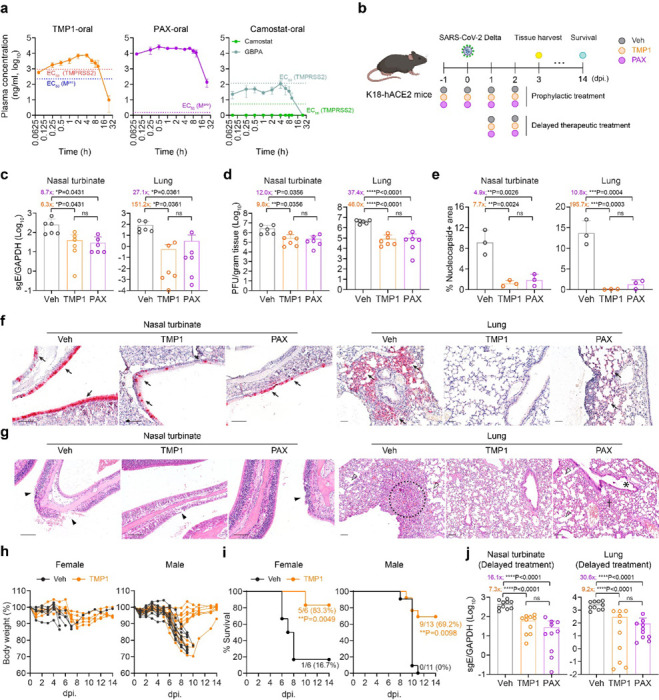
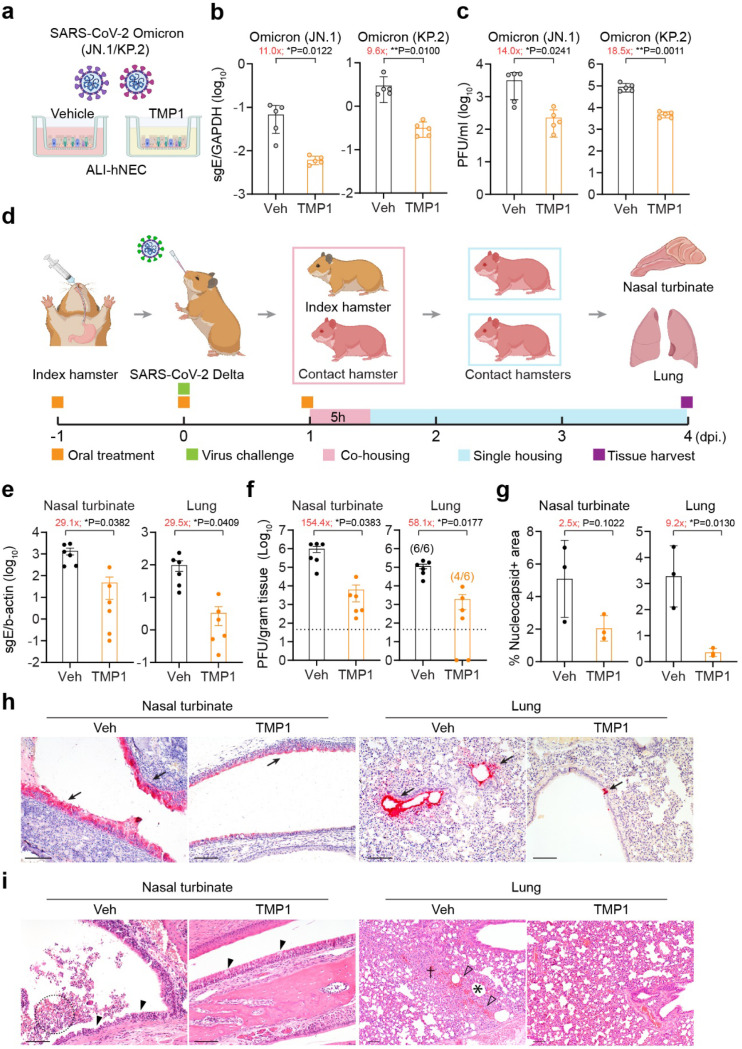
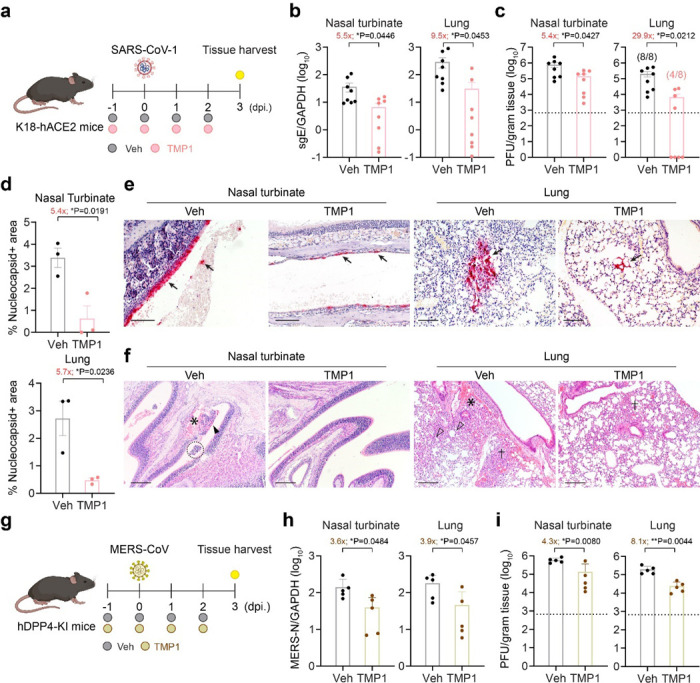
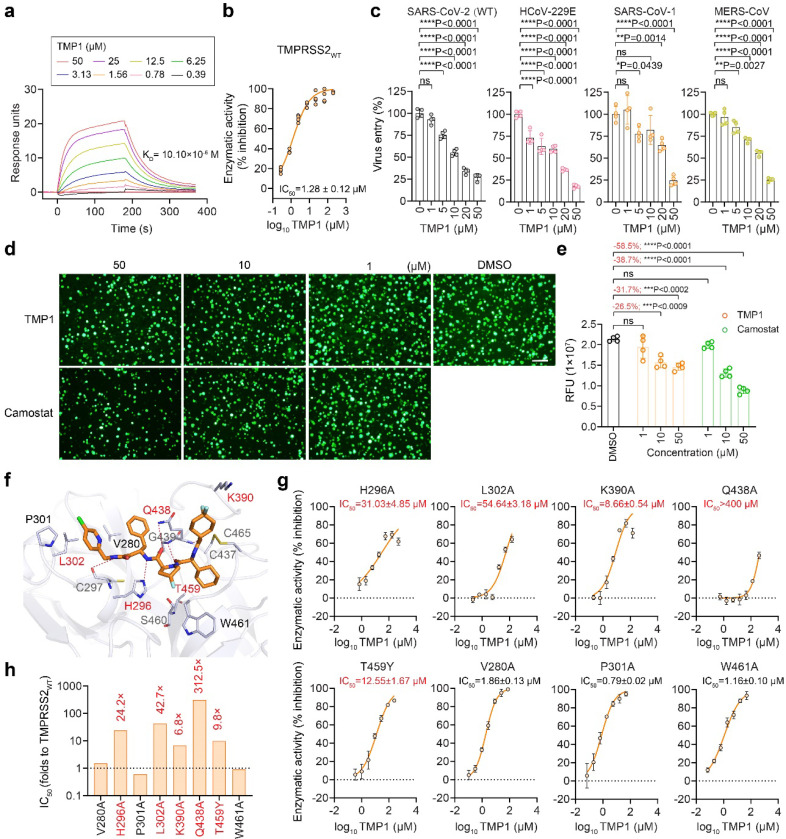
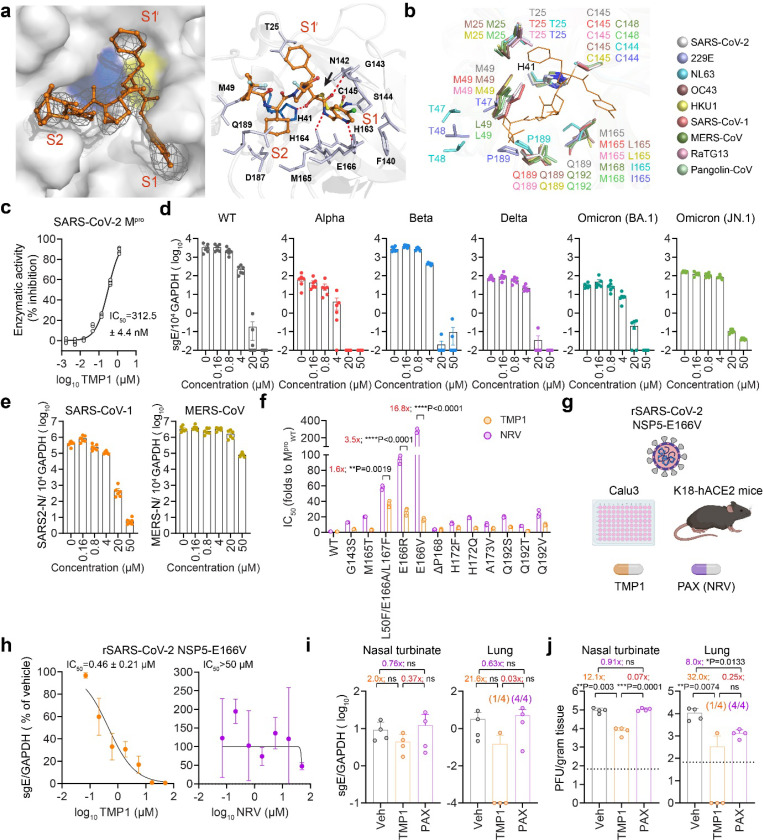
Coronaviruses have caused three major endemics in the past two decades. Alarmingly, recent identification of novel zoonotic coronaviruses that caused human infections suggests the risk of future coronavirus outbreak caused by spillover infection from animal reservoirs remains high1,2. Therefore, development of novel therapeutic options with broad-spectrum anti-coronavirus activities are urgently needed. Here, we develop an orally-available bispecific inhibitor, TMP1, which simultaneously targets key coronavirus replication protease Mpro and the essential airway protease TMPRSS23,4. TMP1 shows broad-spectrum protection not only against different SARS-CoV-2 variants but also against multiple human-pathogenic coronaviruses in vitro. By using the K18-hACE2 transgenic mouse, hDPP4 knock-in mouse and golden Syrian hamster models, we demonstrate TMP1 cross-protects against highly-pathogenic coronaviruses (SARS-CoV-1, SARS-CoV-2 and MERS-CoV) in vivo and efficiently abrogates SARS-CoV-2 transmission. Through structural and mutagenesis studies, we confirmed the direct interaction of TMP1 with Mpro and TMPRSS2, and pinpoint the key sites of interactions. Importantly, TMP1 inhibits the infection of nirmatrelvir-resistant SARS-CoV-2 escape mutants. Together, our findings demonstrate the antiviral potential of the novel bispecific Mpro/TMPRSS2 antiviral design against human-pathogenic coronaviruses and other emerging coronaviruses.

Keywords: COVID-19; Mpro; SARS-CoV-2; TMPRSS2; bispecific inhibitor; in vivo.


Figures

Figure 1
Figure 1. Discovery of the Mpro/TMPRSS2 bispecific inhibitor with highly potent anti-coronavirus efficacy.
(a) Schematic illustration of the screening workflow for the discovery of Mpro/TMPRSS2 bispecific inhibitor. (b) Quantification of the subgenomic envelope (sgE) gene in VeroE6-TMPRSS2 cells (n=6) infected with wildtype SARS-CoV-2 and Alpha, Beta, Delta, Omicron (BA.1 and JN.1) variants in the presence or absence of TMP1. Lysates were harvested at 24 hpi. for one-step reverse transcription and quantitative polymerase chain reaction (RT-qPCR) analysis. (c) Infectious viral titres in the supernatants harvested at 24 hpi. from VeroE6-TMPRSS2 cells (n=4) infected with wildtype SARS-CoV-2 and Alpha, Beta, Delta, Omicron (BA.1 and JN.1) variants were determined by plaque assays. Number of plaques were normalized to those recovered from supernatants with mock treatment only. (d) Quantification of the nucleocapsid (N) gene in VeroE6-TMPRSS2 cells (n=6) infected with SARS-CoV-1 and MERS-CoV or in Huh7 cells infected with HCoV-229E at 24 hpi.. (e) Infectious viral titres in the supernatants harvested at 24 hpi. from VeroE6-TMPRSS2 cells (n=4) infected with SARS-CoV-1 and MERS-CoV or Huh7 infected with HCoV-229E were determined in VeroE6-TMPRRS2 (for SARS-CoV-1 and MERS-CoV) or Huh7 cells (for HCoV-229E) by plaque assays. Each data point represents one biological repeat. Data represents mean ± SD from the indicated number of biological repeats. Data were obtained from two or three independent experiments. WT, wildtype SARS-CoV-2.
Figure 2
Figure 2. The in vivo antiviral efficacy of prophylactic and therapeutic TMP1 treatment against SARS-CoV-2 infection.
(a) Pharmacokinetics of TMP1 oral delivery in mice. 8-week-old male BALB/c mice (n=3) were orally delivered with 100 mg/kg/dose TMP1, 100 mg/kg/dose nirmatrelvir (NRV) or 20 mg/kg/dose camostat. 20 mg/kg/dose ritonavir (RTV) was also included as metabolic enhancer for combined treatment. Plasma was continuously sampled for measurement of the plasma drug (or drug metabolites) concentration with liquid chromatography-mass spectrometry (LC-MS). (b) Schematic illustration of the in vivo experiment design. 8- to 12-week-old K18-hACE2 transgenic mice were intranasally challenged with 1250 PFU SARS-CoV-2 Delta strain. Mice were orally treated with 100 mg/kg/dose TMP1 or nirmatrelvir in combination with 20 mg/kg/dose ritonavir twice per day. For prophylactic therapy (n=6), treatment onset one day prior to virus infection while therapeutic treatment (n=10) was delayed to 24 hpi. Nasal turbinate and lung tissues were harvested at 3 dpi. for virological assessment by RT-qPCR and plaque assays. For survival study, body weight and survival of the infected mice were monitored for 14 days or until death of the animal. (c) Quantification of sgE gene of SARS-CoV-2 in the nasal turbinate and lung tissues of the infected mice with prophylactic treatment at 3 dpi by RT-qPCR analysis. (d) Quantification of the infectious viral titres in the nasal turbinate and lung tissues of the infected mice with prophylactic treatment at 3 dpi by plaque assays. (e) Viral antigen expression in the nasal turbinate and lung tissues of infected mice (n=3) with prophylactic treatment at 3 dpi. was quantified with ImageJ. (f) Representative images of SARS-CoV-2 nucleocapsid (N) protein expression (black arrow) in nasal turbinate and lung tissue of the infected mice at 3 dpi. by IHC staining. Scale bar represents 100 μm. (g) Histology analysis of the nasal turbinate and lung tissue of the infected at 3dpi. by H&E staining. Scale bar represents 100 μm. Black arrowhead, nasal epithelial desquamation; open arrowhead, alveolar collapse; dashed circle, inflammation infiltrations in alveolar septa; asterisk, bronchiolar epithelium damage. (h) Body weight change of the female (n=6) and male (n=11–13) infected mice with or without TMP1 prophylactic treatment. (i) Survival of the female (n=6) and male (n=11–13) infected mice with or without TMP1 prophylactic treatment. (j) Quantification of sgE gene of SARS-CoV-2 in the nasal turbinate and lung tissues of the infected mice with delayed therapeutic treatment at 3 dpi by RT-qPCR analysis. Each data point represents one biological repeat. Data represents mean ± SD from the indicated number of biological repeats. Statistical significances were determined using one way-ANOVA with Dunnett’s multiple comparisons test (c-e), (j) and log-rank (Mantel-Cox) tests (i). Data were obtained from three independent experiments. * represented p < 0.05 and ** represented p < 0.01. *** represented p < 0.001, **** represented p < 0.0001. ns, not statistically significant; WT, wildtype SARS-CoV-2; Veh, vehicle; PAX, Paxlovid.
Figure 3
Figure 3. Efficacy of TMP1 in blocking SARS-CoV-2 transmission.
(a) Schematic illustration of SARS-CoV-2 infection in human nasal epithelial cells (hNECs). Differentiated hNECs maintained in air-liquid interface (ALI) culture were pretreated with 20 μM TMP1 or vehicle for 1 hour. After 1 h, cells were washed and infected with SARS-CoV-2 Omicron JN.1 (n=5) or KP.2 (n=5). At 2 hpi., medium at the both apical and basal side were replenished with TMP1 or vehicle only until sample harvest at 48 hpi. (b) Quantification of sgE gene in the infected cell lysates at 48 hpi. by RT-qPCR analysis. (c) Quantification of the infectious viral titres in the apical supernatants harvested from the infected hNECs at 48 hpi. by plaque assays. (d) Schematic illustration of the transmission study in golden Syrian hamsters. Index hamsters (n=6) were orally treated with 90 mg/kg TMP1 together with 12 mg/kg RTV oral delivery of TMP1 or vehicle one day prior to infection. On the infection day (Day 0), index hamsters were infected with 2000 PFU SARS-CoV-2 Delta. Treatment in the index hamsters continued until they were co-housed with naïve contact hamsters (n=6) for 5 hours to allow virus transmission. Contact hamsters were separated for single housing until sample harvest on 4 dpi.. (e) Quantification of sgE gene of SARS-CoV-2 in the nasal turbinate and lung tissues of the contact hamsters at 4 dpi by RT-qPCR analysis. (f) Quantification of the infectious viral titres in the nasal turbinate and lung tissues of the contact hamsters 4 dpi by plaque assays. (g) Quantification of viral antigen expression in nasal turbinate and lung tissues of the contact hamsters at 4 dpi. by IHC staining. Quantification was performed with ImageJ. (h) Representative images of SARS-CoV-2 nucleocapsid (N) protein expression (black arrow) in nasal turbinate and lung tissue of the contact hamsters at 4 dpi. by IHC staining. Scale bar represents 100 μm. (i) Histology analysis of the nasal turbinate and lung tissue of the infected at 4 dpi. by H&E staining. Black arrowhead, nasal epithelial desquamation; dashed circle, necrotic cell debris in the nasal cavity; open arrowhead, haemorrhage in the alveolar septa; asterisk, alveoli collapse; cross, inflammatory infiltration in alveolar septa. Scale bar represents 100 μm. Each data point represents one biological repeat. Data represents mean ± SD from the indicated number of biological repeats. Statistical significances were determined using two-tailed Student’s t-test (b-c) and (e-g). Data were obtained from three independent experiments. * represented p < 0.05 and ** represented p < 0.01. Veh, vehicle.
Figure 4
Figure 4. Cross-protection of TMP1 against highly-pathogenic human coronaviruses in vivo.
(a) Schematic illustration of SARS-CoV-1 infection in K18-hACE2 transgenic mice. 8- to 12-week-old K18-hACE2 transgenic mice were intranasally infected with 500 PFU SARS-CoV-1. One day prior to infection, mice were orally treated with 100 mg/kg/dose TMP1 in combination with 20 mg/kg/dose RTV (n=8). Control mice were treated with vehicle only (n=8). Mice were treated twice per day until sample harvest at 3 dpi. (b) Quantification of sgE gene of SARS-CoV-1 in the nasal turbinate and lung tissues of the infected mice with prophylactic treatment at 3 dpi by RT-qPCR analysis. (c) Quantification of the infectious viral titres in the nasal turbinate and lung tissues of the SARS-CoV-1-infected mice at 3 dpi by plaque assays. (d) Viral antigen expression in the nasal turbinate and lung tissues of the SARS-CoV-1-infected mice (n=3) at 3 dpi. was quantified with ImageJ. (e) Representative images of SARS-CoV-1 nucleocapsid (N) protein expression (black arrow) in nasal turbinate and lung tissues of the SARS-CoV-1-infected mice at 3 dpi. by IHC staining. Scale bar represents 100 μm. (f) Histology analysis of the nasal turbinate and lung tissues of the SARS-CoV-1-infected mice at 3 dpi. by H&E staining. Black arrowhead, nasal epithelial desquamation; asterisk, haemorrhage in nasal submucosal region; dashed circle, necrotic cell debris in nasal cavity; open arrowhead, alveolar collapse; cross, inflammatory infiltration. Scale bar represents 200 μm. (g) Schematic illustration of MERS-CoV infection in hDPP4-knockin (hDPP4-KI) transgenic mice. 10- to 14-week-old hDPP4-KI mice were intranasally infected with 5000 PFU of mouse-adapted MERS-CoV. One day prior to infection, mice were orally treated with 100 mg/kg/dose TMP1 in combination with 20 mg/kg/dose RTV (n=5). Control mice were treated with vehicle only (n=5). Mice were treated twice per day until sample harvest at 3 dpi. (h) Quantification of N gene of MERS-CoV in the nasal turbinate and lung tissues of the infected mice at 3 dpi by RT-qPCR analysis. (i) Quantification of the infectious viral titres in the nasal turbinate and lung tissues of the MERS-CoV-infected mice at 3 dpi by plaque assays. Each data point represents one biological repeat. Data represents mean ± SD from the indicated number of biological repeats. Statistical significances were determined using two-tailed Student’s t-test (b-d) and (h-i). Data were obtained from three independent experiments. * represented p < 0.05 and ** represented p < 0.01. Veh, vehicle.
Figure 5
Figure 5. Specific inhibition of TMP1 against TMPRSS2 enzymatic activity and TMPRSS2-dependent pseudovirus entry.
(a) Surface plasmon resonance (SPR) analysis of TMP1 with TMPRSS2. (b) Enzymatic activity of recombinant TMPRSS2 with TMP1 treatment. Enzymatic activity of the recombinant TMPRSS2 was measured by fluorescence resonance energy transfer (FRET) assays (n=4). Fluorescence signals were normalized to the readouts of mock-treated wells. (c) Inhibition of pseudovirus entry by TMP1. VeroE6-TMPRSS2 and Huh7 cells were pre-treated with TMP1 for 1 h. VeroE6-TMPRRS2 cells were transduced with pseudoviruses carrying SARS-CoV-2 wildtype spike (S) (n=4). Huh7 cells transfected with TMPRSS2 were transduced with pseudoviruses carrying SARS-CoV-1-S (n=4), MERS-CoV-S (n=4) or HCoV-229E-S (n=4). Pseudovirus entry was quantified by measuring the luciferase signal at 24 hours post transduction. Luminescence signals were normalized to the readouts of mock-treated wells. (d) Representative images of TMPRSS2-dependent cell-cell fusion. 293T cells were co-transfected with SARS-CoV-2-S and GFP1–10 (effectors cells). Target cells followed were co-transfected with hACE2, TMPRSS2, and GFP11 (target cells). Prior to effector and target cell co-culture, target cells were pre-treated with TMP1 or camostat for 30 mins, followed by co-culture at 1:1 ratio for 24 hours in the presence of TMP1 and camostat. TMPRSS2-mediated cell-cell fusion was visualized by immunofluorescence microscope. Scale bar represents 200 μm. (e) Quantification of the fluorescence signals of cell-cell fusion assays as described in Figure 5d. Quantification of the fluorescence signals were performed with ImageJ. RFU, relative fluorescence units. (f) Mode of binding between TMPRSS2 (in blue-white, PDB accession: 7MEQ) and TMP1 (in orange). Residues in close proximity of the interaction interface were shown as blue-white sticks. Key amino acids confirmed by mutagenesis assays were highlighted in red. The distally-located amino acid W461 included as negative control in the mutagenesis assay was also shown. Hydrogen bonds were represented as red dashed lines. (g) Enzymatic assays with TMPRSS2 mutants carrying key residues located in the TMP1-TMPRSS2 interaction interface. Enzymatic activities of the recombinant TMPRSS2 mutants with or without TMP1 treatment were determined by FRET-based enzymatic assays (n=4). Enzymatic activities were determined by normalization of the fluorescence signals to the readouts of mock-treated control wells. (h) Fold change of change in IC50 of TMP1 against TMPRSS2 mutants compared with wildtype TMPRSS2. Each data point represents one biological repeat. Data represents mean ± SD from the indicated number of biological repeats. Statistical significances were determined using one way-ANOVA with Dunnett’s multiple comparisons test (c) and (e). Data were obtained from three independent experiments. * represented p < 0.05 and ** represented p < 0.01, **** represented p < 0.0001, ns, not statistically significant.
Figure 6
Figure 6. Specific inhibition of TMP1 against coronavirus Mpro and its antiviral efficacy against nirmatrelvir-resistant SARS-CoV-2 escape mutant.
(a) Crystal structure of TMP1 in complex with SARS-CoV-2 Omicron Mpro. Left panel, The co-crystal structure (PDB: 9IZB) of TMP1 (orange) in complex with SARS-CoV-2 Omicron Mpro (grey). The H41 (blue) and C145 (yellow) catalytic dyad was shown. The S1′, S1, and S2 pockets of Mpro are labelled in red. The Fo-Fc electron density map of TMP1 is shown in gray mesh (σ = 2.5). Right panel, close-up view of TMP1 with the substrate binding pocket of Mpro. The residues of Mpro involved in TMP1 binding were displayed by sticks. The hydrogen bonds were displayed as red dashed lines. The covalent-bond between Cys145 and TMP1 warhead was indicated by a black arrow. (b) Superimposition of the TMP1 in complex with Mpro from 9 coronaviruses including SARS-CoV-2 (Omicron, PDB: 9IZB), HCoV-229E (PDB: 2ZU2), -NL63 (7E6M), -OC43, -HKU1, SARS-CoV-1 (PDB: 1WOF), MERS-CoV (PDB: 4RSP), RaTG13 and GX/P3B. (c) Enzymatic activity of recombinant SARS-CoV-2 Mpro with TMP1 treatment. Enzymatic activity of the recombinant SARS-CoV-2 Mpro was measured by fluorescence resonance energy transfer (FRET) assays (n=4). Fluorescence signals were normalized to the readouts of mock-treated wells. (d) Quantification of the sgE gene in VeroE6 cells (n=6) infected with wildtype SARS-CoV-2 and Alpha, Beta, Delta, Omicron (BA.1 and XBB1.5) variants, followed by treatment with TMP1 or vehicle only at 1 hpi.. Lysates were harvested at 24 hpi. for one-step reverse transcription and quantitative polymerase chain reaction (RT-qPCR) analysis. (e) Quantification of the N gene of SARS-CoV-1 and MERS-CoV in VeroE6 cells (n=6) infected with SARS-CoV-1 or MERS-CoV, followed by treatment with TMP1 or vehicle only at 1 hpi.. Lysates were harvested at 24 hpi. for one-step reverse transcription and quantitative polymerase chain reaction (RT-qPCR) analysis. (f) Sensitivity of recombinant SARS-CoV-2 Mpro mutants to TMP1 treatment. Inhibition of TMP1 against the recombinant SARS-CoV-2 Mpro mutants carrying reported nirmatrelvir-resistant mutations was measured by fluorescence resonance energy transfer (FRET) enzymatic assays (n=3). Fold change in the IC50 was obtained by comparing with that of the wildtype Mpro. (g) Schematic illustration of characterizing the in vitro and in vivo antiviral efficacy of TMP1 against nirmatrelvir-resistant recombinant SARS-CoV-2. Recombinant SARS-CoV-2 was constructed with NSP5-E166V mutation in the background of ancestral SARS-CoV-2 with D614G mutation in the spike (rSARS-CoV-2-NSP5-E166V). For in vitro infection, Calu3 cells were pretreated with TMP1 for 1 hour followed by infection with rSARS-CoV-2-NSP5-E166V (n=4). Lysates were harvested at 24 hpi. for RNA extraction. For in vivo infection, 8- to 12-week-old K18-hACE2 transgenic mice were challenged with 5000 PFU rSARS-CoV-2-NSP5-E166V. One day prior to infection, mice were orally treated with 100 mg/kg/dose TMP1 in combination with 20 mg/kg/dose RTV (n=4). Control mice were treated with vehicle only (n=4). Mice were treated twice per day until sample harvest at 3 dpi. (h) Quantification of the sgE gene in Calu3 cells (n=6) infected with rSARS-CoV-2-NSP5-E166V, followed by treatment with TMP1 or vehicle only at 1 hpi.. Lysates were harvested at 24 hpi. for one-step reverse transcription and quantitative polymerase chain reaction (RT-qPCR) analysis. (i) Quantification of SARS-CoV-2 sgE gene in the nasal turbinate and lung tissues of the rSARS-CoV-2-NSP5-E166V infected mice at 3 dpi by RT-qPCR analysis. (j) Quantification of the infectious viral titres in the nasal turbinate and lung tissues of the rSARS-CoV-2-NSP5-E166V infected mice at 3 dpi by plaque assays. Each data point represents one biological repeat. Data represents mean ± SD from the indicated number of biological repeats. Statistical significances were determined using one way-ANOVA with Dunnett’s multiple comparisons test (i-j) and two-tailed Student’s t-test (f). Data were obtained from three independent experiments. * represented p < 0.05, ** represented p < 0.01, *** represented p < 0.001, ns, not statistically significant. Veh, vehicle; NRV, nirmatrelvir; PAX, Paxlovid.

Similar articles

References

    1. Lednicky JA et al. (2021) Independent infections of porcine deltacoronavirus among Haitian children. Nature 600:133–137. 10.1038/s41586-021-04111-z - DOI - PMC - PubMed
    1. Vlasova AN et al. (2022) Novel Canine Coronavirus Isolated from a Hospitalized Patient With Pneumonia in East Malaysia. Clin Infect Dis 74:446–454. 10.1093/cid/ciab456 - DOI - PMC - PubMed
    1. Hoffmann M et al. (2020) SARS-CoV-2 Cell Entry Depends on ACE2 and TMPRSS2 and Is Blocked by a Clinically Proven Protease Inhibitor. Cell 181, 271–280 e278, 10.1016/j.cell.2020.02.052 - DOI - PMC - PubMed
    1. Anand K, Ziebuhr J, Wadhwani P, Mesters JR, Hilgenfeld R (2003) Coronavirus main proteinase (3CL) structure:: Basis for design of anti-SARS drugs. Science 300:1763–1767. 10.1126/science.1085658 - DOI - PubMed
    1. Corman VM, Muth D, Niemeyer D, Drosten C (2018) Hosts and Sources of Endemic Human Coronaviruses. Adv Virus Res 100:163–188. 10.1016/bs.aivir.2018.01.001 - DOI - PMC - PubMed

Publication types

LinkOut - more resources