[Preprint]. 2024 Nov 21:rs.3.rs-5397327.
doi: 10.21203/rs.3.rs-5397327/v1.

Short-chain fatty acids are a key mediator of gut microbial regulation of T cell trafficking and differentiation after traumatic brain injury

Affiliations

Short-chain fatty acids are a key mediator of gut microbial regulation of T cell trafficking and differentiation after traumatic brain injury

Marta Celorrio et al. Res Sq. .

Update in

Abstract

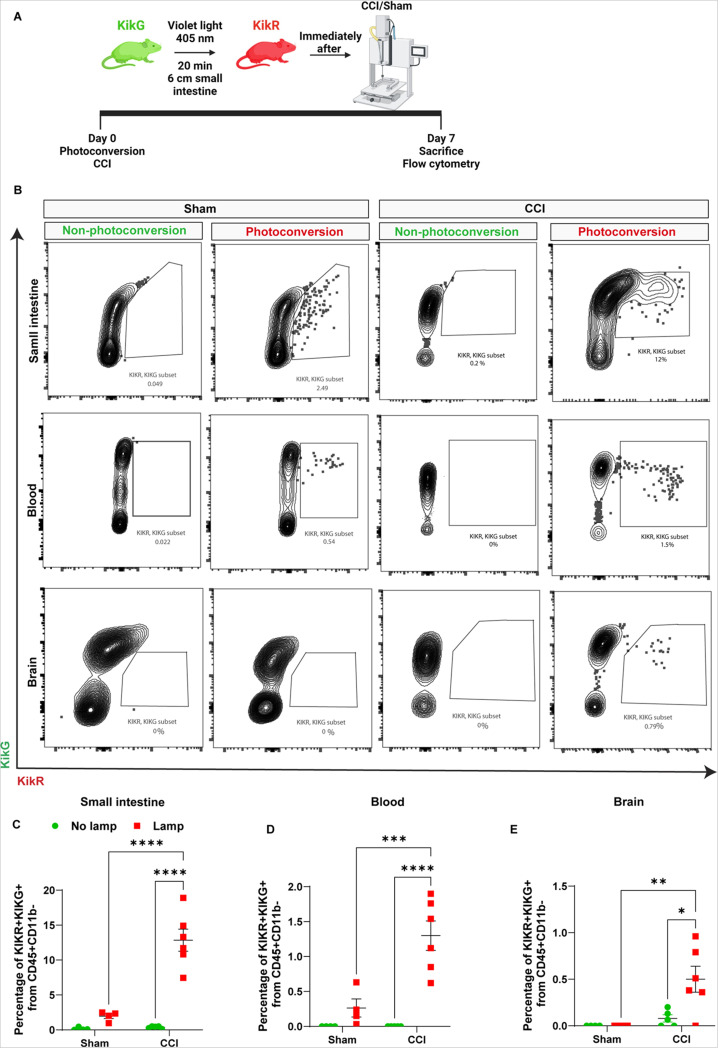
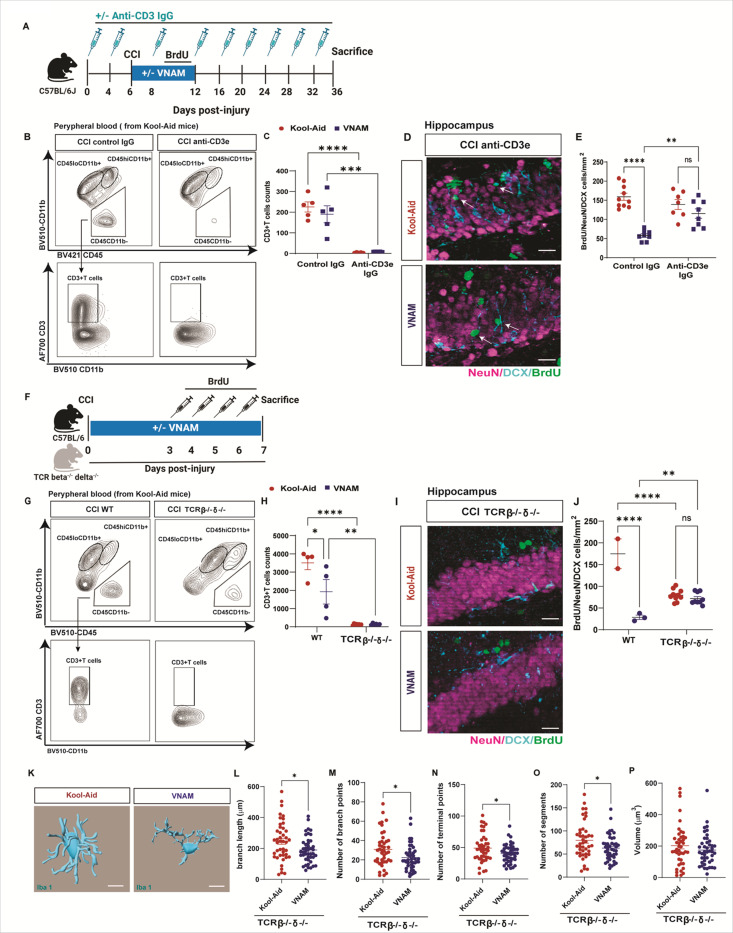
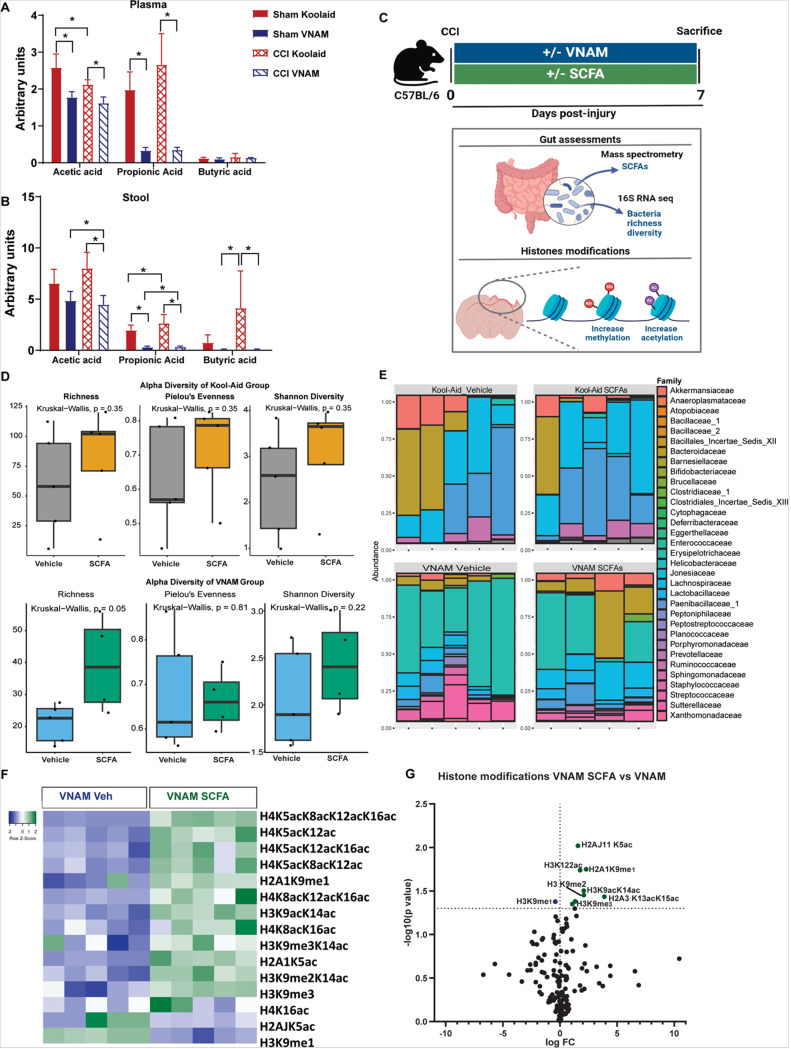
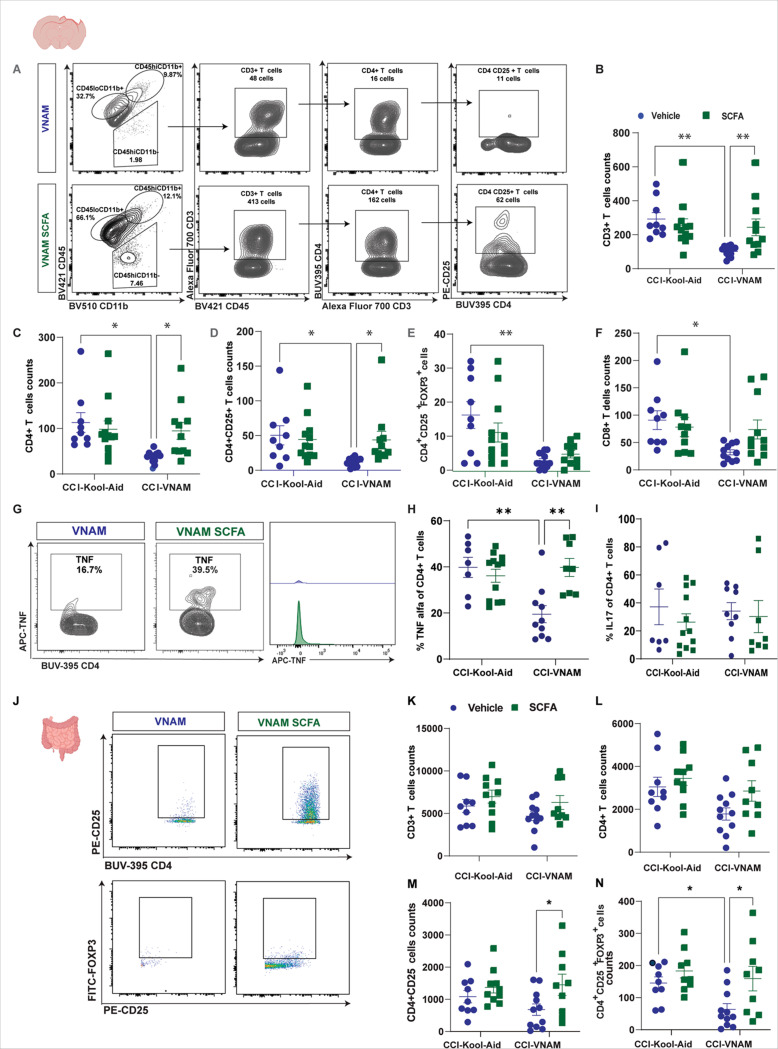
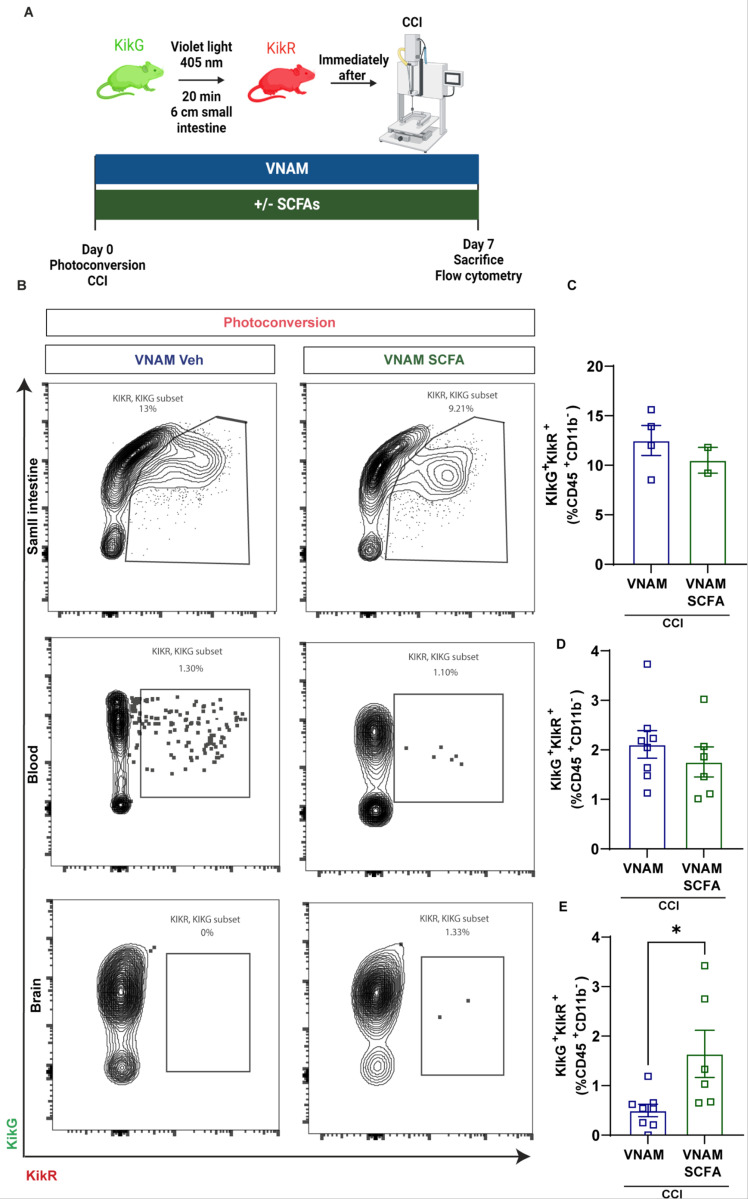
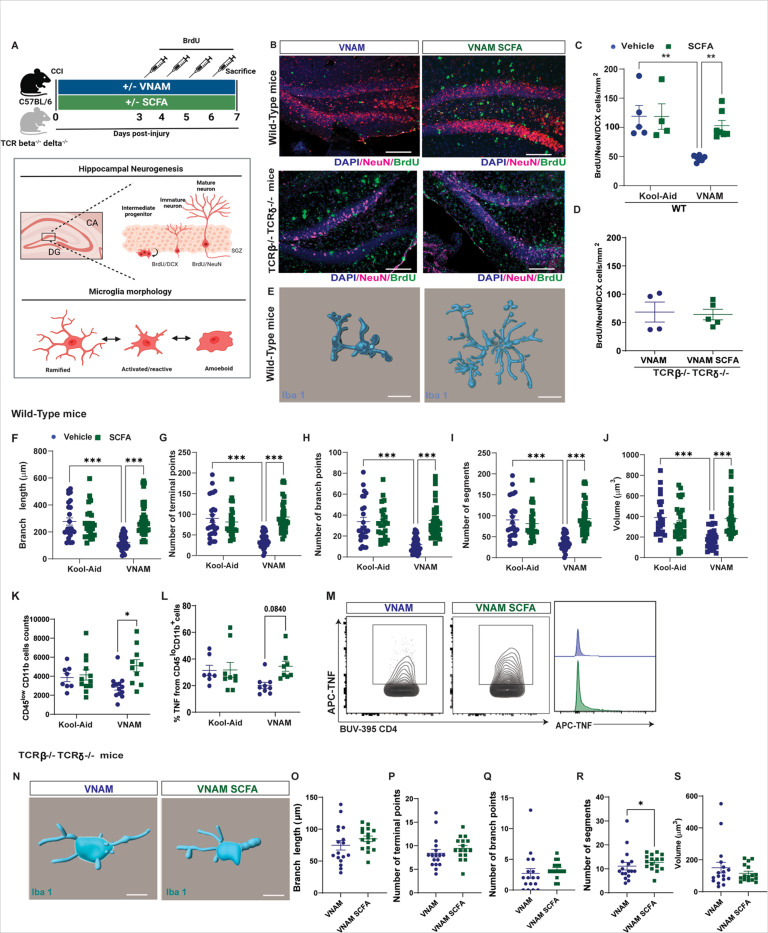
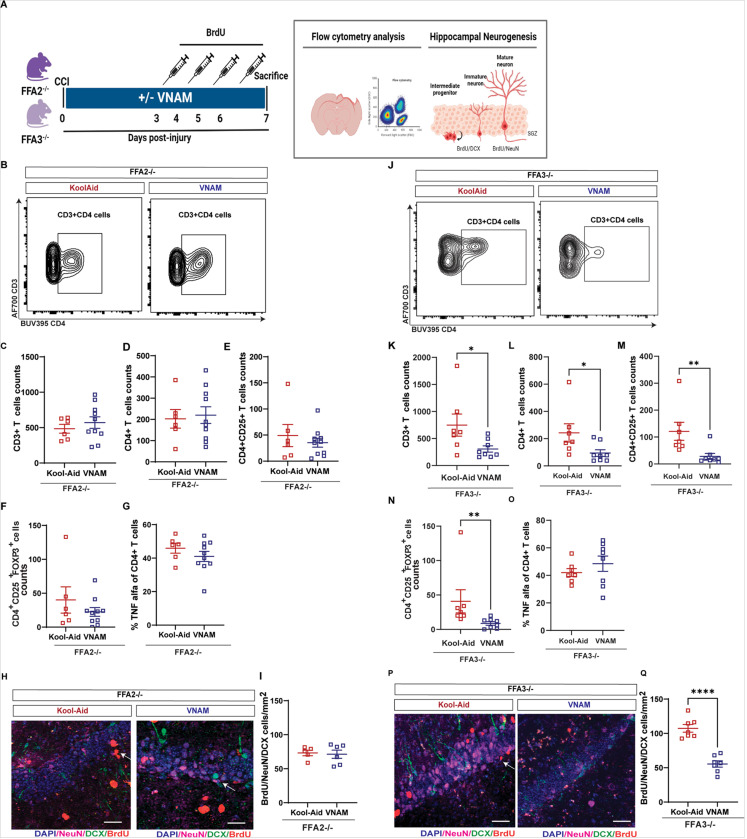
The gut microbiota has emerged as a pivotal regulator of host inflammatory processes after traumatic brain injury (TBI). However, the mechanisms by which the gut microbiota communicates to the brain in TBI are still under investigation. We previously reported that gut microbiota depletion (GMD) using antibiotics after TBI resulted in increased microglial activation, reduced neurogenesis, and reduced T cell infiltration. In the present study, we have demonstrated that intestinal T cells contribute to the pool of cells infiltrating the brain after TBI. Depletion or genetic deletion of T cells before injury reversed GMD induced reductions in post-TBI neurogenesis. Short-chain fatty acid supplementation increased T regulatory and T helper1 cell infiltration to the brain along with restoring neurogenesis and microglia activation after TBI with GMD. These data suggest that T cell subsets are essential cellular mediators by which the gut microbiota modulates TBI pathogenesis, a finding with important therapeutic implications.

Keywords: T cell-trafficking; T cells; Traumatic brain injury; gut microbiome; gut microbiota depletion; gut-brain axis; microglia; neurogenesis; neuroinflammation; short-chain fatty acids.


Conflict of interest statement

Competing interests: The authors declare that they have no competing interests.

Figures

Figure 1
Figure 1. Intestinal T-cell reservoirs contribute to the pool of cells that infiltrate the brain after TBI.
A) Experimental design for analysis of KikGR mice. Photoconversion of the distal part of the small intestine is induced using violet light right before CCI or sham, and the photoconverted lymphocytes (CD45+CD11bKikR+) cells are analyzed in SI, blood, and brain by spectral flow cytometry 7 days after CCI. B) Spectral flow cytometric gating strategy in photoconverted (KikR+) mice. Lymphocytes (CD45+CD11b) that expresses the red form (KikR+) cells 7 days after sham and CCI surgery and with and without photoconversion. Mean values are plotted ± SEM, two-way ANOVA followed by Tukey’s multiple comparisons. F statistic for photoconversion*injury presented unless otherwise noted (*p < 0.05, **p < 0.01 ***p < 0.001, ****p < 0.0001), n = 4–6 per group. C) Frequency of photoconverted lymphocytes (CD45+CD11bKikR+) in the small intestine (lamina propia) F(1, 15) = 25.43, p=0.0001, D) blood F(1, 15)= 12.14, p=0.0033 and E) brain (cortex and hippocampus) F(1, 15)= 5.031, p=0.0404. Abbreviations: KikGR, Kikume Green-Red (KikGR) photoconvertible fluorescent protein; CCI, controlled cortical impact.
Figure 2
Figure 2. Depleting T cells before an injury counteracts the effects of gut microbiota depletion on neurogenesis and reduces microglial activation.
A) 8-week-old mice were randomized to anti-CD3e or control IgG. Mice receive IP injections 6 and 2 days prior injury and every 4 days after injury starting on post-injury Day#2. Mice underwent CCI and were them randomized to Kool-Aid or VNAM in drinking water for 1 week. BrdU was injected in the last 4 days of VNAM administration. Mean values are plotted ± SEM, two-way ANOVA followed by Tukey’s multiple comparisons. F statistic for antibiotics*CD3 depletion presented unless otherwise noted (*p < 0.05, **p < 0.01 ***p < 0.001, ****p < 0.0001), n = 4–6 per group. B) Representative dot plots of gating strategy of CD3+T cells from a Kool-Aid mouse. C) Quantification of CD3+T cells in the blood FCD3 depletion (1,16)= 69.83, p<0.0001. D) Representative images of injured brain of BrdU/NeuN/DCX positive cells. Scale bar 20 μm. E) Density of BrdU/NeuN/DCX positive cells in the ipsilateral hippocampus Fantibiotics (1,29)= 7.128, p=0.0123. F) Experimental design TCRβ−/−TCRδ −/− mice 7 days survival. G) Representative dot plots of gating strategy of CD3+T cells from a Kool-Aid mouse. H) Quantification of CD3+T cells in the blood F(1, 18)= 9.723 p=0.0059. I) Representative images of injured brain of BrdU/NeuN/DCX positive cells. Scale bar 20 μm. J) Density of BrdU/NeuN/DCX positive cells in the ipsilateral hippocampus F(1, 20)= 66.17, p<0.0001. E) Representative images of 3D microglia (Iba1+cells) reconstruction of Kool-Aid and VNAM groups. Microglia morphology analysis of L) dendrite length, M) branch points, N) terminal points, and O) volume. Mean values are plotted ± SEM, unpaired t-test *p < 0.05, n = 43–44 cells per group. Abbreviations: CCI, controlled cortical impact; VNAM, vancomycin, ampicillin, neomycin, and metronidazole; DCX, doublecortin; BrdU, Bromodeoxyuridine; TCR, T cell receptor.
Figure 3
Figure 3. SCFAs induced brain epigenetic changes without altering bacterial population.
A) Plasma and B) stool measurements of SCFAs via liquid chromatography one week after injury. C) Experimental strategy where mice were treated with and without VNAM supplemented or not supplemented with the mix of the most frequent SCFAs: acetate, butyrate, and propionate for 7 days post TBI. D) Graph depicts of richness, Pielous’s evenness, and Shannon a-diversity index of grouped data. E) Family-level phylogenetic classification of fecal 16S rDNA gene frequencies from before euthanasia (Day 7). Each bar represents an individual animal. Only families with a frequency >5% were included. F) Heat map of selected histones modifications in the brain of VNAM-treated mice with and without SCFA supplementation. G) Log2FC – log10P volcano plot of all detected histone post-translational modifications in the brain of VNAM-treated mice with or without SCFAs. Green dots depict P < 0.05 in the and black color indicate no significant differences comparing SCFAs treatment vs no treatment in the brain. Abbreviations: CCI, controlled cortical impact; VNAM, vancomycin, ampicillin, neomycin, and metronidazole; SCFAs, short-chain fatty acids.
Figure 4
Figure 4. SCFAs rescue T cell differentiation and trafficking to the brain at 1-week post-injury with GMD.
A) Flow cytometric gating strategy of the brain (cortex + hippocampus) of 7 days post-injury with GMD with and without SCFAs supplementation. Mean values are plotted ± SEM, two-way ANOVA followed by Newman-Keuls’multiple comparisons. F statistic for antibiotics*SCFAs treatment presented unless otherwise noted (*p < 0.05, **p < 0.01), n = 9–13 per group. Quantification of cell absolute numbers in the injured brain B) CD3+T cells F(1, 41)=6.300, p=0.0161. C) CD4+T cells, F(1, 41)= 5.055, p=0.0300. D) CD4+CD25+T cells, Fantibiotics(1, 41)=4.164, p=0.0478. E) CD4+CD25+FoxP3+T cells, Fantibiotics(1, 41)=5.032, p=0.0304. F) CD8+T cells Fantibiotics(1, 41)=4.773, p=0.0347. G) Flow cytometry gating strategy and histogram of percentage of TNFα from CD4+T cells. H) Frequency of TNFα from CD4+T cells F(1, 33)=10.6, p=0.0026 and I) frequency of IL17 from CD4+T cells. J) Flow cytometric gating strategy of the small intestine (lamina propia) n = 9–11 per group. Quantification of cell absolute numbers in the lamina propia, K) CD3+T cells, L) CD4+T cells, M) CD4+CD25+T cells FSCFAs(1, 35)=5.763, p=0.0218, N) CD4+CD25+FoxP3+T cells Fantibiotics(1, 34) = 4.473, p=0.0418, FSCFAs(1, 34) = 7.106, p=0.0117. Abbreviations: CCI, controlled cortical impact; VNAM, vancomycin, ampicillin, neomycin, and metronidazole; SCFAs, short-chain fatty acids.
Figure 5
Figure 5. Intestinal T cells infiltration and differentiation into the brain 7 days after TBI with GMD.
A) Experimental design for analysis of KikGR mice. Photoconversion of the distal part of the small intestine is induced using violet light right before CCI, and the photoconverted lymphocytes (CD45+CD11bKikR+) cells are analyzed in SI, blood, and brain by spectral flow cytometry 7 days after CCI with GMD with or without SCFAs supplementation. B) Flow cytometric gating strategy in photoconverted (KikR+) mice of SI, blood and brain. Lymphocytes (CD45+CD11b) that expresses the red form (KikR+) cells 7 days after CCI. C) Frequency of photoconverted lymphocytes (CD45+CD11bKikR+) in the small intestine (lamina propia), D) blood and E) brain (cortex and hippocampus). Mean values are plotted ± SEM, unpaired t-test *p < 0.05, n = 6–8 per group. Abbreviations: KikGR, Kikume Green-Red (KikGR) photoconvertible fluorescent protein; CCI, controlled cortical impact; VNAM, vancomycin, ampicillin, neomycin, and metronidazole; SCFAs, short-chain fatty acids.
Figure 6
Figure 6. SCFAs restore microglia morphology and neurogenesis at 1-week post-injury with microbiota depletion in a T cell-dependent manner.
A) Experimental design for analysis of neurogenesis and microglia morphology 7 days after TBI with GMD with and without SCFAs supplementation. B) Representative images of injured hippocampus of DAPI/NeuN/BrdU positive cells. Mean values are plotted ± SEM, two-way ANOVA followed by Tukey’s multiple comparisons. F statistic for antibiotics*SCFAs presented unless otherwise noted (*p < 0.05, **p < 0.01), n = 4–6 per group. C) Density of BrdU/NeuN/DCX positive cells in the ipsilateral hippocampus in wild type mice F(1, 19)=5.15, p=0.0350, n=4–7, and in D) TCRβ−/−TCRδ−/− mice, n=4–5. Mean values are plotted ± SEM, unpaired t-test *p < 0.05, n = 6–8 per group. E) Representative images of 3D microglia (Iba1+cells) reconstruction of VNAM and VNAM SCFA in the injured hippocampus. Scale bar: 50 μm. Mean values are plotted ± SEM, two-way ANOVA followed by Tukey’s multiple comparisons. F statistic for antibiotics*SCFAs presented unless otherwise noted (*p < 0.05, **p < 0.01 ***p < 0.001, ****p < 0.0001), n = 32–35 per group. F) Imaris analysis of microglia morphology of branch length F(1, 112)=19.08, p<0.0001, G) terminal points F(1, 112)=23.89, p<0.0001, H) branch points F(1, 112)=16.76, p<0.0001, I) segments F(1, 112)=23.89, p<0.0001 and J) volume F(1, 112)=20.46, p<0.0001. Scale bar: 30 μm. K) Flow cytometric gating strategy of TNFα+microglia cells and TNFα+microglia histogram. L) Total counts of microglia (CD45loCD11b+ cells) F(1, 41)=5.508, p=0.0238. M) Frequency of TNFα from microglia FSCFAs(1, 29)=3.127, p=0.0875. N) Representative images of 3D microglia (Iba1+cells) reconstruction of VNAM and VNAM SCFA in the TCRβ−/−TCRδ−/− injured hippocampus. Imaris analysis of microglia morphology of O) branch length, P) number of terminal points, Q) number of branch points, R) number of segments and S) volume. Scale bar: 30 μm. Mean values are plotted ± SEM, unpaired t-test *p < 0.05, n = 17–16 microglia per group. Abbreviations: CCI, controlled cortical impact; VNAM, vancomycin, ampicillin, neomycin, and metronidazole; SCFAs, short-chain fatty acids, DCX, doublecortin; BrdU, Bromodeoxyuridine; TCR, T cell receptor. Created in BioRender. Steed, A. (2024) BioRender.com/q19s665.
Figure 7
Figure 7. Gut-brain communication by T cells is FFA2-dependent.
A) Experimental design of flow cytometry analysis and neurogenesis 7 days after TBI with GMD using Ffa2−/− and Ffa3−/− mice. B) Flow cytometric gating strategy of the brain (cortex + hippocampus) of 7 days post-injury with or without GMD of the Ffa2−/−. Quantification of cell absolute numbers in the Ffa2−/− injured brain C) CD3+T cells; D) CD4+T cells; E) CD4+CD25+T cells; F) CD4+CD25+FoxP3+T cells; G) Frequency of TNFα from CD4+T cells. H) Representative images of Ffa2−/− injured hippocampus of DAPI/NeuN/BrdU positive cells. Scale bar: 20 μm. I) Density of BrdU/NeuN/DCX positive cells in the Ffa2−/− ipsilateral hippocampus. J) Flow cytometric gating strategy of the brain (cortex + hippocampus) of 7 days post-injury with or without GMD of the Ffa3−/−. Quantification of cell absolute numbers in the Ffa3−/− injured brain K) CD3+T cells; L) CD4+T cells; M) CD4+CD25+T cells; N) CD4+CD25+FoxP3+T cells; O) Frequency of TNFα from CD4+T cells. P) Representative images of Ffa3−/− injured hippocampus of DAPI/NeuN/BrdU positive cells. Scale bar: 20 μm. Q) Density of BrdU/NeuN/DCX positive cells in the Ffa3−/− ipsilateral hippocampus. Mean values are plotted ± SEM, unpaired t-test ****p < 0.0001, n = 6–7 per group. Abbreviations: CCI, controlled cortical impact; VNAM, vancomycin, ampicillin, neomycin, and metronidazole; FFAR, free fatty acid receptors; DCX, doublecortin; BrdU, Bromodeoxyuridine.

Similar articles

References

    1. Masel BE, DeWitt DS. Traumatic brain injury: a disease process, not an event. J Neurotrauma. 2010;27(8):1529–40. - PubMed
    1. Roozenbeek B, Maas AI, Menon DK. Changing patterns in the epidemiology of traumatic brain injury. Nature reviews Neurology. 2013;9(4):231–6. - PubMed
    1. Simon DW, McGeachy MJ, Bayir H, Clark RSB, Loane DJ, Kochanek PM. The far-reaching scope of neuroinflammation after traumatic brain injury. Nature Reviews Neurology. 2017;13(3):171–91. - PMC - PubMed
    1. Treble-Barna A, Pilipenko V, Wade SL, Jegga AG, Yeates KO, Taylor HG, et al. Cumulative Influence of Inflammatory Response Genetic Variation on Long-Term Neurobehavioral Outcomes after Pediatric Traumatic Brain Injury Relative to Orthopedic Injury: An Exploratory Polygenic Risk Score. J Neurotrauma. 2020;37(13):1491–503. - PMC - PubMed
    1. Zhao Q, Li H, Li H, Xie F, Zhang J. Research progress of neuroinflammation-related cells in traumatic brain injury: A review. Medicine (Baltimore). 2023;102(25):e34009. - PMC - PubMed

Publication types

LinkOut - more resources