[Preprint]. 2024 Nov 20:rs.3.rs-5147104.
doi: 10.21203/rs.3.rs-5147104/v1.

Cerebellar transcranial AC stimulation produces a frequency-dependent bimodal cerebellar output pattern

Affiliations

Cerebellar transcranial AC stimulation produces a frequency-dependent bimodal cerebellar output pattern

Devry Mourra et al. Res Sq. .

Update in

Abstract

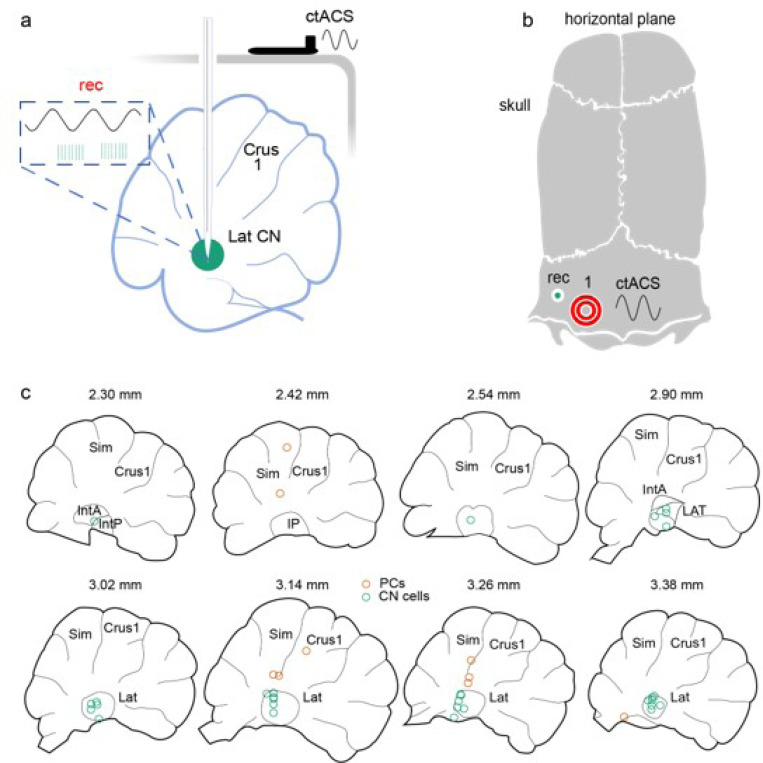
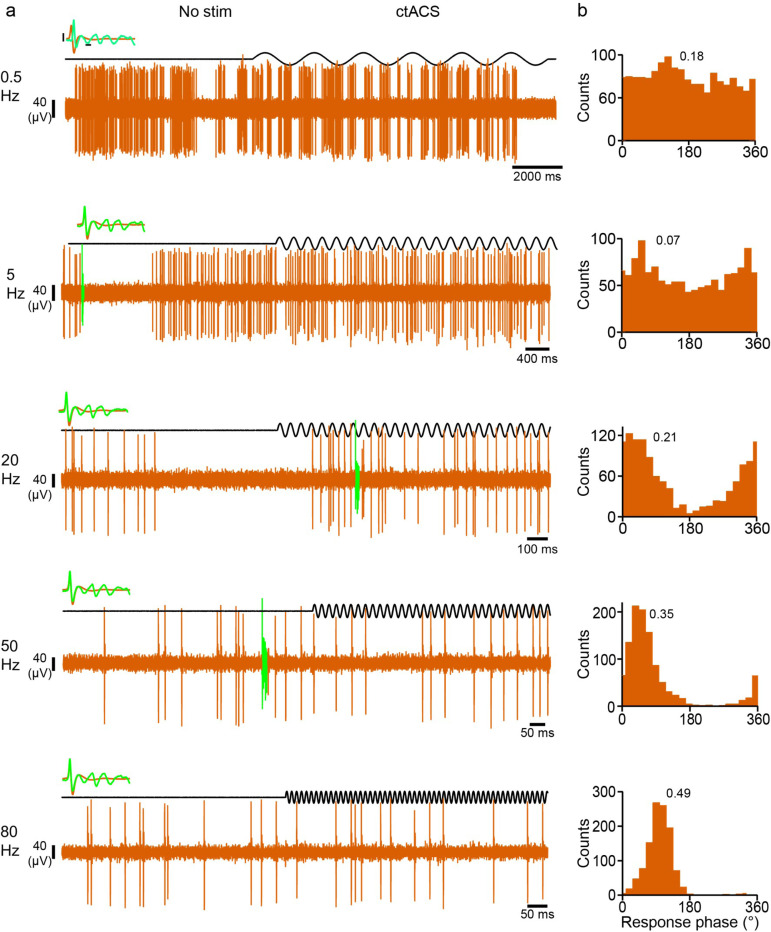
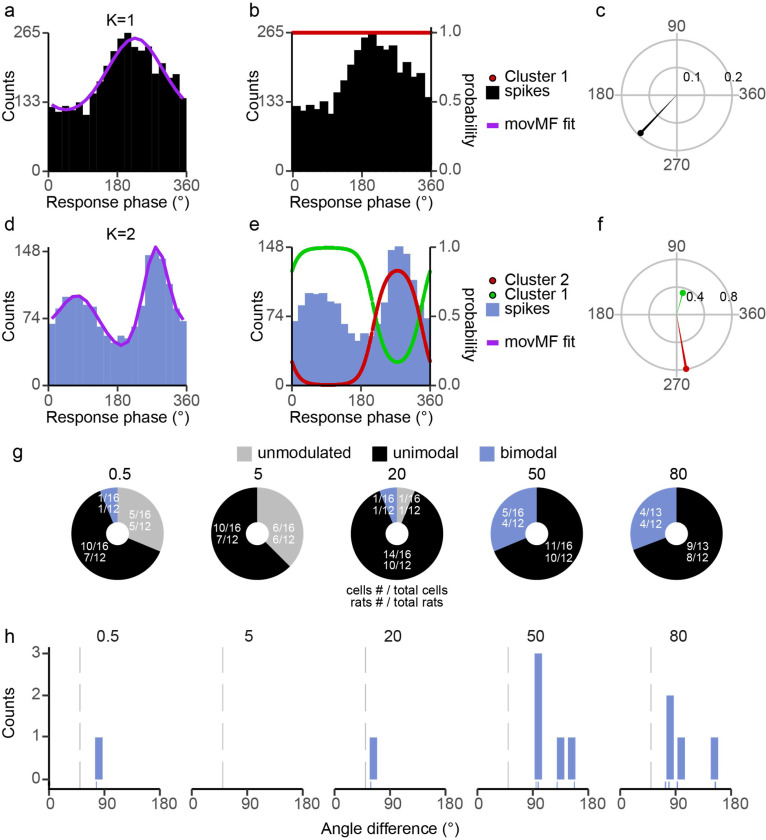
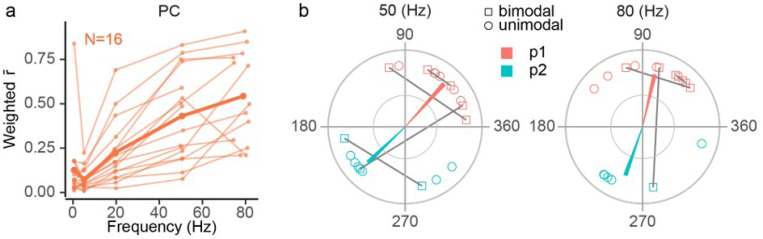
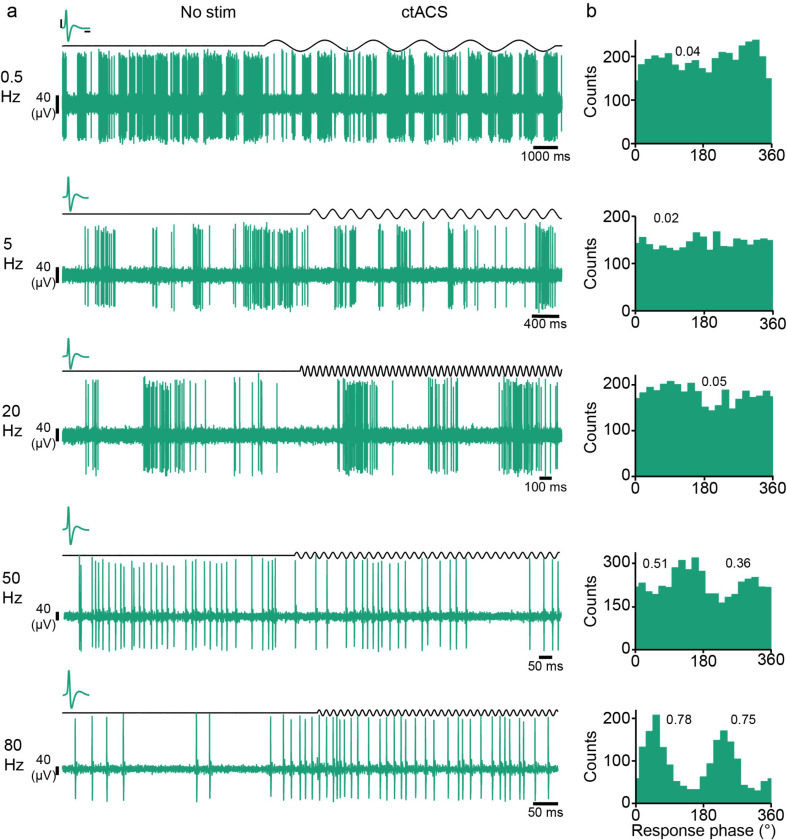
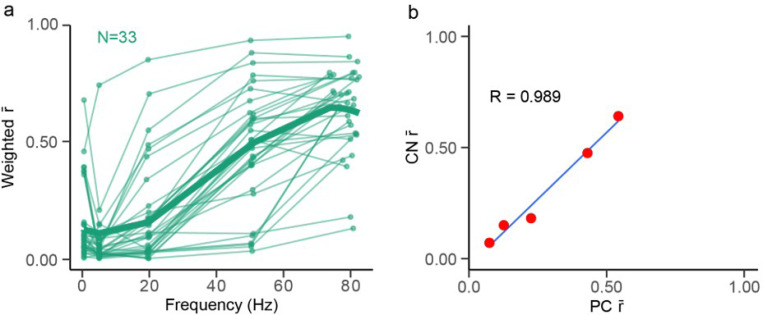
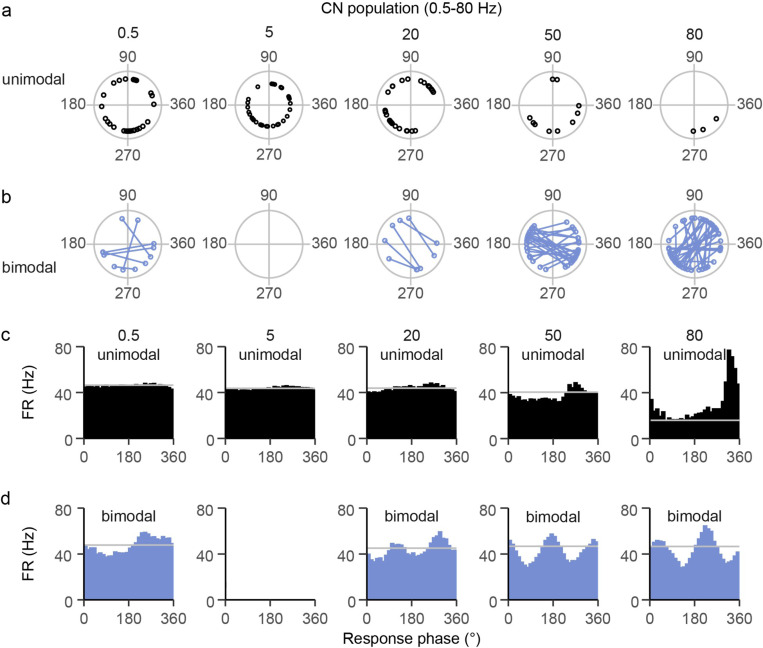
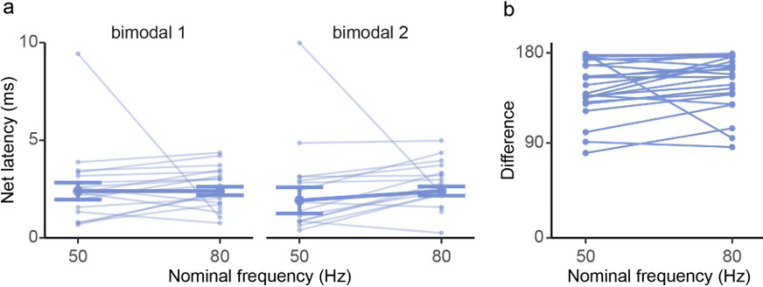
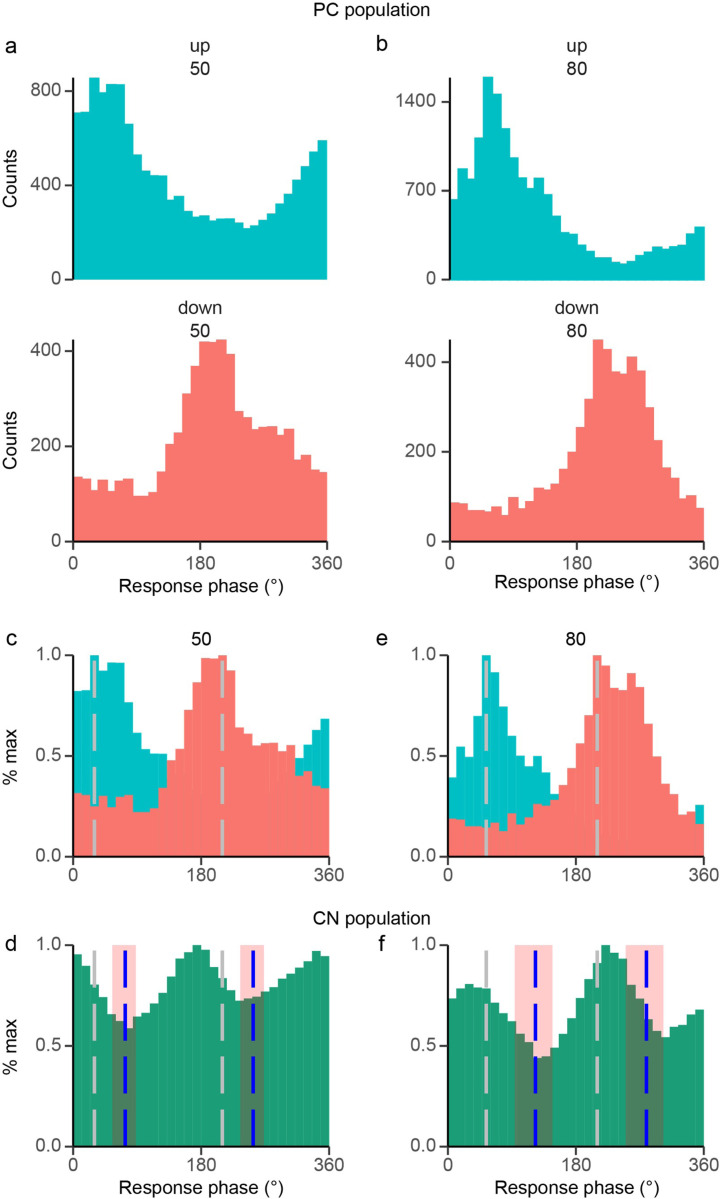
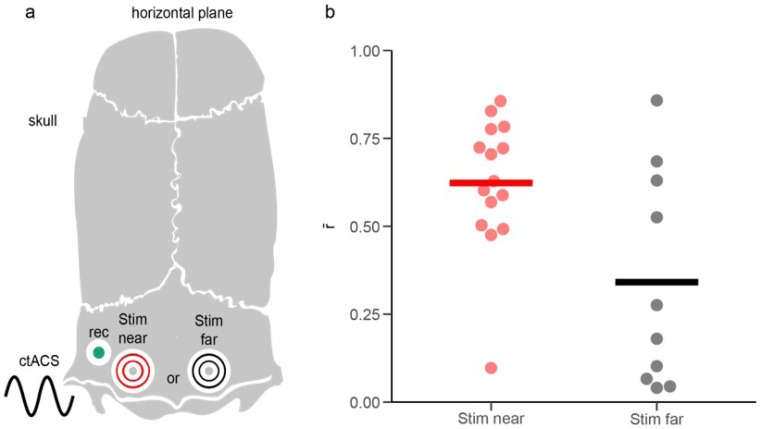
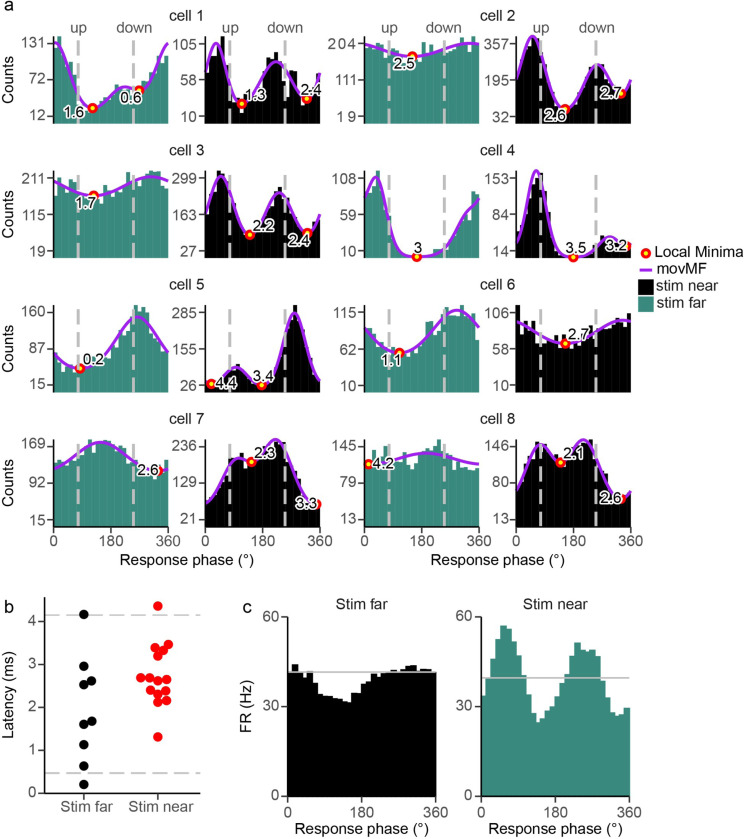
Transcranial alternating current stimulation (ctACS) has the potential to be an appealing, non-invasive treatment option for psychiatric and neurological disorders. However, its potential has been limited by significant knowledge gaps in the details and mechanisms of how ctACS affects cerebellar output on single cell and population levels. We investigated this issue by making single-unit recordings of Purkinje cells (PC) and lateral cerebellar nuclear (Lat CN) cells in response to ctACS in anesthetized adult female Sprague-Dawley rats. The ctACS electrode was positioned directly on the skull above crus 1, either ipsilaterally just medial to the recording site or contralaterally. The return electrode was placed under the skin of the shoulder ipsilateral to the recorded cell. In response to ctACS at frequencies ranging from 0.5 to 80 Hz, PC and CN activity was modulated in a frequency-dependent manner. PC and CN entrainment strength increased with stimulation frequency. Moreover, a unimodal response was seen for most PCs across all frequencies, whereas most CN cells transitioned to bimodal patterns as stimulus frequency increased. The phase of the local minima CN cells, and its change with frequency, was consistent with CN cells being driven synaptically by PC activity. Furthermore, the nearer ctACS location to the recording site, the stronger the entrainment, suggesting that ctACS electrode placement could be used to target specific cerebellar output channels. In sum, the results show that transcranial stimulation of the cerebellar cortex can modulate cerebellar output, which has potential implications for its use in treating neurological and psychiatric disorders.

Keywords: Purkinje cell; cerebellar nuclei; electric fields in neural tissue; transcranial electrical stimulation.


Conflict of interest statement

Additional Declarations: No competing interests reported. Declarations Conflict of Interest: The authors declare no competing financial interests. Competing Interests The authors declare no competing interests.

Figures

Figure 1
Figure 1
Diagram of experimental setup. (a) Sagittal schematic view of the cerebellum and overlying skull showing placement of ctACS electrodes directly on the skull above lateral crus1 and recording electrode inserted through burr hole to the CN. (b) Horizontal schematic of dorsal skull surface showing positions of the ctACS electrode on the skull above lateral crus 1 (red rings) and the burr hole for the recording electrode (green circle). (c) Schematics of parasagittal sections through the cerebellum showing the locations of histologically located PCs and CN cells (orange circles; n= 9, green circles; n= 30). Numbers above the sections indicate the mediolateral distance of the section from the midline.
Figure 2
Figure 2
Unimodal entrainment of PC activity. (a) Example extracellular recordings from a PC (orange trace) in response to interleaved periods of no stimulation and AC stimulation (black trace) for frequencies of 0.5, 5, 20, 50, and 80 Hz (top to bottom). Inset, example waveforms corresponding to each recording (SS, orange, CS green; black bars = 10 μV, 0.5 ms). (b) Histograms of (PC SS) activity with respect to the AC cycle for frequencies 0.5 (top) through 80 Hz (bottom). Histograms of spike activity triggered off the start of each sinusoidal cycle, and bins were set to 1/20 of the cycle period. The r̄ for each frequency is shown as text.
Figure 3
Figure 3
Quantification of PC SS modulation. (a) Example fit of unimodal distribution. Histogram of phase distribution of SS activity during AC stimulation at 50 Hz. For this cell, a single von Mises function (K=1, purple) was found to be the best fit. Histogram bins were set to 1/20 of the cycle period. (b) The histogram in 3a is replotted along with the probability of each spike being in the single von Mises population (K=1) plotted as a function of phase (red circles, right axis). Note population is fit by a single distribution, so probability always equal one. (c) A polar plot of the circular mean vector for the spike data from 3ab. (d) Example fit of a bimodal distribution in which a mixture of two von Mises functions was found to be the best fit (K=2), same conventions as 3a. (e) Same as 3d, except the probabilities for the two clusters are shown (k=2). (f) For bimodal cells, the circular mean vectors for each von Mises population are plotted. (g) Donut plots show the number of PC cells/rats for each entrainment class across frequency. Unmodulated (gray); significantly modulated: unimodal (black) or bimodal (blue). (h) Histogram of the minimum angle difference between circular mean vectors. For most bimodal cells the angular difference is near 90°.
Figure 4
Figure 4
PC modulation is frequency dependent. (a) Each PC’s weighted circular mean vector length (r̄) is plotted as a function of AC frequency. The bold trace reflects the population mean. (b) For 50 and 80 Hz, plots showing the phase of each PC’s circular mean vector (open circles are unimodal, open squares are bimodal) and the population vector for each cluster (p1 and p2) were calculated as a weighted average of the individual vectors (weighted the magnitude and population fraction of the von Mises population). The dark gray lines connect the two phases of bimodal cells.
Figure 5
Figure 5
CN modulation is frequency dependent. (a) Example extracellular recordings from a Lat CN cell (green traces) in response to interleaved periods of no stimulation and AC stimulus train (black traces) for frequencies 0.5 (top) through 80 Hz (bottom). Inset, waveform of CN spikes (black bars = 10 μV, 0.1 ms). (b) Histograms of Lat CN cell activity with respect to the AC cycle for frequencies 0.5 (top) through 80 Hz (bottom). The r̄ for each frequency is shown as text.
Figure 6
Figure 6
Quantification of modulation strength for CN cells. (a) Histogram and single von Mises fit (purple) to aCN cell with a unimodal distribution with 50 Hz ctACS. (b) Replotting of histogram in 6a along with probability of each spike belong to the particular von Mises distribution (red circles, right axis). (c) Circular mean vector for the unimodal CN cell in 6ab. (d) Histogram and mixture of two von Mises fit to aCN cell with a bimodal distribution during 50 Hz ctACS. (e) Replotting of histogram in 6d along with probability distributions for the two von Mises populations (green and red circles, right axis). (f) Circular mean vectors for the two von Mises spike populations of the CN cell shown in 6de. (g) Donut plots show the number of CN cells/rats for each entrainment class across frequency. Unmodulated (gray); significantly modulated: unimodal (black) or bimodal (blue). (h) Histogram of the phase differences between the two circular mean vectors of all bimodal CN cells, showing most bimodal cells tend to be close to symmetric (~180°).
Figure 7
Figure 7
CN modulation increases with frequency. (a) Individual CN cell r̄ plotted across frequency for each CN cell. For cells with bimodal responses, the average r̄ is the weighted average of the r̄ ‘s of the two von Mises populations (weighted by their alphas). The bold green trace is the predicted value from our statistical model. (b) A plot showing the linear relationship in modulation strength (r̄) between PC and CN populations, the blue line indicates the best-fit line.
Figure 8
Figure 8
CN population changes from a unimodal to a bimodal response with increasing AC frequency. (a) distribution of CN circular mean vector phases (open circles) is plotted for cells that showed an unimodal pattern at 0.5 to 80 Hz. (b) Same as ‘a’ for bimodal cells. The two vector phases of each cell are connected by a line. Note the transition from mostly unimodal cells to mostly bimodal cells as frequency increases. (c) Histograms showing the population modulation for unimodal cells in response to different AC frequencies. The gray line indicates the average spontaneous firing rate at each frequency. (d) Histograms showing the population modulation for bimodal cells in response to varying AC frequencies. The gray lines indicate the average spontaneous firing rate at each frequency. Note that no CN cells showed a bimodal response to 5 Hz stimulation.
Figure 9
Figure 9
CN population minimum rotates with AC frequency. (a) The minimum counterclockwise rotation rule (red is cluster 1, green is cluster 2) that was used to identify and track each minimum across frequencies in the bimodal cells whose von Mises fits showed two minima (filled square, phase at 50 Hz; arrowhead, phase at 80 Hz). (b) Plots of the phases of the individual cell minima (open red and green squares) at 50 and 80 Hz. Also plotted are the population minima vectors. Note the rotation of the phase distributions and vectors between 50 and 80 Hz.
Figure 10
Figure 10
CN latency is consistent with synaptic modulation by PCs. (a) The calculated latency of the minima in the CN response distribution relative to the phase of the PC peak response for each bimodal CN cell (light blue traces). The means population latency is shown as a dark blue trace. (b) The line plot shows the calculated minimum angle difference between clusters for each bimodal CN cell at 50 and 80 Hz, n=25.
Figure 11
Figure 11
PC population response is consistent with driving CN bimodal responses. (a) At 50 Hz, histograms of the PCs with circular mean vectors with phases 0° - 180° (up PCs, top) and phases 180° - 360° (down PCs, bottom). (b) Same as 11a but for 80 Hz stimulation. (c)Overlaying the two up and down PC populations histograms makes a bimodal distribution at 50 Hz. The gray dashed lines indicate the peaks of each unimodal PC distribution. (d) Population histograms of bimodal CN cell responses to 50 Hz. (e) Same as 11c but for 80 Hz. (f) Same as 11d, but for 80 Hz. For 11d and 11f, the blue dashed lines indicate the predicted time of maximal inhibition of CN activity based on the mean latency of 2.55 ms from the peak PC population response. The light red rectangles indicate the expected range of phase shifts using the reported PC - CN conduction times of 1.39 – 3.23 ms.
Figure 12
Figure 12
Entrainment strength depends on ctACS location. (a) Diagram of dorsal skull surface showing positions of AC electrodes relative to the recording site. Position one is adjacent to the recording site (Stim near), and position two is over the contralateral cerebellum (Stim far). (b) The distribution of r̄ ‘s for each position, with horizontal bars representing the mean.
Figure 13
Figure 13
Near and far ctACS electrode locations recruit different proportions of PC populations. (a) At 80 Hz, histograms of each CN cell’s entrainment in response to both ctACS locations: one is adjacent to the recording site (Stim near, black), and location two is on the contralateral skull surface (Stim far, green). Red circles filled with yellow show the latency of the CN minima from the peaks of the up or down PC populations (weighed mean vector, gray line). (b) The distribution of the latencies in response to both ctACS locations at 80 Hz. Gray horizontal lines represent two SD from the mean. (c) Histograms show the entrainment of near and far ctACS location for 80 Hz, n=8. The gray horizontal line is the average spontaneous firing rate at each ctACS location.

References

    1. Fertonani A, Ferrari C, Miniussi C. What do you feel if I apply transcranial electric stimulation? Safety, sensations and secondary induced effects. Clin Neurophysiol. 2015;126:2181–8. - PubMed
    1. Grimaldi G, Argyropoulos GP, Bastian A, Cortes M, Davis NJ, Edwards DJ, et al. Cerebellar Transcranial Direct Current Stimulation (ctDCS): A Novel Approach to Understanding Cerebellar Function in Health and Disease. Neuroscientist. 2016;22:83–97. - PMC - PubMed
    1. Grimaldi G, Argyropoulos GP, Boehringer A, Celnik P, Edwards MJ, Ferrucci R, et al. Non-invasive Cerebellar Stimulation—a Consensus Paper Cerebellum. 2014;13:121–38. - PubMed
    1. Priori A, Ciocca M, Parazzini M, Vergari M, Ferrucci R. Transcranial cerebellar direct current stimulation and transcutaneous spinal cord direct current stimulation as innovative tools for neuroscientists: Cerebellar and Spinal tDCS. J Physiol. 2014;592:3345–69. - PMC - PubMed
    1. Ferrucci R, Giannicola G, Rosa M, Fumagalli M, Boggio PS, Hallett M, et al. Cerebellum and processing of negative facial emotions: Cerebellar transcranial DC stimulation specifically enhances the emotional recognition of facial anger and sadness. Cognition Emot. 2012;26:786–99. - PMC - PubMed

Publication types

LinkOut - more resources