[Preprint]. 2024 Nov 14:rs.3.rs-5199635.
doi: 10.21203/rs.3.rs-5199635/v1.

Structural proteomics defines a sequential priming mechanism for the progesterone receptor

Affiliations

Structural proteomics defines a sequential priming mechanism for the progesterone receptor

Patrick Griffin et al. Res Sq. .

Update in

Abstract

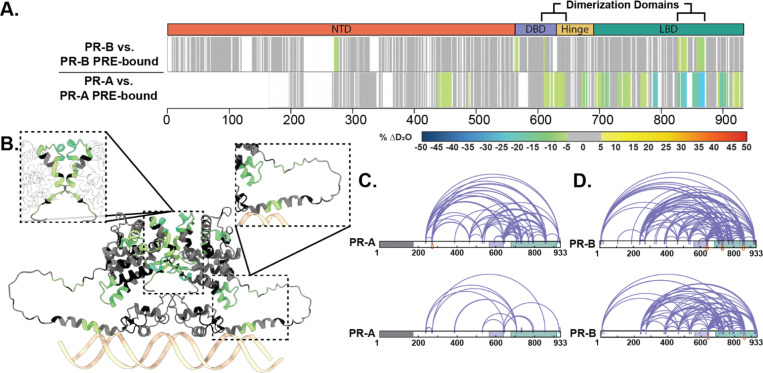
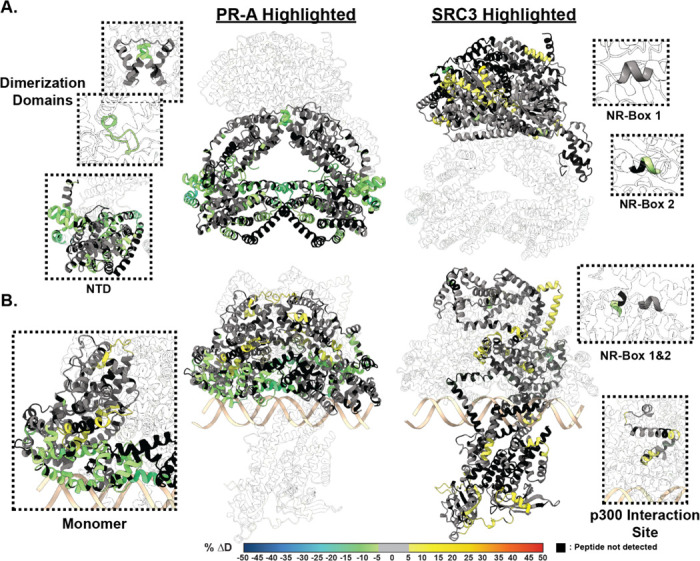
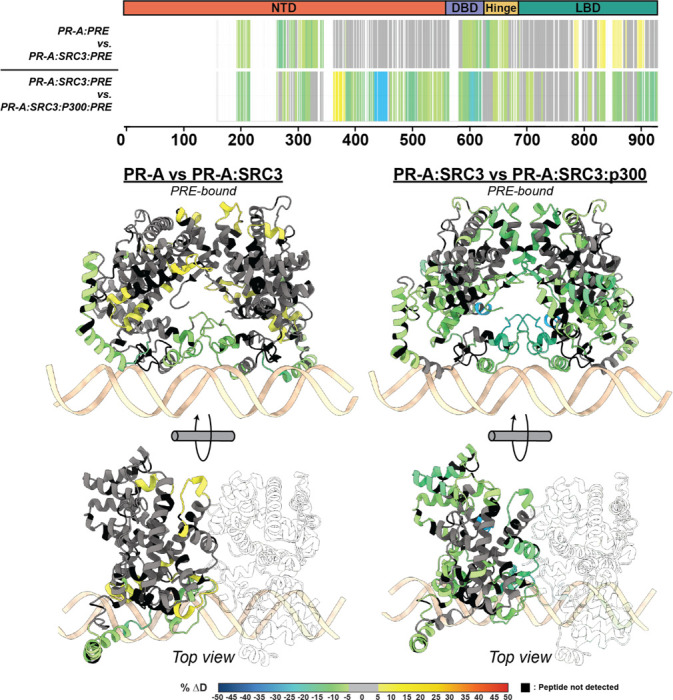
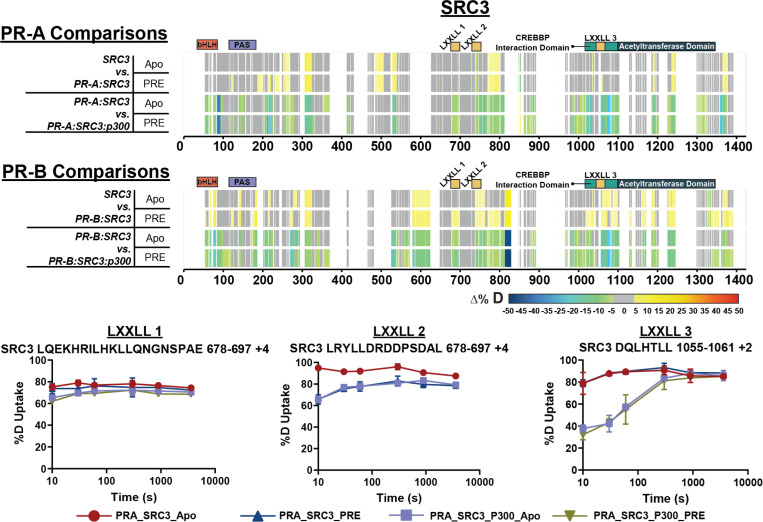
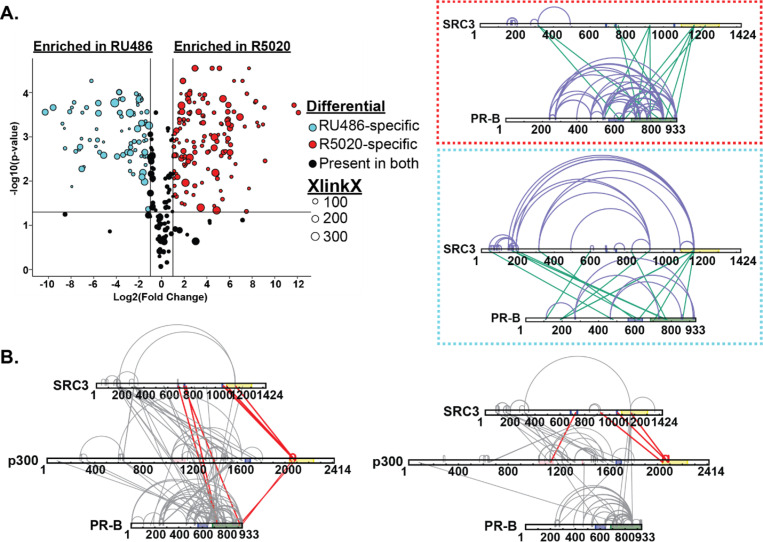
The progesterone receptor (PR) is a steroid-responsive nuclear receptor with two isoforms: PR-A and PR-B. Disruption of PR-A:PR-B signaling is associated with breast cancer through interactions with oncogenic co-regulatory proteins (CoRs). However, molecular details of isoform-specific PR-CoR interactions remain poorly understood. Using structural mass spectrometry, we investigate the sequential binding mechanism of purified full-length PR and intact CoRs, steroid receptor coactivator 3 (SRC3) and p300, as complexes on target DNA. Our findings reveal selective CoR NR-box binding by PR and unique interaction surfaces between PR and CoRs during complex assembly, providing a structural basis for CoR sequential binding on PR. Antagonist-bound PR showed persistent CoR interactions, challenging the classical model of nuclear receptor activation and repression. Collectively, we offer a peptide-level perspective on the organization of the PR transcriptional complex and infer the mechanisms behind the interactions of these proteins, both in active and inactive conformations.

Keywords: Progesterone receptor; crosslinking; hydrogen-deuterium exchange; mass spectrometry; nuclear receptors; protein-protein interactions; transcriptional co-regulatory proteins.


Conflict of interest statement

Additional Declarations: There is NO Competing Interest.

Figures

Figure 1
Figure 1. DNA induces assembly of PR-A and PR-B.
A-B. SEC-MALS chromatograms of agonist (R5020)- bound PR-A (A) and PR-B (B) with and without DNA. The molar mass of DNA and PR-A alone matches the monomeric molar mass (black line/dots across the peaks). DNA induces assembly of both PR-A and PR-B into a complex with 2:1 (protein:DNA) stoichiometry. The presence of DNA in the complexes were confirmed by deconvolution of the protein and DNA fractions in the peak (red and blue lines, respectively).
Figure 2
Figure 2. Structural proteomics reveals isoform differences upon response element binding.
A. Consolidated HDX-MS data, run in triplicate, showing the differential analysis between unbound PR vs. PRE-bound where the top is PR-B, and the bottom is PR-A. Domains are labeled as the following: N-terminal Domain (NTD), DNA-binding domain (DBD), Hinge region (Hinge), and Ligand binding domain (LBD). B. Trimmed AlphaFold 3.0 model (residues 375–769) of PR-A homodimer with unbound PR-A vs. PR-A:PRE HDX overlays. Highlighted regions are the PR dimerization domain (top) and the DBD C-terminal extension (bottom). Cooler colors indicate stronger HDX protection. C. XlinkX images of differential PR-A ± PRE experiments, where crosslinks from the unbound (top) and PRE-bound (bottom) states are shown. Crosslinks mapped onto PR-B numbering with the gray region representing the 164 amino acids not expressed in PR-A. Results representative of triplicate experiments, with validation in Skyline. D. XlinkX view of differential PR-B ± PRE experiments, where crosslinks from unbound (top) and PRE-bound (bottom) states are shown. Domains – Gray: Not expressed; Purple: DBD; Green: LBD.
Figure 3
Figure 3. SRC3 induces LBD changes to PR upon PRE addition.
A. Left HDX overlay (PR-A vs. PR-A:SRC3) mapped onto AlphaFold3.0 model of the PR-A:SRC3 ternary complex with the PR homodimer highlighted. Zoomed-in sections of PR corresponding to the dimerization domains (Amino acids: 720–769 and 438–454) and N-terminal domain (PR-A amino acids 1–476) highlighted with matching HDX overlays. Right. Differential HDX overlay of SRC3 vs. PR-A:SRC3 onto the best scoring PR:SRC3 apo complex with SRC3 highlighted. NR-Boxes 1 and 2 (amino acids 685–689 and 738–742, respectively) blown up to show differential exchange. B. Left HDX overlay (PR-A:PRE vs. PR-A:SRC3:PRE) mapped onto AlphFold3.0 model of PR-A:SRC3:PRE ternary complex with the PR homodimer highlighted. One PR-A monomer is shown as a zoomed-in section. Right. Differential HDX overlay of SRC3 vs. PR-A:SRC3:PRE onto the best scoring PR:SRC3 apo complex with SRC3 highlighted. NR-Boxes 1 and 2 and the p300 interaction site (amino acids 1023–1093) are highlighted to show differential exchange. Black peptide regions correspond to peptides not identified by HDX-MS. Each color represents the percent change in deuterium incorporation (Δ%D), following the scale shown at the bottom.
Figure 4
Figure 4. p300 differentially alters the conformational dynamics of PR-A and PR-B within the PR:SRC3:p300complex.
Top. Consolidated HDX plots of PR-B showing the differential HDX-MS comparisons within the plot to the left. Changes in deuterium uptake are represented by the rainbow plot shown at the bottom. Common PR domains are highlighted at the top: N-terminal domain (NTD, orange), DNA-binding domain (DBD, purple), Hinge (yellow), and ligand-binding domain (LBD, teal). Bottom AlphaFold3.0 models of PR from the AF1 to LBD (amino acids 456–933 using PR-B numbering). HDX-MS overlays represent the same experiments as the consolidated views on the top. Each color represents the percent change in deuterium incorporation (Δ%D), following the scale shown at the bottom. Gray overlays indicate no significant changes and black indicates peptides not detected in the HDX-MS experiment.
Figure 5
Figure 5. PR-A and PR-B differentially interact with SRC3 and are stabilized by p300 addition.
Top. Consolidated differential HDX-MS results for SRC3, comparing the changes induced by PR-A and p300 binding in the presence and absence of PRE DNA. Middle. Consolidated HDX-MS plot of SRC3 exchange, with PR-B comparisons in the same order as PR-A. The motifs highlighted are the following: bHLH (orange), PAS (purple), LXXLL motifs (yellow), CREBBP Interaction domain (teal), and acetyltransferase domain (dark blue). Each color represents the percent change in deuterium incorporation (Δ%D), following the scale shown at the bottom.Gray overlays indicate no significant changes and black indicates peptides not detected in the HDX-MS experiment. Bottom. Selected deuterium uptake plots for peptides that contain LXXLL motifs 1, 2, and 3. The %D uptake indicates the percent deuterium uptake over time for the PR-A:SRC3 ± DNA and PR-A:SRC3:p300 ± DNA HDX experiments.
Figure 6
Figure 6. XL-MS shows p300 directly interacts with PR.
A. Crosslinking results from PR-B:p300±PRE experiments. Purple: intraprotein crosslinks, green: interprotein crosslinks. PR highlighted domains: DBD (purple) and LBD (green). p300 highlighted domains: bromodomain (pink), zinc finger domain (green), and NCOA2-interaction domain (yellow).
Figure 7
Figure 7. RU486 antagonism rearranges PR-SRC3-p300 interactions.
Top. Plotted differential crosslinks in PR:SRC3 experiments, comparing R5020-specific (agonist, red) and RU-486-specific (antagonist, blue) crosslinks. Crosslinks represented by circles with corresponding XlinkX scores as point size. Top. Red. XlinkX view of R5020-specific crosslinks in differential PR:SRC3 experiments. Top. Red. XlinkX view of RU486-specific crosslinks in differential PR:SRC3 experiments. B. All validated R5020-bound (left) and RU486-bound (right) crosslinks for differential PR-B:SRC3:p300 ± PRE experiments. The x-axis represents the Log2 transformed fold change values from Skyline, while the y-axis represents the -log10 transformation of the Skyline p-value output. The lines are indicative of a Log2 fold change of 1 (two-fold increase) and -log10 p-value of 1.3, corresponding to p<0.05. Crosslinks highlighted in red show notable differences in PR:SRC3:p300 interactions between PR ligands. Defined domains are as follows: PR - DBD (purple) and LBD (green); SRC3 – NR-boxes (purple) and histone acetyltransferase domain (yellow); p300 - bromodomain (pink), zinc finger domain (green), and NCOA2-interaction domain (yellow).
Figure 8
Figure 8. RU486-bound PR has reduced deuterium exchange upon CoR binding.
A. PR models of AF1 to C-terminus (amino acids 456–933) with PR-A HDX overlays, corresponding to the comparisons shown beneath them. B. PR models of the AF1 to C-terminus with corresponding PR-B HDX overlays labeled beneath. Each color represents the percent change in deuterium incorporation (Δ%D), following the scale shown at the bottom. Gray overlays indicate no significant changes and black indicates peptides not detected in the HDX-MS experiment.

Similar articles

References

    1. Roemer SC, Donham DC, Sherman L, Pon VH, Edwards DP, Churchill ME. Structure of the progesterone receptor-deoxyribonucleic acid complex: novel interactions required for binding to half-site response elements. Mol Endocrinol. 2006;20(12):3042–52. doi: 10.1210/me.2005-0511. - DOI - PMC - PubMed
    1. Melvin VS, Harrell C, Adelman JS, Kraus WL, Churchill M, Edwards DP. The role of the C-terminal extension (CTE) of the estrogen receptor alpha and beta DNA binding domain in DNA binding and interaction with HMGB. J Biol Chem. 2004;279(15):14763–71. doi: 10.1074/jbc.M313335200. - DOI - PubMed
    1. Hill KK, Roemer SC, Churchill MEA, Edwards DP. Structural and functional analysis of domains of the progesterone receptor. Molecular and Cellular Endocrinology. 2012;348(2):418–29. doi: 10.1016/j.mce.2011.07.017. - DOI - PMC - PubMed
    1. Grimm SL, Hartig SM, Edwards DP. Progesterone Receptor Signaling Mechanisms. J Mol Biol. 2016;428(19):3831–49. doi: 10.1016/j.jmb.2016.06.020. - DOI - PubMed
    1. Simons SS, Edwards DP, Kumar R. Minireview: Dynamic Structures of Nuclear Hormone Receptors: New Promises and Challenges. Molecular Endocrinology. 2014;28(2):173–82. doi: 10.1210/me.2013-1334. - DOI - PMC - PubMed

Publication types

LinkOut - more resources