[Preprint]. 2024 Nov 18:rs.3.rs-5279795.
doi: 10.21203/rs.3.rs-5279795/v1.

Trends in hyperinsulinemia and insulin resistance among nondiabetic US adults, NHANES, 1999-2018

Affiliations

Trends in hyperinsulinemia and insulin resistance among nondiabetic US adults, NHANES, 1999-2018

Chuyue Wu et al. Res Sq. .

Update in

Abstract

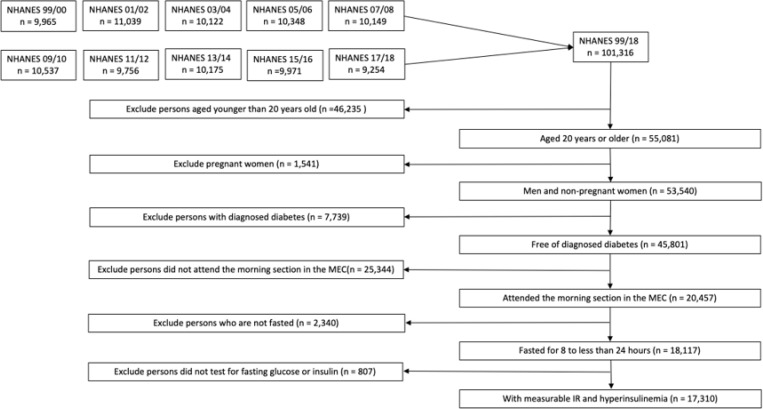
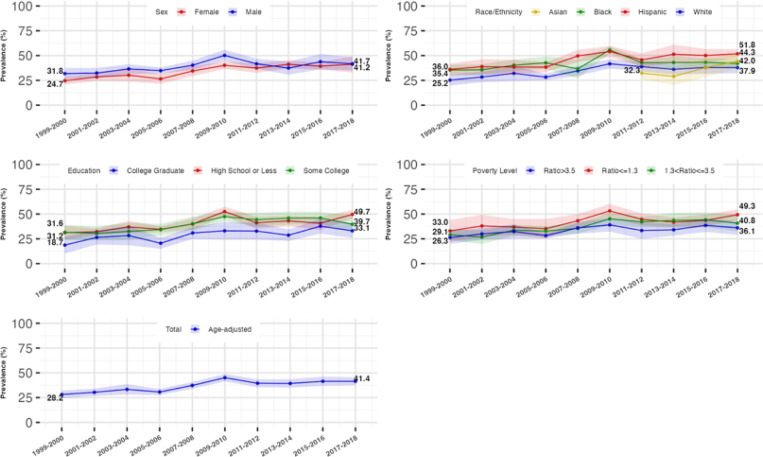
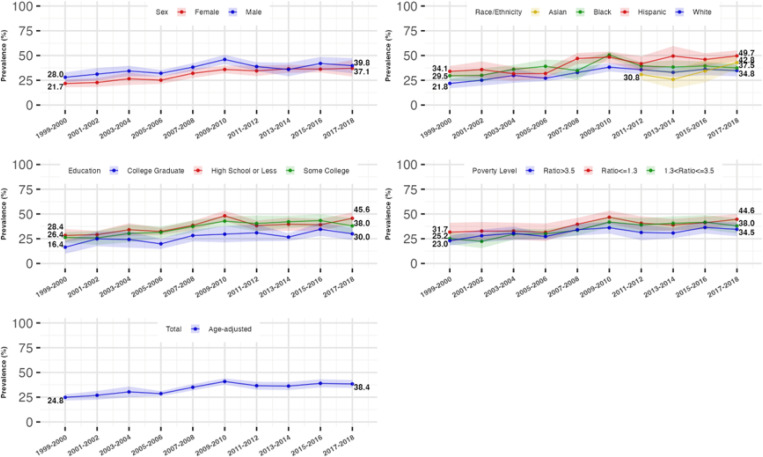
Hyperinsulinemia and insulin resistance (IR) are critical predictors of cardiometabolic diseases, disproportionately affecting various sociodemographic groups in the United States. This study aimed to estimate and analyze trends in the prevalence of hyperinsulinemia and IR among nondiabetic adults from 1999 to 2018, using data from the National Health and Nutrition Examination Survey (NHANES). The study included 17,310 nondiabetic men and nonpregnant women aged 20 years or older. Hyperinsulinemia was defined as fasting serum insulin levels ≥10 U/ml, while IR was measured using the HOMA-IR index (≥2.6, 66.7th percentile). The age-standardized prevalence of hyperinsulinemia increased from 28.2% in 1999-2000 to 41.4% in 2017-2018, while IR prevalence rose from 24.8% to 38.4% during the same period. Higher prevalence rates were consistently observed among males, non-Hispanic Blacks, Hispanics, and individuals with lower education or income levels. Trends indicated increases across all sociodemographic groups during at least some time periods. The findings suggest a growing prevalence of hyperinsulinemia and IR in the U.S., particularly among vulnerable populations, underscoring the importance of targeted public health interventions to address these disparities and reduce the risk of cardiometabolic diseases.

Keywords: Hyperinsulinemia; Insulin resistance; Metabolic disorders; NHANES; Sociodemographic disparities; Temporal trend.


Conflict of interest statement

Declarations Conflict of interest The authors declare no conflicts of interest. Additional Declarations: No competing interests reported.

Figures

Figure 1
Figure 1. Study Population Flow Diagram
Flowchart illustrating the inclusion and exclusion criteria applied to the NHANES 1999–2018 dataset, resulting in a final sample of 17,310 adult participants as the study population of interest. Abbreviations: NHANES, National Health and Nutrition Examination Survey; MEC, Mobile Examination Center.
Figure 2
Figure 2. Age-standardized Prevalence and 95% Confidence Interval of Hyperinsulinemia Stratified by Sex, Race/Ethnicity, Educational and Income level, NationalHealth and Nutrition Examination Survey (NHANES), 1999 to 2018
Showing the trends in the age-standardized prevalence of hyperinsulinemia and the disparities across sociodemographic groups. Hyperinsulinemia was defined as the fasting insulin levels greater than 10 μU/ml. The prevalence of hyperinsulinemia and the corresponding 95% confidence interval were survey sample weighted and age-standardized to 2010 U.S. Census adult population. The sample size for the total, sex-stratified, and race/ethnicity (without Asian)-stratified trends was 17,310. The sample size for the stratified non-Hispanic Asian subgroup was 7,066. 19 participants were excluded from the education-stratified trend analyses. 1538 participants were excluded from the income-stratified trend analyses.
Figure 3
Figure 3. Age-standardized Prevalence and 95% Confidence Interval of Insulin Resistance Stratified by Sex, Race/Ethnicity, Educational and Income level, NationalHealth and Nutrition Examination Survey (NHANES), 1999 to 2018
Showing the trends in the age-standardized prevalence of insulin resistance and the disparities across sociodemographic groups. Insulin resistance was defined as the Homeostatic Model Assessment of Insulin Resistance (HOMA-IR) index greater than 2.6 (the 66.7th percentile). The prevalence of insulin resistance and the corresponding 95% confidence interval were survey sample weighted and age-standardized to 2010 U.S. Census adult population. The sample size for the total, sex-stratified, and race/ethnicity (without Asian)-stratified trends was 17,310. The sample size for the stratified non-Hispanic Asian subgroup was 7,066. 19 participants were excluded from the education-stratified trend analyses. 1538 participants were excluded from the income-stratified trend analyses.

Similar articles

References

    1. Petersen MC, Shulman GI. Mechanisms of Insulin Action and Insulin Resistance. Physiol Rev. 2018;98:2133–2223. doi:10.1152/physrev - DOI - PMC - PubMed
    1. Shanik MH, Xu Y, Skrha J, Dankner R, Zick Y, Roth J. Insulin resistance and hyperinsulinemia: is hyperinsulinemia the cart or the horse? Diabetes Care. 2008;31 Suppl 2:S262–8. doi:10.2337/dc08-s264 - DOI - PubMed
    1. Corkey BE. Banting lecture 2011: Hyperinsulinemia: Cause or consequence? Diabetes. 2012;61(1):4–13. doi:10.2337/db11-1483 - DOI - PMC - PubMed
    1. Nolan CJ, Prentki M. Insulin resistance and insulin hypersecretion in the metabolic syndrome and type 2 diabetes: Time for a conceptual framework shift. Diab Vasc Dis Res. 2019;16(2):118–127. doi:10.1177/1479164119827611 - DOI - PubMed
    1. Nolan CJ, Ruderman NB, Kahn SE, Pedersen O, Prentki M. Insulin resistance as a physiological defense against metabolic stress: Implications for the management of subsets of type 2 diabetes. Diabetes. 2015;64(3):673–686. doi:10.2337/db14-0694 - DOI - PMC - PubMed

Publication types

LinkOut - more resources