

What is beautiful is still good: the attractiveness halo effect in the era of beauty filters
- PMID: 39606589
- PMCID: PMC11597472
- DOI: 10.1098/rsos.240882
What is beautiful is still good: the attractiveness halo effect in the era of beauty filters
Abstract
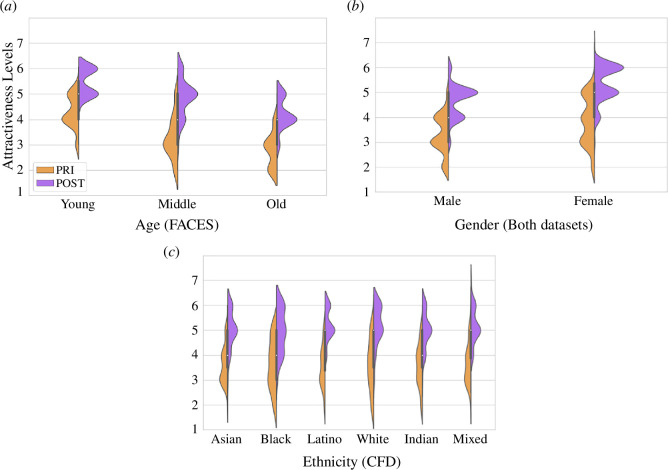
The impact of cognitive biases on decision-making in the digital world remains under-explored despite its well-documented effects in physical contexts. This paper addresses this gap by investigating the attractiveness halo effect using AI-based beauty filters. We conduct a large-scale online user study involving 2748 participants who rated facial images from a diverse set of 462 distinct individuals in two conditions: original and attractive after applying a beauty filter. Our study reveals that the same individuals receive statistically significantly higher ratings of attractiveness and other traits, such as intelligence and trustworthiness, in the attractive condition. We also study the impact of age, gender and ethnicity and identify a weakening of the halo effect in the beautified condition, resolving conflicting findings from the literature and suggesting that filters could mitigate this cognitive bias. Finally, our findings raise ethical concerns regarding the use of beauty filters.
Keywords: artificial intelligence; attractiveness halo effect; beauty filters; cognitive biases; gender stereotypes.
© 2024 The Author(s).
Conflict of interest statement
We declare we have no competing interests.
Figures
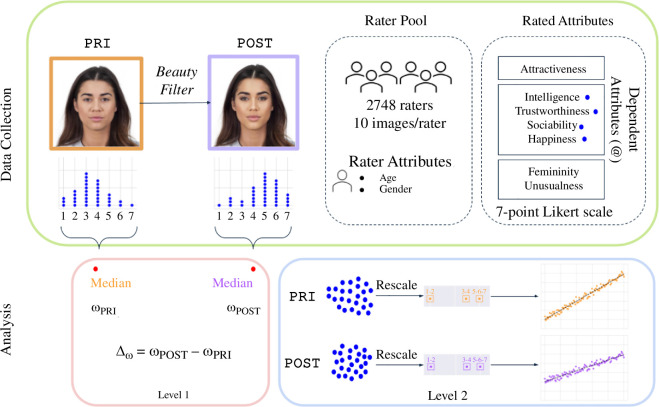
 ); and (ii) an individual level (
 )—depicted inside the blue box in the figure—consisting of each rating and considering the participants’ characteristics.
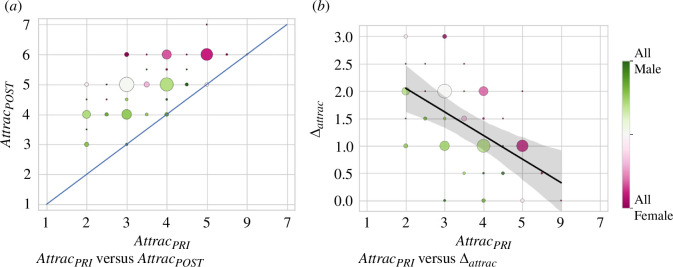
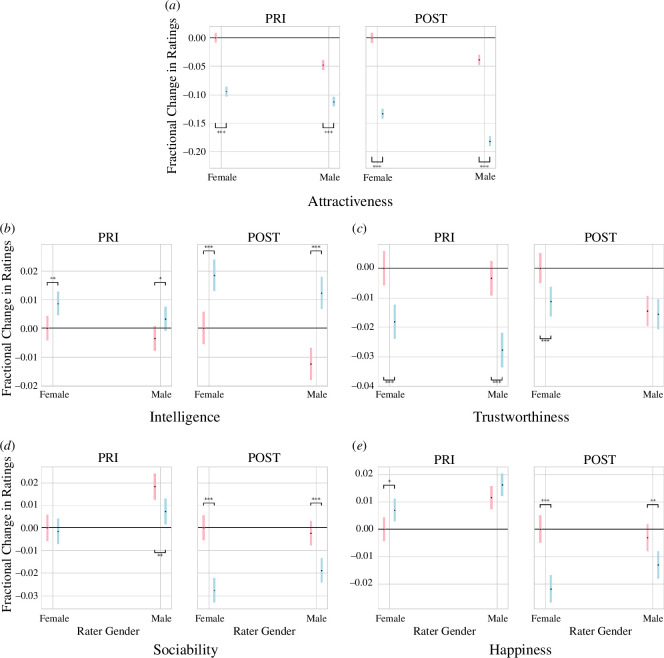
 ] for images of females and blue [
 ] for images of males). The length of the bars corresponds to the 95% confidence interval of the estimated marginal mean (EMM) [70,71]. The y-axis depicts the relative change in the EMM from the EMM of female stimuli rated by female participants. Details on how these values were computed can be found in appendix N.
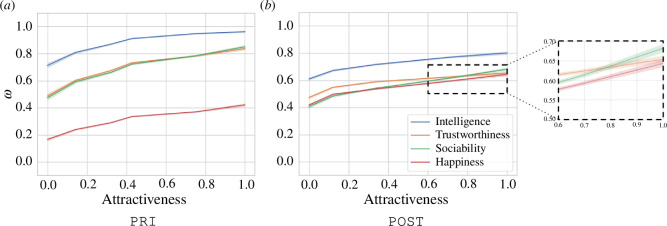
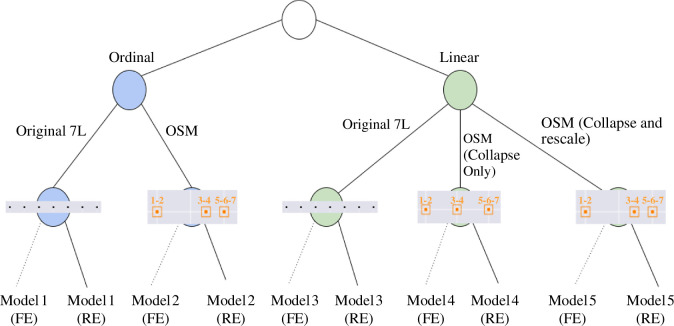
 ) and
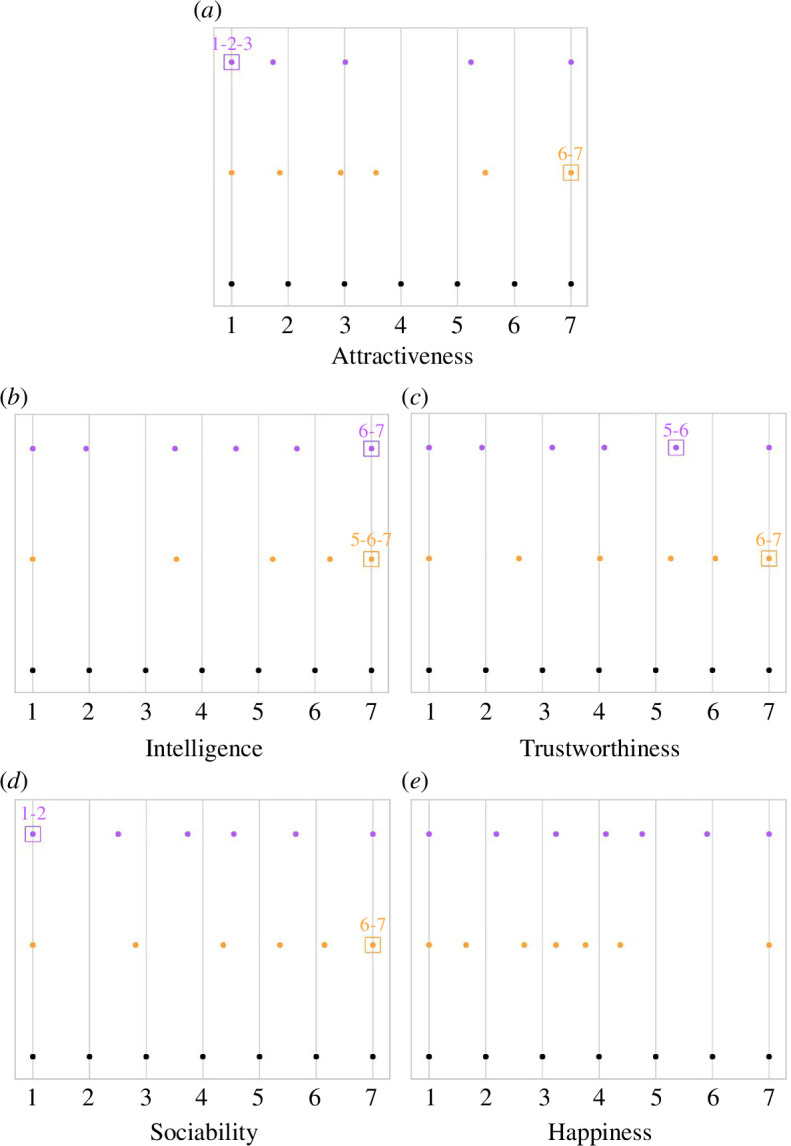
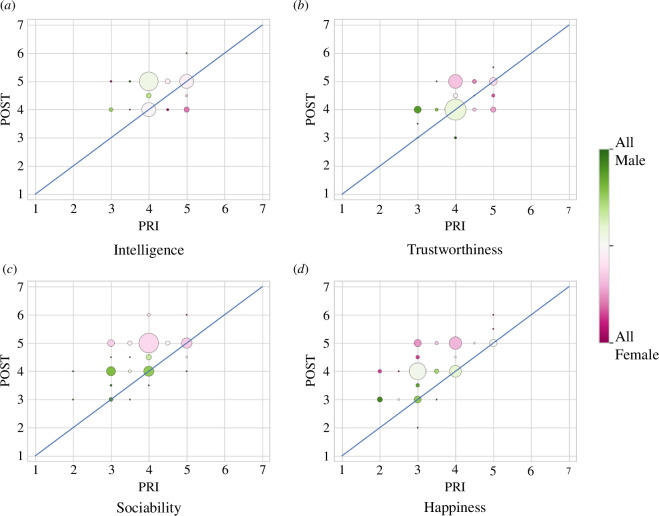
) and  ) sets, respectively. The squares around the dots indicate locations where multiple points on the scale were collapsed to the same value.
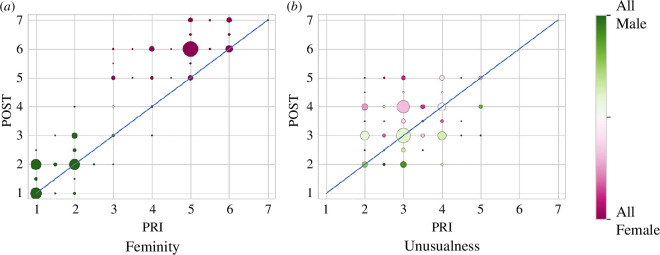

References
LinkOut - more resources
Full Text Sources
Miscellaneous