. 2024 Nov;12(11):e70082.
doi: 10.1002/iid3.70082.

Downregulation of Notch Signaling-Stimulated Genes in Neurovascular Unit Alterations Induced by Chronic Cerebral Hypoperfusion

Affiliations

Downregulation of Notch Signaling-Stimulated Genes in Neurovascular Unit Alterations Induced by Chronic Cerebral Hypoperfusion

Dewen Ru et al. Immun Inflamm Dis. 2024 Nov.

Abstract

Background: Chronic cerebral hypoperfusion (CCH) is a key contributor to vascular cognitive impairment (VCI) and is typically associated with blood-brain barrier (BBB) damage. This study investigates the pathological mechanisms underlying CCH-induced neurovascular unit (NVU) alterations.

Methods: A mouse model of CCH was established using the bilateral common carotid artery stenosis (BCAS) procedure. Decreased cerebral blood flow (CBF) and impaired BBB integrity were assessed. Brain microvessel (BMV)-specific transcriptome profiles were analyzed using RNA-seq, supplemented with published single-cell RNA-seq data.

Results: RNA-seq revealed neuroinflammation-related gene activation and significant downregulation of Notch signaling pathway genes in BMVs post-BCAS. Upregulated differentially expressed genes (DEGs) were enriched in microglia/macrophages, while downregulated DEGs were prominent in endothelial cells and pericytes. Enhanced activation of vascular-associated microglia (VAM) was linked to neurovascular alterations.

Conclusion: CCH induces significant NVU changes, marked by microglia-associated neuroinflammation and Notch signaling downregulation. These insights highlight potential therapeutic targets for treating neuroinflammatory and vascular-related neurodegenerative diseases.

Keywords: Notch signaling pathway; brain microvessel; chronic cerebral hypoperfusion; microglial; neuroinflammation.


Conflict of interest statement

The authors declare no conflicts of interest.

Figures

Figure 1
Figure 1
Effects of chronic cerebral hypoperfusion on cerebral blood flow and histopathology. (A) The schematic diagram of the experimental protocol. BCAS, bilateral carotid artery stenosis. CBF, cerebral blood flow. CCH, chronic cerebral hypoperfusion. HE staining, hematoxylin and eosin staining. IF, Immunofluorescence staining. (B) Representative images showing CBF at 3 weeks post‐BCAS or sham surgery. (C) Quantitative analysis of CBF across the whole brain in both sham and BCAS groups. (D) Quantitative analysis of CBF in the right hemisphere in sham and BCAS groups. N = 7 mice per group. (E) Coronal brain sections stained with HE to reveal brain injury induced by BCAS. (F) Representative HE‐stained images of the cerebral cortex under high magnification. Data are expressed as mean ± SEM. Statistical significance was determined using an unpaired t‐test (two‐tailed). ***p < 0.001 compared to the sham group.
Figure 2
Figure 2
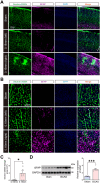
Activated astrocyte and the disruption of blood‐brain barrier integrity induced by BCAS‐hypoperfusion. (A) Representative double‐labeling staining images of GFAP and FITC‐dextran in brain sections at 3 weeks post‐BCAS. (B) Microscopic images of perfused cortical capillaries with intravenously injected FITC‐dextran and immunofluorescence staining of GFAP in the cortical region. (C) Assessment of blood‐brain barrier permeability by FITC‐dextran leakage. Data are expressed as mean ± SEM. Paired t‐test (two‐tailed), *p < 0.05 versus 0.18 mm side, n = 8 per group. (D) Representative western blot images of GFAP in the cerebral cortex are shown on the left, and the statistical analysis of relative GFAP expression level is on the right. Unpaired t‐test. N = 5 per group. Data are expressed as mean ± SEM. Unpaired t‐test (two‐tailed), ***p < 0.001 versus sham, n = 5 mice per group.
Figure 3
Figure 3
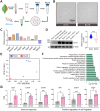
Successful isolation of BMV from the right cerebral cortex and BMV‐specific transcriptome profiling 3 weeks post BCAS‐hypoperfusion. (A) Schematic diagram of BMVs isolation. BMV, brain microvessels. (B) Representative light microscopy images show freshly isolated BMVs from the cerebral cortex of both sham‐operated and BCAS‐treated mice. (C) RT‐qPCR analysis revealed the relative transcriptional expression levels of various genes in brain homogenate (Homogenate) compared to microvascular separation products (Microvessel). The relative expression was calculated using the formula: Relative Expression = Microvessel/Homogenate. (D) Western blot analysis presented representative images of CD31, an endothelial marker, in the cerebral cortex, with the statistical analysis of relative CD31 expression levels showing significant differences. 40 μm means the specific size threshold used to filter microvessel fractions. N = 6 per group. Unpaired t‐test (two‐tailed), ***p < 0.001 versus sham. (E) Principal component analysis (PCA) of RNA‐seq datasets from brain cortical microvessels highlighted distinct clustering between sham and BCAS groups. (F) Gene ontology (GO) analysis provided functional annotations of all differentially expressed genes between BCAS and sham groups (BCAS vs. Sham). (G) Bar charts depicted the gene expression profiles in Transcripts Per Million (TPM), noting significant increases in immune response and cell migration‐related genes (Ccl3, Cxcr4, Cxcr4, Aif1, C3ar1, Csf1r) in the BCAS group compared to the sham group. Data are expressed as mean ± SEM, with significance determined by unpaired t‐test (two‐tailed), *p < 0.05, **p < 0.01 versus sham, n = 3 per group.
Figure 4
Figure 4
Gene expression changes and gene ontology (GO) enrichment analysis of up‐ and downregulated DEGs after BCAS‐hypoperfusion 3 weeks. (A) Volcano plot illustrating the differentially expressed genes (DEGs) in brain microvessels (BMVs) between the BCAS and sham groups. The log2FC cutoff is set at 1, and the adjusted P‐value cutoff is 0.05. Each dot represents an expressed gene, with upregulated genes highlighted in red and downregulated genes in blue. (B) Heatmap displaying the correlation between samples, demonstrating the relationship and clustering of gene expression profiles among the different samples. (C) Bar plot showing the enriched Gene Ontology (GO) biological process terms for upregulated genes, indicating significant involvement in processes such as immune response and cell migration. (D) Bar plot depicting the enriched GO biological process terms for downregulated genes, highlighting significant pathways such as the Notch signaling pathway. (E) Validation of several upregulated and downregulated genes through quantitative real‐time PCR (gene expression was normalized by the housekeeping gene Gapdh). The upregulated genes are associated with “Positive regulation of phagocytosis” and “Interferon response” (Trem2, Aif1, Ifi209, Ifi211, Ccr7, Fcgr1), while the downregulated genes are involved in the “Notch signaling pathway” (S1pr3, Cdh6, Grip2, Perp, Pln, Tcim). Data are presented as mean ± SEM, with significance determined by unpaired t‐test (two‐tailed, **p < 0.01, ***p < 0.001), N = 6 mice per group.
Figure 5
Figure 5
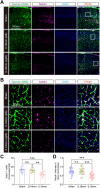
Notch signaling mediates the decrease of gene expression in BCAS‐induced hypoperfusion. (A) Representative immunofluorescent staining images of Notch1 in brain sections 3 weeks post sham and BCAS operation, with 2000‐kDa FITC‐dextran (green) injection. (B) High‐resolution microscopic images showing the co‐localization of FITC‐dextran and Notch1 in the cortical region. (C) Quantification of Notch1‐positive cells per field. (D) Quantitative analysis of Notch1 intensity in selected brain microvessels. Data are expressed as mean ± SEM. Statistical significance was determined using a one‐way ANOVA test, with NS indicating not significant, **p < 0.01, and ***p < 0.001.
Figure 6
Figure 6
Enrichment of cerebral hypoperfusion‐induced BMV‐specific DEGs in distinct brain cell types. (A) Schematic representation of the integrative analysis combining bulk RNA‐seq data from the current study with previously published single‐cell RNA‐seq data. (B) UMAP plot illustrating the clustering of single cells, colored by cell type, based on published single‐cell RNA‐seq data (GSE133283). (C‐D) Density scatterplots displaying cell‐type enrichment for (C) upregulated genes (“Up_genes”) and (D) downregulated genes (“Down_genes”) using the UCell R package (https://github.com/chuiqin/irGSEA). The genes visualized are DEGs identified from BMV‐specific bulk RNA‐seq in this study. Note the enrichment of upregulated genes in the “MG” and “PVM” clusters, and downregulated genes in the “Mural” and “EC” clusters. PVM, perivascular macrophage. MG, microglia. EC, endothelial cell. Fibro, fibroblasts. Mural, brain pericyte. AST, astrocyte. (E) Immunofluorescence Iba1 antibody staining (microglial marker) was performed on FITC‐Dextran‐labeled brain slices. The cell types enriched by upregulated DEGs were verified.
Figure 7
Figure 7
BCAS‐hypoperfusion leads to significant activation of vascular‐associated microglia 3 weeks post‐BCAS. (A,B) Representative images illustrating blood‐brain barrier (BBB) disruption and vessel‐associated microglia (VAM) location in the cerebral cortex at three weeks post BCAS‐hypoperfusion. The arrowheads indicate microglia located adjacent to vessels, highlighting their potential interactions with the vascular structures. (C) Quantification of the number of Iba1‐positive microglia per field. (D) T Percentage of VAM among total Iba1‐positive microglia in each microscope field of view. Data are presented as mean ± SEM. Statistical significance was determined using a one‐way ANOVA test, with NS indicating not significant, **p < 0.01, ***p < 0.001.

References

    1. Poh L., Sim W. L., Jo D.‐G., et al., “The Role of Inflammasomes in Vascular Cognitive Impairment,” Molecular Neurodegeneration 17, no. 1 (2022): 4, 10.1186/s13024-021-00506-8. - DOI - PMC - PubMed
    1. Xu W., Bai Q., Dong Q., Guo M., and Cui M., “Blood‐Brain Barrier Dysfunction and the Potential Mechanisms in Chronic Cerebral Hypoperfusion Induced Cognitive Impairment,” Frontiers in Cellular Neuroscience 16 (2022): 870674, 10.3389/fncel.2022.870674. - DOI - PMC - PubMed
    1. Sweeney M. D., Zhao Z., Montagne A., Nelson A. R., and Zlokovic B. V., “Blood‐Brain Barrier: From Physiology to Disease and Back,” Physiological Reviews 99, no. 1 (2019): 21–78, 10.1152/physrev.00050.2017. - DOI - PMC - PubMed
    1. Gallart‐Palau X., Serra A., Hase Y., et al., “Brain‐Derived and Circulating Vesicle Profiles Indicate Neurovascular Unit Dysfunction in Early Alzheimer's Disease,” Brain Pathology 29, no. 5 (2019): 593–605, 10.1111/bpa.12699. - DOI - PMC - PubMed
    1. Rajeev V., Fann D. Y., Dinh Q. N., et al., “Intermittent Fasting Attenuates Hallmark Vascular and Neuronal Pathologies in a Mouse Model of Vascular Cognitive Impairment,” International Journal of Biological Sciences 18, no. 16 (2022): 6052–6067, 10.7150/ijbs.75188. - DOI - PMC - PubMed

Publication types

Substances