. 2024 Nov 28;81(1):467.
doi: 10.1007/s00018-024-05504-9.

CLIP170 enhancing FOSL1 expression via attenuating ubiquitin-mediated degradation of β-catenin drives renal cell carcinoma progression

Affiliations

CLIP170 enhancing FOSL1 expression via attenuating ubiquitin-mediated degradation of β-catenin drives renal cell carcinoma progression

Yuanbin Huang et al. Cell Mol Life Sci. .

Abstract

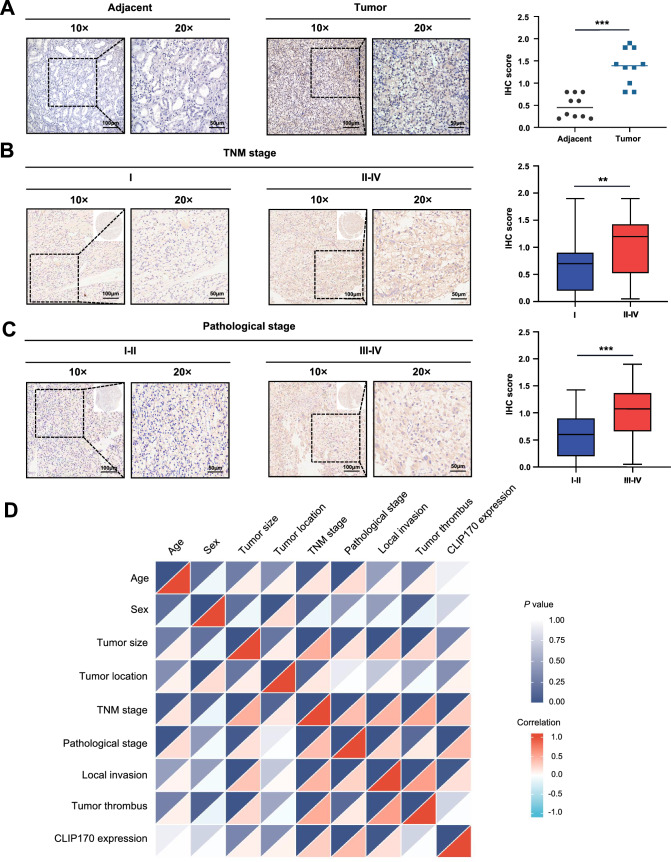
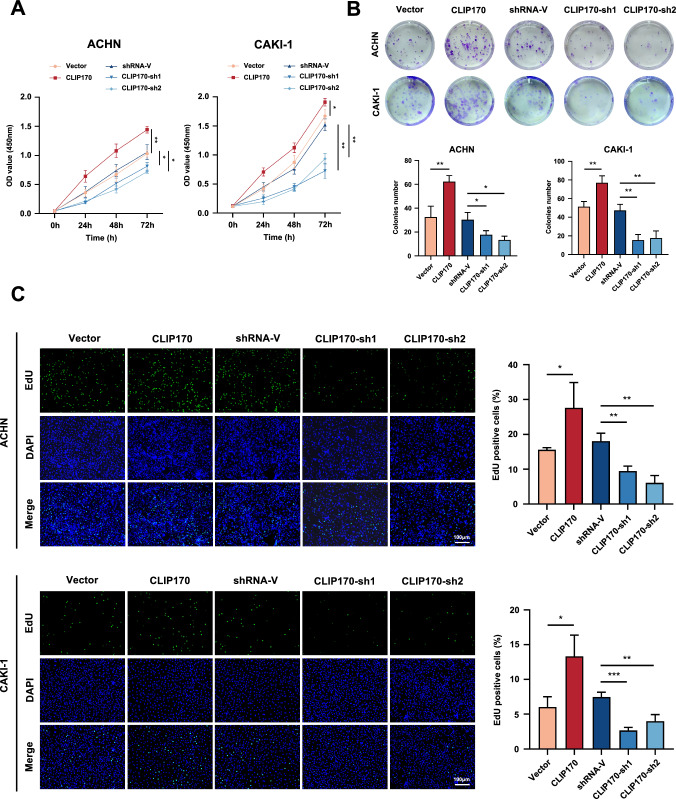
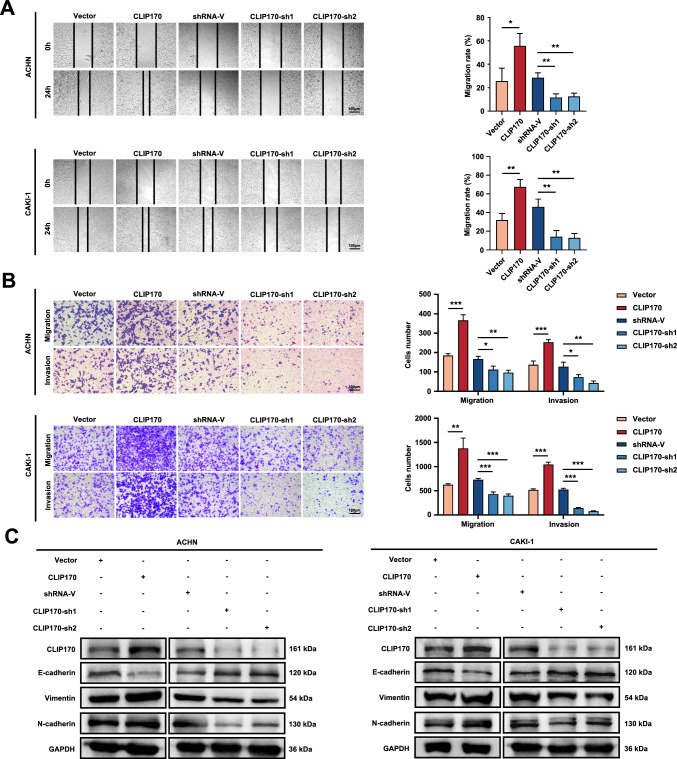
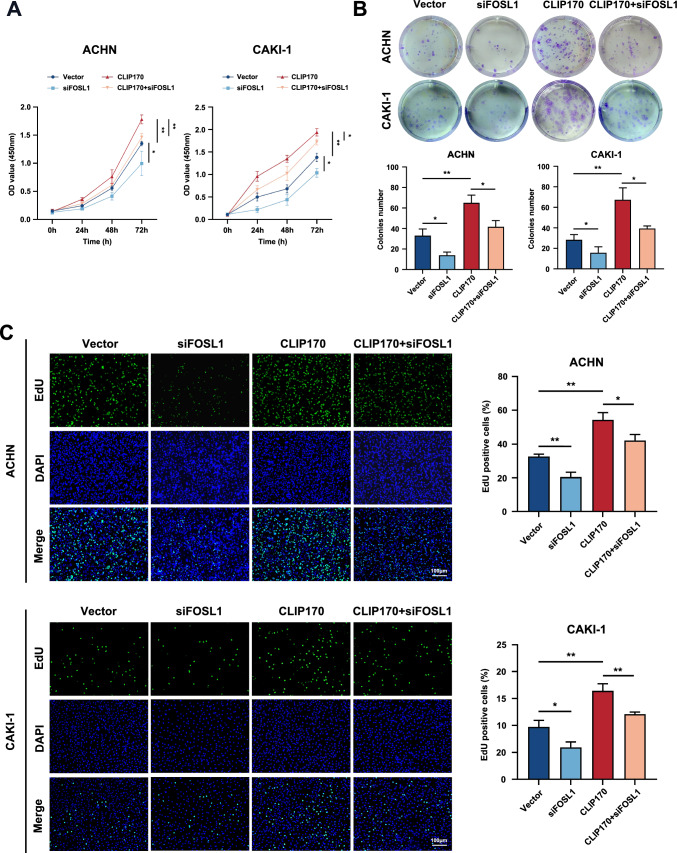
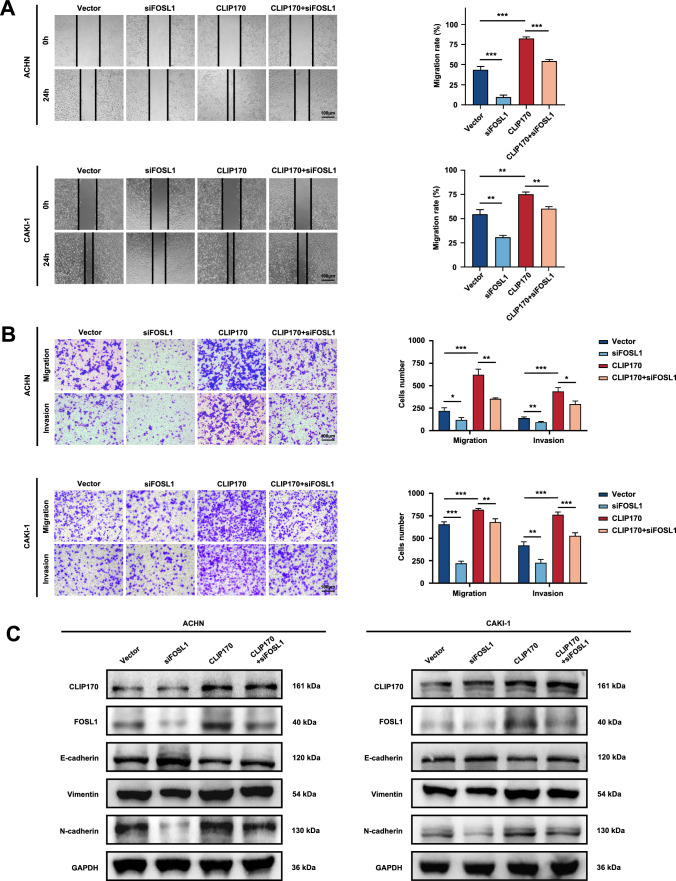
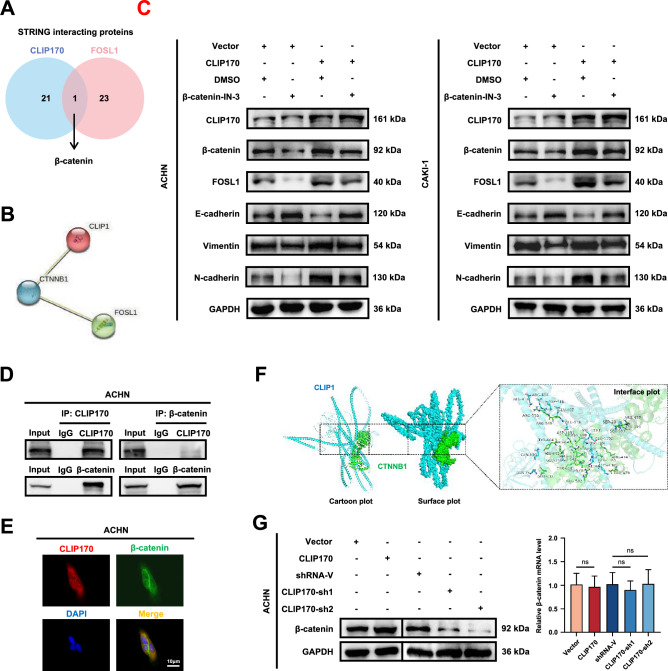
Protein interactions are fundamental for all cellular metabolic activities. Cytoplasmic linker protein 170 (CLIP170) plays diverse roles in cellular processes and the development of malignant tumors. Renal cell carcinoma (RCC) poses a significant challenge in oncology owing to its invasive nature, metastatic potential, high recurrence rates, and poor prognosis. However, the specific mechanisms and roles of CLIP170 underlying its involvement in RCC progression remain unclear. The findings of this study revealed a significant upregulation of CLIP170 in RCC tumor tissues. Elevated CLIP170 expression correlated positively with advanced clinical and pathological stages and was associated with poor overall survival in RCC patients. Functional assays in vitro demonstrated that elevated CLIP170 levels enhanced RCC cell proliferation, migration and invasion. Mechanistically, 4D-label free proteomics library identified that CLIP170 increased the level of FOSL1 in the Wnt signaling pathway. Immunoprecipitation and molecular docking were performed to unveil that CLIP170 formed a complex with β-catenin, inhibiting β-catenin degradation via the ubiquitin-proteasome pathway. Elevated β-catenin levels within RCC cells played a central role in promoting the transcriptional expression of FOSL1, thereby facilitating RCC cell proliferation and epithelial-mesenchymal transition (EMT) progression. In vivo investigations corroborated these findings, illustrating that CLIP170 regulated β-catenin and FOSL1 expression, driving tumor growth in RCC. This study highlights the crucial role of CLIP170 in promoting FOSL1 expression by preventing β-catenin ubiquitination and degradation, thus promoting RCC tumor progression. It suggests the CLIP170/β-catenin/FOSL1 axis as a potential therapeutic target for RCC treatment.

Keywords: CLIP170; Epithelial-mesenchymal transition (EMT); FOSL1; Renal cell carcinoma; Ubiquitin–proteasome pathway; β-catenin.


Conflict of interest statement

Declarations. Conflict of interests: The authors declare that they have no known competing financial interests or personal relationships that could have appeared to influence the work reported in this paper. Ethical approval: All procedures were conducted in accordance with the Declaration of Helsinki and approved by the ethics committee of the Second Affiliated Hospital of Dalian Medical University (Approval No. DYEY-2023-184). Written informed consent was obtained from all patients. All animal experimentation was approved prior to implementation, and all procedures were performed rigorously in accordance with the requirements of the Animal Experimental Ethical Committee of Dalian Medical University Laboratory Animal Center (Approval No. AEE23056).

Figures

Fig. 1
Fig. 1
CLIP170 is significantly upregulated in RCC and correlated with TNM and pathological stage and prognosis. A The IHC scoring distribution of CLIP170 expression in tumor (n = 10) and paired adjacent normal (n = 10) tissues. B, C IHC analysis of the CLIP170 expression in 145 RCC tissues with respect to TNM and pathological stages, stratified by TNM stages (B) and pathological stages (C). The bar graphs represent the average IHC scores for each stage group. D Heatmap of correlation analysis between clinical and pathological features and CLIP170 expression in 145 RCC patients. Clinical parameters such as TNM stage, tumor size, and metastasis were correlated with CLIP170 expression levels using Spearman’s rank correlation. The significance of the correlations is depicted using a blue-to-black color scale: darker shades indicate stronger statistical significance (i.e., lower P-values). Hierarchical clustering was applied to group similar clinical features and expression profiles, providing a visual summary of the relationship between CLIP170 and key clinical characteristics. For tissue staining, the scale bars represent 100 μm for panels A-C and 50 μm for zoomed-in sections. Data are mean ± SD; statistical significance was assessed by two-tailed Student's t-test; **P < 0.01, ***P < 0.001
Fig. 2
Fig. 2
The roles of CLIP170 in RCC cell proliferation. A Cell viability assessment using CCK-8 assay in ACHN and CAKI-1 cells with CLIP170 overexpression, CLIP170 downregulation, and corresponding negative controls. B Colony formation assay was conducted to evaluate the long-term proliferative capacity of RCC cells (ACHN and CAKI-1) following CLIP170 overexpression or knockdown. The colonies number reflects the ability of RCC cells to proliferate and form colonies after modulation of CLIP170 expression. C EdU assay was used to directly measure DNA synthesis and cell proliferation in ACHN and CAKI-1 cells. The percentage of EdU-positive cells was calculated, representing the proportion of cells actively undergoing DNA replication. All results were shown with one representative image from three independent experiments. Data are mean ± SD; statistical significance was assessed by two-tailed Student's t-test; *P < 0.05, **P < 0.01, ***P < 0.001
Fig. 3
Fig. 3
CLIP170 drives RCC cell migration, invasion and EMT process. A Representative images and corresponding quantification of wound healing assays conducted on ACHN and CAKI-1 cells subjected to modulation of CLIP170 expression, including downregulation and overexpression. Cells were allowed to migrate into the wound area for 24 h, and images were captured. The wound closure area was quantified. Scale bar = 100 μm. B Representative images and quantification of Transwell migration and Matrigel invasion assays performed on ACHN and CAKI-1 cells following CLIP170 downregulation and overexpression. Migrating and invading cells were stained, counted, and quantified. Scale bar = 100 μm. C Western blotting assays were employed to evaluate the impact of CLIP170 overexpression and knockdown on the expression of EMT markers (E-cadherin, Vimentin, N-cadherin). All results were shown with one representative image from three independent experiments. Data are mean ± SD; statistical significance was assessed by two-tailed Student's t-test; *P < 0.05, **P < 0.01, ***P < 0.001
Fig. 4
Fig. 4
CLIP170 enhances the FOSL1 expression in the Wnt signaling pathway. A Heatmap showing the distribution of differentially expressed proteins between normal control and CLIP170 knockdown ACHN cells (n = 3 per group). In the heatmap, red represents up-regulated proteins, while blue represents down-regulated proteins. The intensity of colors corresponds to the magnitude of differences. B A volcano plot depicts the distribution of differentially expressed proteins, with red dots indicating up-regulated proteins and green dots representing down-regulated ones. C Gene set enrichment analysis highlights the involvement of the Wnt signaling pathway. D A Venn plot demonstrates the overlap between significant differentially expressed proteins and the proteins associated with the Wnt signaling pathway. E Western blot and RT-qPCR analyses reveal the modulation of FOSL1 mRNA and protein levels following CLIP170 knockdown and overexpression in ACHN and CAKI-1 cell lines, and the results were shown with one representative image from three independent experiments. Data are mean ± SD; statistical significance was assessed by two-tailed Student's t-test; **P < 0.01, ***P < 0.001
Fig. 5
Fig. 5
FOSL1 knockdown reverses the effects of CLIP170 on RCC cell proliferation. A CCK-8 assays illustrate cell viability in ACHN and CAKI-1 cells treated with CLIP170-overexpressing lentivirus and FOSL1 small interfering RNA. The B colony formation and C EdU incorporation assays illustrate the proliferative capacity of ACHN and CAKI-1 cells following treatment with CLIP170-overexpressing lentivirus and FOSL1 siRNA. All results were shown with one representative image from three independent experiments. Scale bar = 100 μm. Data are mean ± SD; statistical significance was assessed by two-tailed Student's t-test; *P < 0.05, **P < 0.01
Fig. 6
Fig. 6
FOSL1 knockdown reverses the effects of CLIP170 on RCC cell migration and invasion. A A wound healing assay assesses the migration capacity of ACHN and CAKI-1 cells treated with CLIP170-overexpressing lentivirus and FOSL1 siRNA. Scale bar = 100 μm. B Transwell assays demonstrate the migration and Matrigel invasion capacities of ACHN and CAKI-1 cells following treatment with CLIP170-overexpressing lentivirus and FOSL1 siRNA. Scale bar = 100 μm. C Western blot assays reveal changes in the expression of EMT-related proteins (E-cadherin, Vimentin, N-cadherin) in ACHN and CAKI-1 cells upon treatment with CLIP170-overexpressing lentivirus and FOSL1 siRNA. All results were shown with one representative image from three independent experiments. Data are mean ± SD; statistical significance was assessed by two-tailed Student's t-test; *P < 0.05, **P < 0.01, ***P < 0.001
Fig. 7
Fig. 7
CLIP170 interacts with β-catenin and regulates FOSL1 expression. A Schematic illustration showing the screening the overlapping interacting proteins for CLIP170 (encoded by CLIP1) and β-catenin (encoded by CTNNB1) using STRING database. B The relationship among CLIP170, β-catenin, and FOSL1 in STRING database. Blank lines represent co-expression, while yellow lines represent text-mined interactions. C Western blot assays were conducted to detect FOSL1 expression and EMT markers (E-cadherin, Vimentin, N-cadherin) in ACHN and CAKI-1 cells treated with CLIP170-overexpressing lentivirus and a selective β-catenin inhibitor (β-catenin-IN-3). D Immunoprecipitation experiments were performed to evaluate interaction of CLIP170 and β-catenin in ACHN cells. Cell lysates were immunoprecipitated with control IgG, anti-CLIP170, or anti-β-catenin antibody, followed by detection with the indicated antibodies. E Colocalization of CLIP170 (red fluorescence) and β-catenin (green fluorescence) in ACHN cells was visualized by immunofluorescence. DAPI (blue fluorescence) was used to stain the nucleus. Scale bar = 10 μm. F Cartoon plot, surface plot and interface plot of 3D protein–protein docking models showing the interaction between CLIP170 and β-catenin. G The mRNA and protein levels of β-catenin were respectively detected by RT-qPCR and Western blot assays after CLIP170 overexpression or knockdown in ACHN cells. All results were shown with one representative image from three independent experiments. Data are mean ± SD; statistical significance was assessed by two-tailed Student's t-test; ns, no significant
Fig. 8
Fig. 8
CLIP170 knockdown promotes β-catenin degradation via ubiquitin–proteasome pathway. A Western blot analysis demonstrates the influence of CLIP170 knockdown on β-catenin stability in ACHN and CAKI-1 cells, subjected to cycloheximide treatment at varying time intervals. B ACHN and CAKI-1 cells, with or without CLIP170 knockdown, were treated with MG132 for 8 h. Western blotting was performed to assess the expression of CLIP170 and β-catenin proteins. C Levels of β-catenin ubiquitination in ACHN and CAKI-1 cells were examined following CLIP170 downregulation. After 8 h of MG132 treatment, cell lysates were subjected to co-immunoprecipitation using an anti-β-catenin antibody. Ubiquitination levels were detected using anti-ubiquitin antibody through Western blot analysis. Total cell lysates were also detected with anti-CLIP170, anti-β-catenin, and anti-GAPDH antibodies. All results were shown with one representative image from three independent experiments
Fig. 9
Fig. 9
CLIP170 knockdown attenuates the growth and EMT process of RCC in vivo. The xenograft tumor models were created through subcutaneously injecting ACHN cells which stably infected with CLIP170 overexpressing or knockdown lentivirus into the axilla of BALB/c nude mice (n = 5 for each group). After a 30-d period, the mice were humanely euthanized, and their tumors were extracted. A Tumor growth curves were generated by monitoring tumor volume measurements at five-day intervals. B Tumor image of each group after isolation from mice on the 30th day. C The measurement of tumor weight. D, E Immunohistochemistry images of xenograft tumor tissues were obtained, featuring representative staining for hematoxylin–eosin (H&E), β-catenin, FOSL1, Ki-67, E-cadherin, and Vimentin, and the results were shown with one representative image from three independent experiments. Scale bar = 100 μm. Data are mean ± SD; statistical significance was assessed by two-tailed Student's t-test; **P < 0.01, ***P < 0.001

Similar articles

Cited by

References

    1. Ljungberg B, Albiges L, Abu-Ghanem Y et al (2019) European Association of urology guidelines on renal cell carcinoma: the 2019 update. Eur Urol 75(5):799–810. 10.1016/j.eururo.2019.02.011 - PubMed
    1. Capitanio U, Montorsi F (2016) Renal cancer. Lancet 387(10021):894–906. 10.1016/s0140-6736(15)00046-x - PubMed
    1. Campbell SC, Clark PE, Chang SS et al (2021) Renal mass and localized renal cancer: evaluation, management, and follow-up: AUA guideline: Part I. J Urol 206(2):199–208. 10.1097/ju.0000000000001911 - PubMed
    1. Turajlic S, Swanton C, Boshoff C (2018) Kidney cancer: the next decade. J Exp Med 215(10):2477–2479. 10.1084/jem.20181617 - PMC - PubMed
    1. Hall A (2009) The cytoskeleton and cancer. Cancer Metastasis Rev 28(1–2):5–14. 10.1007/s10555-008-9166-3 - PubMed

MeSH terms

LinkOut - more resources