

Distribution and association of road traffic accident with depression among Indian population aged 45 years and above: nested multilevel modelling analysis of nationally representative cross-sectional survey
- PMID: 39607564
- PMCID: PMC11604859
- DOI: 10.1007/s44192-024-00118-w
Distribution and association of road traffic accident with depression among Indian population aged 45 years and above: nested multilevel modelling analysis of nationally representative cross-sectional survey
Abstract
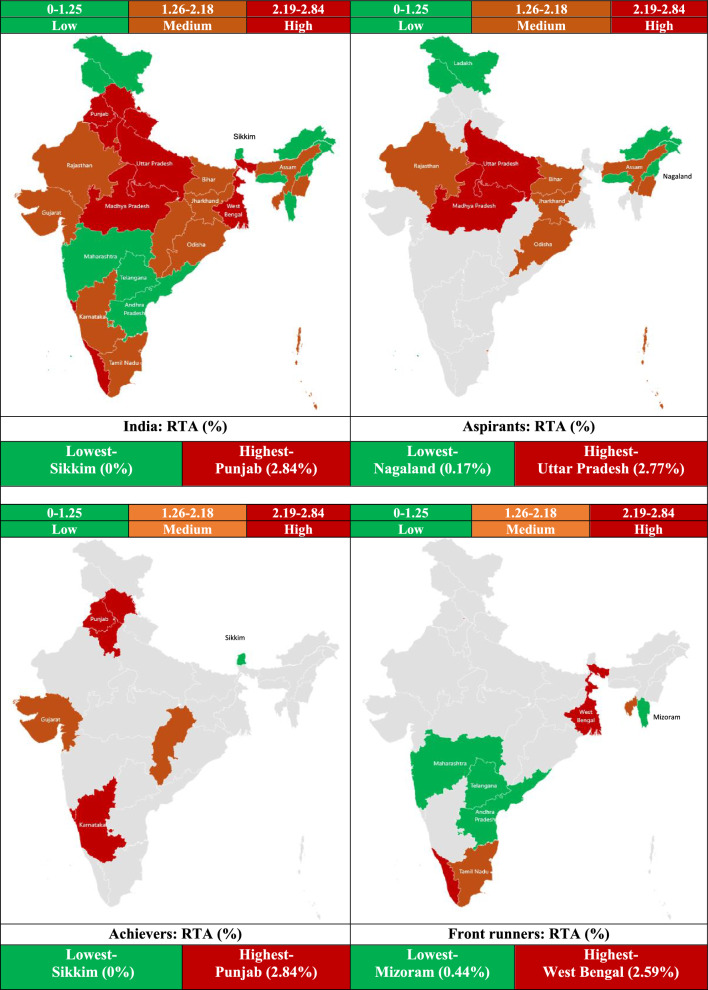
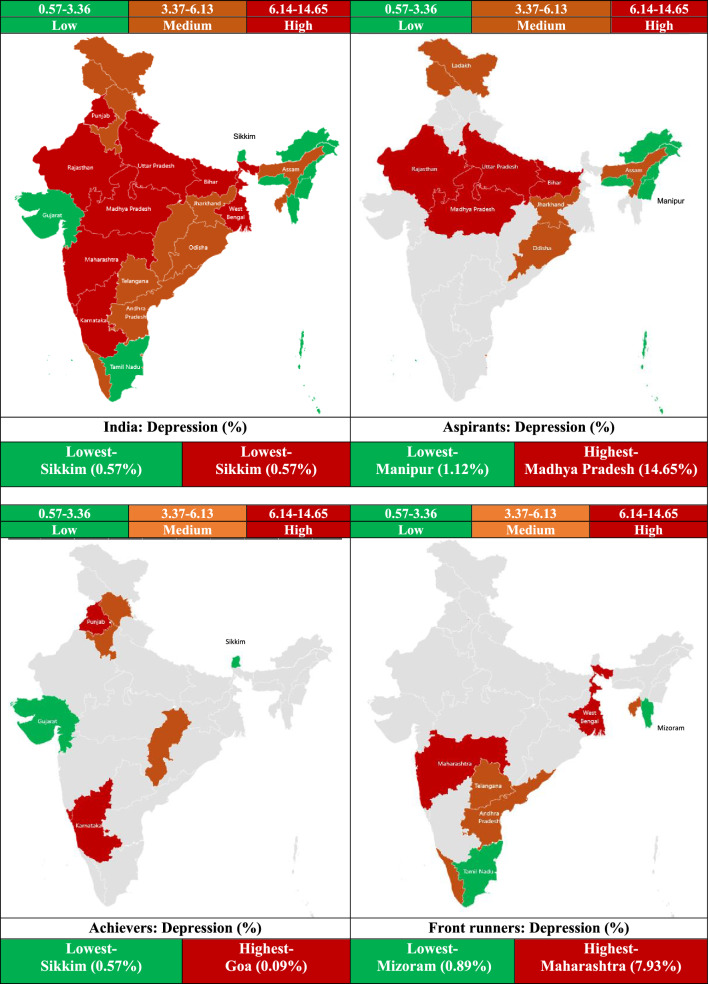
Introduction: The prevalence of important public health problems like road traffic accidents (RTA) and depression are surging. This study was aimed to estimate distribution and determine the association between RTA and depression among Indian population aged 45 years and above: overall and stratified into age group, gender and across states/union territories as aspirants, achievers, and front runners.
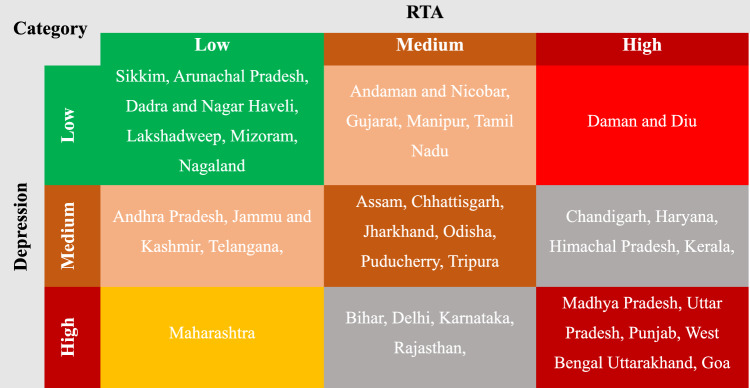
Methods: Using Longitudinal Aging Study in India (LASI) dataset (April 2017-December 2018), we have conducted this study among middle aged (45-59 years) and older adults and elderly (≥ 60 years) Indians. Bivariate analysis was conducted to estimate the prevalence of RTA and depression nationally and across aspirants, achievers, and front runner states. States and union territories were categorised as low, medium, and high as per RTA and depression prevalence, which were further cross tabulated. Spatial distribution maps were created using Microsoft Excel. We have documented the association of RTA with depression. To reduce the confounding effects of demographic and socioeconomic; health related and behavioural covariates; propensity score matching (PSM) was conducted. Nested multilevel regression modelling was analysed using STATA version 17.
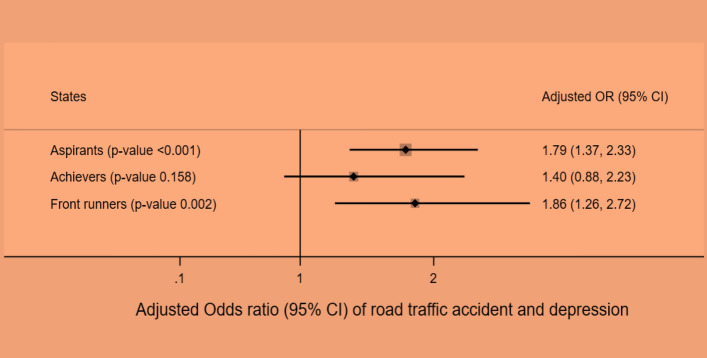
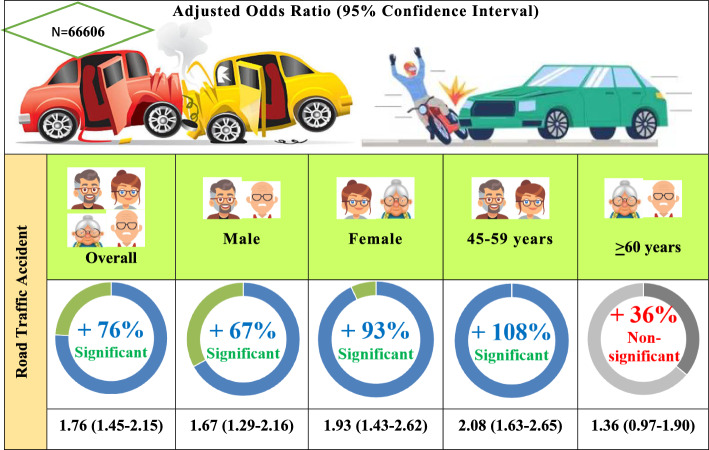
Results: Prevalence of RTA was 1.84% (1.74-1.94) nationally, highest among achiever states [2.04% (1.82-2.30)]. Prevalence of depression was 6.08% (5.90-6.26) nationally, highest among aspirant states [7.02% (6.74-7.30)]. The adjusted odds of having RTA was significantly among depressed [aOR (95% CI) 1.76 (1.45-2.15)] than non-depressed participants; which was much higher among females [aOR (95% CI) 1.93 (1.43-2.62)] than in males [aOR (95%CI) 1.67 (1.29-2.16)] and much higher among middle aged [aOR (95%CI) 2.08 (1.63-2.65)]. Odds of RTA was highest across front runners [aOR (95%CI) 1.86 (1.26-2.72)] followed by aspirant states [aOR (95%CI) 1.79 (1.37-2.33)].
Conclusion: This study established the positive association between depression and road traffic accidents among middle aged, older adults and elderly. Therefore, efforts must be taken to address mental health issues in them with proper policy implication more focused on females and middle aged. Front runner's states should get the limelight followed by aspirant states.
Keywords: Accidents; Depression; LASI; Middle aged; Older adults and elderly; RTA; Road traffic accidents.
© 2024. The Author(s).
Conflict of interest statement
Declarations. Ethics approval and consent to participate: Being a secondary analysis of a dataset freely available in the public domain, ethical approval for the present study was not deemed necessary. However, the ethical approval to conduct LASI was given by the Indian Council of Medical Research's (ICMR) Central Ethics Committee on Human Research (CECHR) [24]. We confirm that all experiments were performed in accordance with relevant guidelines and regulations. This study was performed in accordance with the ethical standards as laid down in the 1964, Declaration of Helsinki and its later amendments or comparable ethical standards. Consent to participate: Informed consent was obtained from the participants during the survey. Competing interests: The authors declare no competing interests.
Figures
Similar articles
-
How depression impacts on road traffic accidents among older adults and elderly Indians: Evidence from large scale nationally representative survey.J Family Med Prim Care. 2024 Dec;13(12):5720-5729. doi: 10.4103/jfmpc.jfmpc_973_24. Epub 2024 Dec 9. J Family Med Prim Care. 2024. PMID: 39790794 Free PMC article.
-
Distribution and association of depression with tobacco consumption among middle-aged and elderly Indian population: nested multilevel modelling analysis of nationally representative cross-sectional survey.J Health Popul Nutr. 2025 Mar 3;44(1):61. doi: 10.1186/s41043-025-00753-1. J Health Popul Nutr. 2025. PMID: 40033402 Free PMC article.
-
Association of anaemia with indoor air pollution among older Indian adult population: multilevel modelling analysis of nationally representative cross-sectional study.BMC Geriatr. 2024 Jun 29;24(1):567. doi: 10.1186/s12877-024-05171-2. BMC Geriatr. 2024. PMID: 38951755 Free PMC article.
-
Post-traumatic stress disorder and associated factors among road traffic accident survivors in Sub-Saharan Africa: A systematic review and meta-analysis.PLoS One. 2025 Feb 24;20(2):e0318714. doi: 10.1371/journal.pone.0318714. eCollection 2025. PLoS One. 2025. PMID: 39992947 Free PMC article.
-
Socioeconomic and behavioral factors of road traffic accidents among drivers in Ethiopia: systematic review and meta analysis.BMC Public Health. 2024 Oct 17;24(1):2857. doi: 10.1186/s12889-024-20376-1. BMC Public Health. 2024. PMID: 39415168 Free PMC article.
Cited by
-
Association of frailty with non-laboratory based cardiovascular disease risk score among older adults and elderly population: insights from longitudinal aging study in India (LASI-1st wave).BMC Public Health. 2025 Jan 22;25(1):269. doi: 10.1186/s12889-025-21359-6. BMC Public Health. 2025. PMID: 39844107 Free PMC article.
References
-
- Population-Aging-in-India_PGDA-Working-Papers.pdf. https://www.hsph.harvard.edu/wp-content/uploads/sites/1288/2012/11/Popul.... Accessed 5 June 2024.
-
- Gururaj G, Varghese M, Benegal V, Rao G, Pathak K, Singh L, et al. National Mental Health Survey of India, 2015–16. National Institute of Mental Health and Neuro Sciences, NIMHANS Publication No. 128. 2016. https://main.mohfw.gov.in/sites/default/files/National%20Mental%20Health.... Accessed 27 Nov 2024.
-
- Sinha P, Hussain T, Boora NK, Rao GN, Varghese M, Gururaj G, et al. Prevalence of Common mental disorders in older adults: results from the National Mental Health Survey of India. Asian J Psychiatr. 2021;55:102463. - PubMed
LinkOut - more resources
Full Text Sources
Miscellaneous
