. 2025 Jun;21(3):465-483.
doi: 10.1007/s11302-024-10062-7. Epub 2024 Nov 28.

The role of the P2X7 receptor in inactivated SARS-CoV-2-induced lung injury

Affiliations

The role of the P2X7 receptor in inactivated SARS-CoV-2-induced lung injury

N C Carvalho-Barbosa et al. Purinergic Signal. 2025 Jun.

Abstract

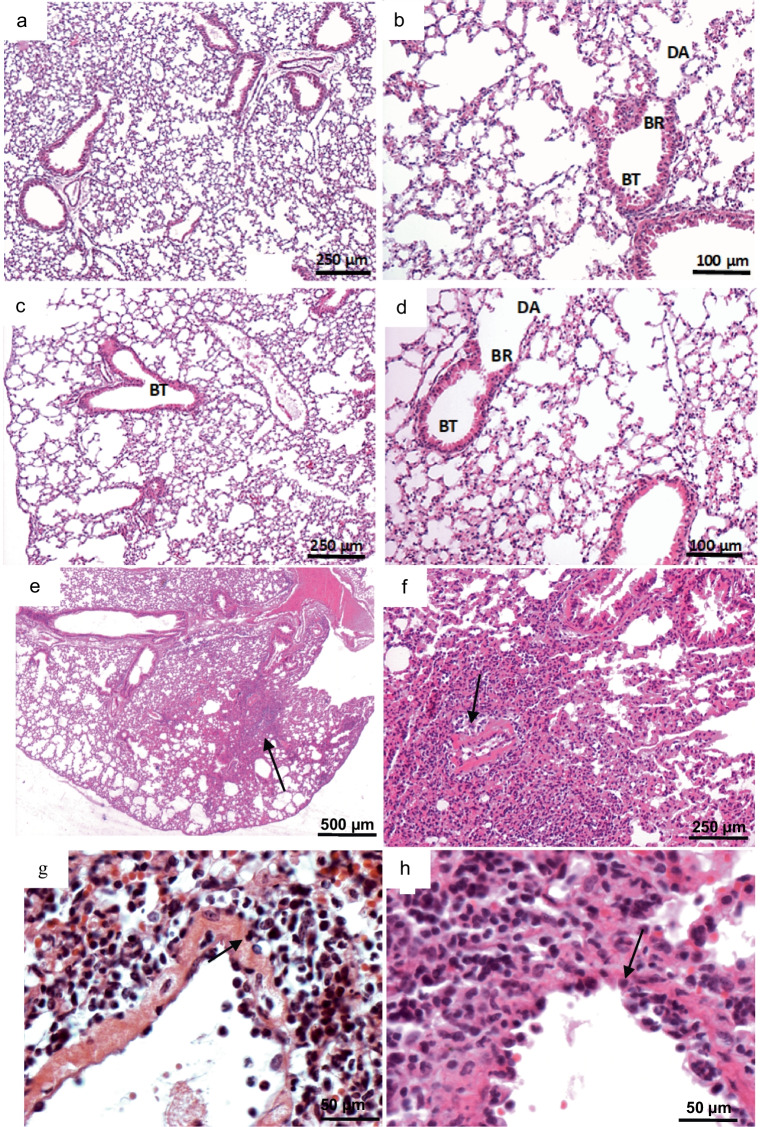
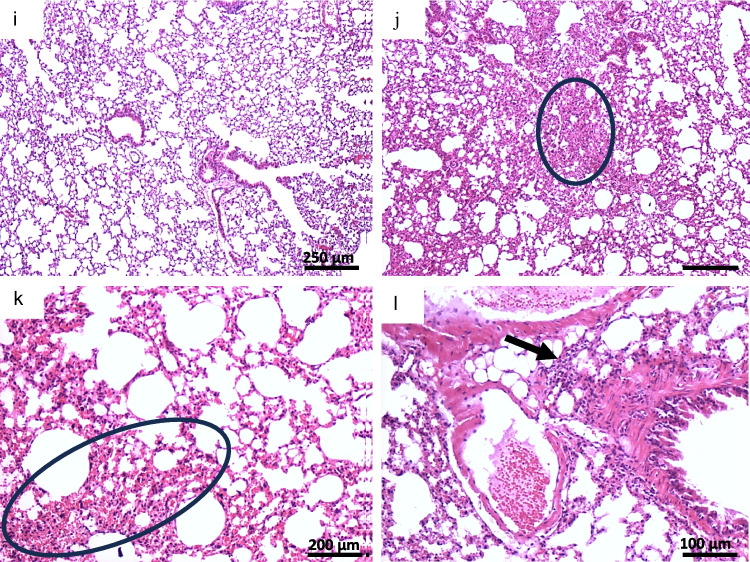
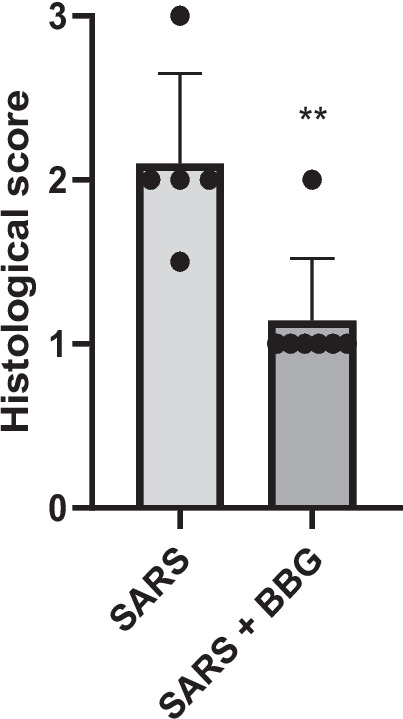
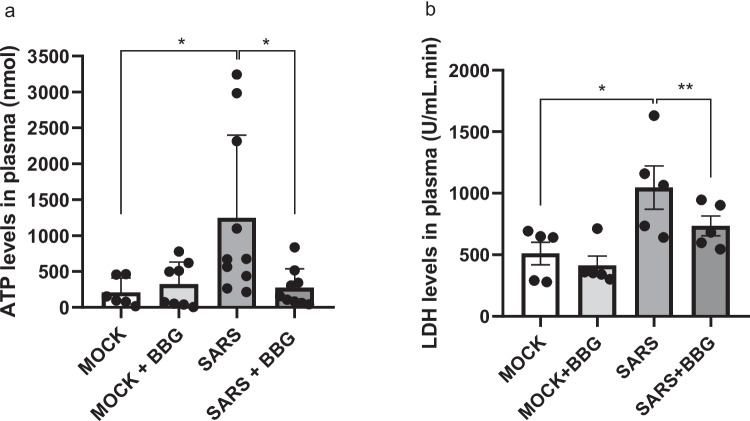
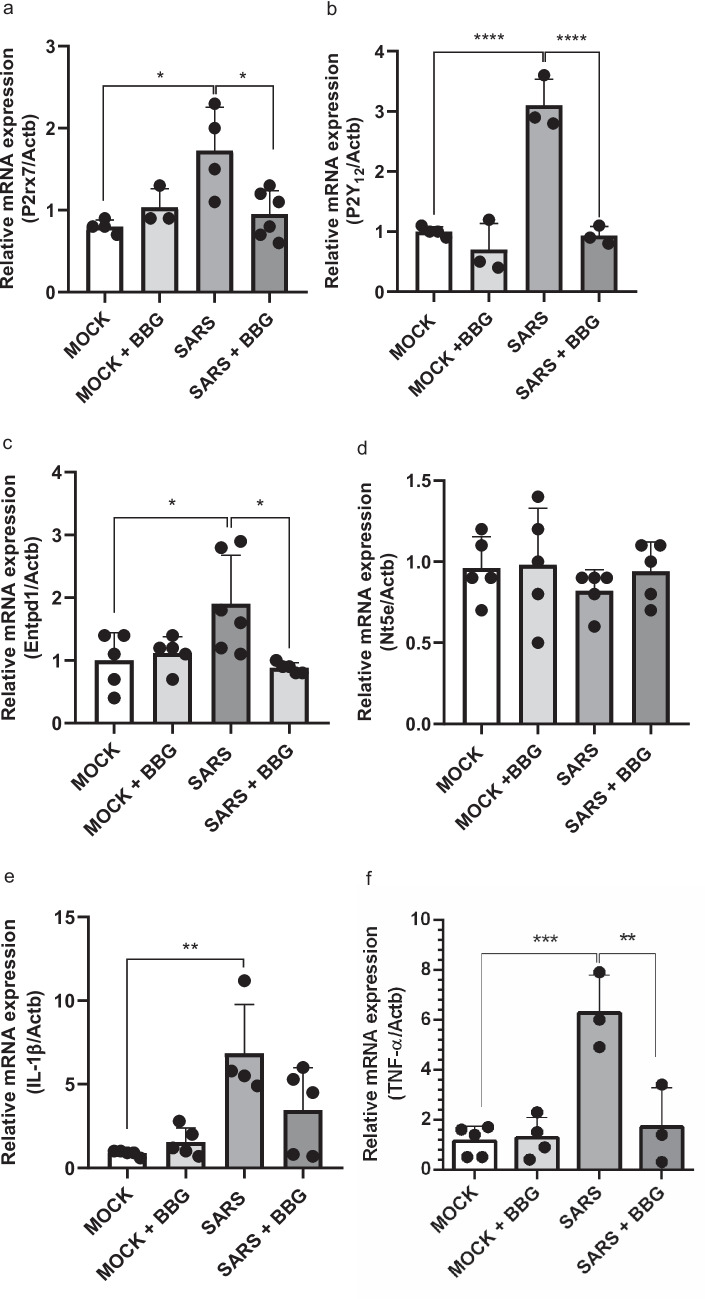
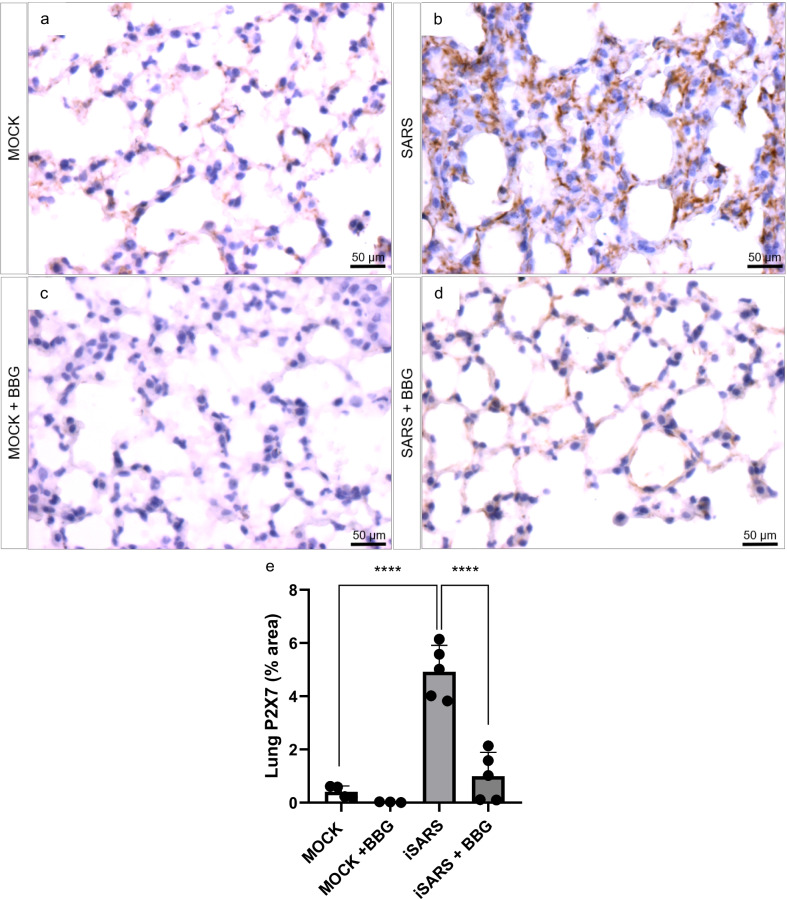
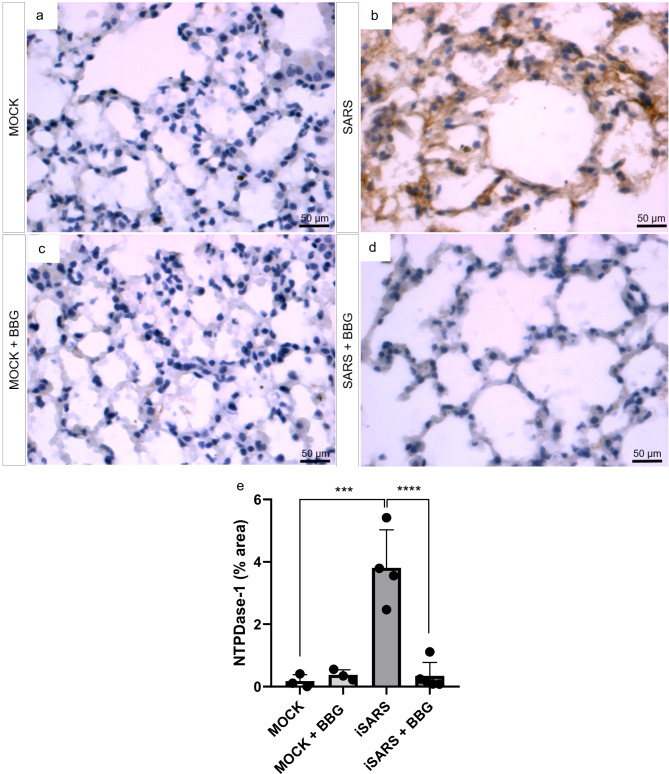
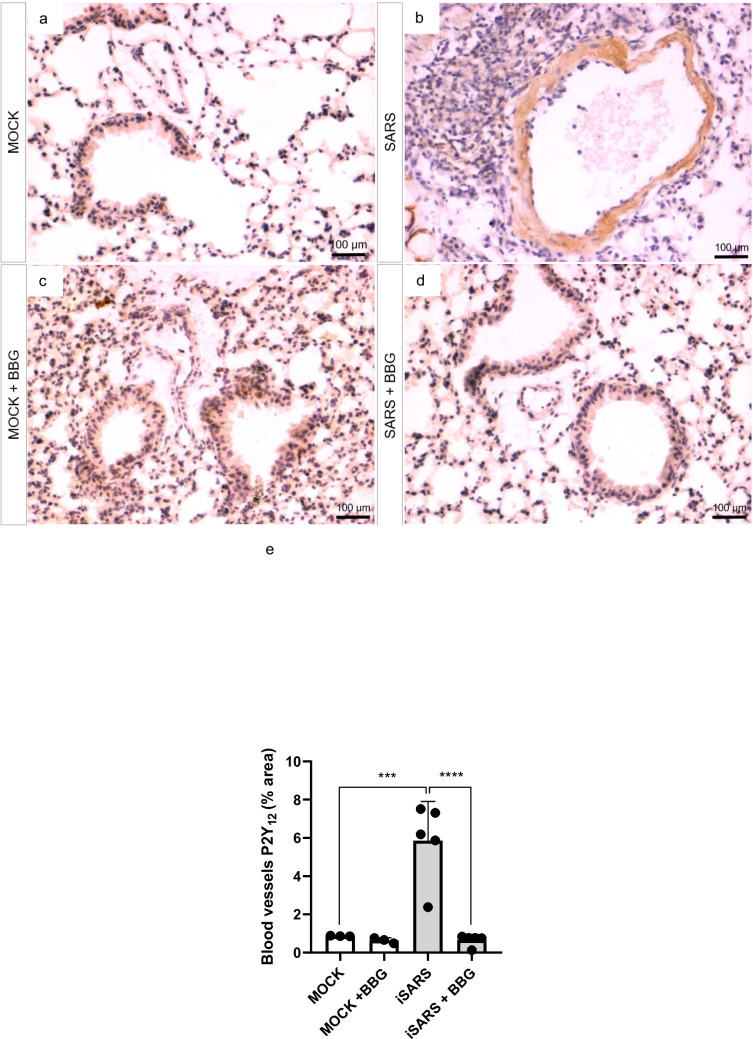
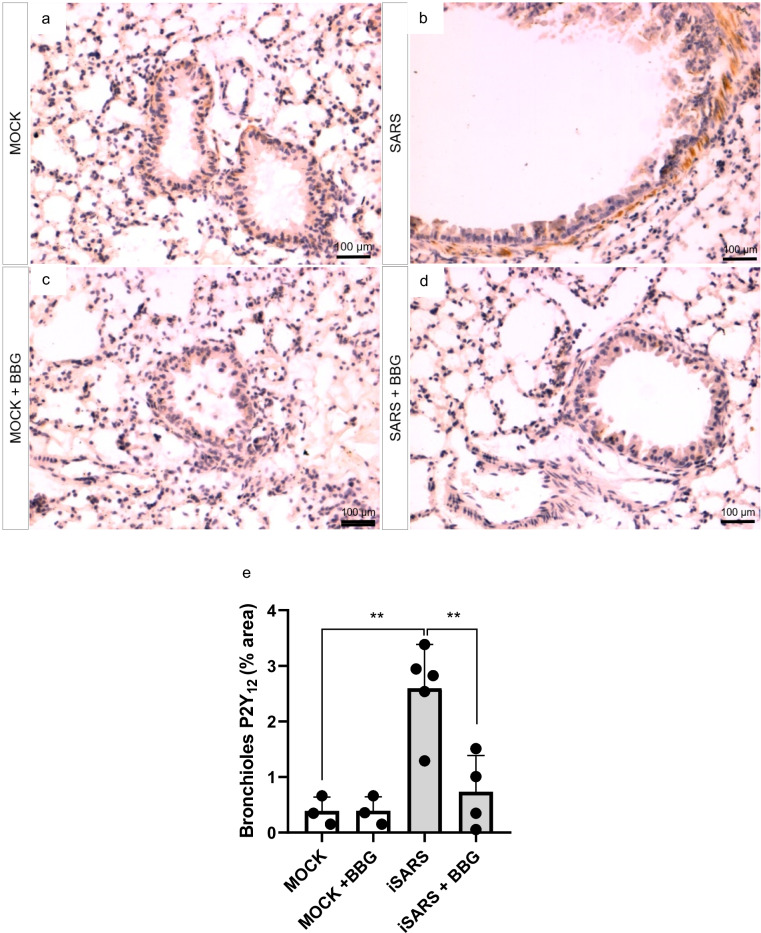
Purinergic signaling plays a role in the pathophysiology of different viral infections. Recently, we showed that COVID-19 increases extracellular ATP levels, which may amplify the pro-inflammatory signals in the disease. The P2X7 receptor can be a protagonist in the pro-inflammatory responses. Herein, we investigated the role of the P2X7 receptor in the lung immune response triggered by inoculation of inactivated SARS-CoV-2 (iSARS-CoV-2) in K18-Human ACE2 transgenic mice. Pharmacological inhibition of the P2X7 receptor was performed with intraperitoneal administration of 50 mg/kg of Brilliant Blue G (BBG) one day before viral inoculation. Animals were divided into four groups: a control group (MOCK), a group inoculated with the inactivated virus iSARS-CoV-2, a BBG-treated control group (MOCK + BBG), and a BBG-treated inoculated group (iSARS-CoV-2 + BBG). Virus inoculation was intratracheal with 50 µl of mock or 2 × 10⁶ Plaque Forming Units (PFU) of iSARS-CoV-2. After three days, blood and lungs were collected. We found a significant increase in ATP and LDH in serum and mRNA levels of P2X7 and P2Y12 receptors, CD39, IL-1β, and TNF-α in the lung of the iSARS-CoV-2 group when compared with the control group. BBG treatment attenuated these increases. Lung histological analyses showed severe lung damage in the iSARS-CoV-2 group, which was reduced by the BBG treatment. Immunohistochemical staining confirmed the increased presence of P2X7, P2Y12, and CD39 proteins in the iSARS-CoV-2 vs. the MOCK group. Thus, P2X7 receptor inhibition decreases iSARS-CoV-2-induced lung inflammation, indicating that this receptor might contribute to SARS-CoV-2 pathology.

Keywords: ATP; CD39; COVID-19; Lung inflammation; P2Y12; Purinergic signaling.


Conflict of interest statement

Declarations. Competing interests: The authors declare no competing interests. Ethical approval: The Institutional Animal Care and Use Committee of the Federal University of Rio de Janeiro (protocol number 088/21) reviewed and approved the animal study.

Figures

Fig. 1
Fig. 1
Histological analysis shows the inflammation triggered by SARS-CoV-2 and a significant reduction from the intervention with BBG. Hematoxylin and Eosin (HE) staining. Animals were inoculated with 50 μL of mock or iSARS-CoV-2 (2 × 10.6 PFU) by intratracheal administration. BBG inoculation was 24 h before mock or iSARS-CoV-2 inoculation by intraperitoneal administration, 50 mg/kg. Lung samples were collected three days after mock or iSARS-CoV-2 inoculation. In a-b histological analysis of mice from the MOCK group, in c-d MOCK + BBG group, e–h SARS group, i-l SARS + BBG group. a. Preserved lung parenchyma. b. Terminal bronchiole (TB) with preserved endothelium, respiratory bronchiole (RB), and alveolar duct (AD). c. Terminal bronchiole (TB). d. Terminal bronchiole (TB) with preserved endothelium, respiratory bronchiole (RB), and alveolar duct (AD). e. Modified lung parenchyma with an area of collapse ("c"), an area with dilation (“d”), and a vessel with perivascular inflammation (arrow). f. Vessel with inflammatory infiltrate (arrow). g. Inflammatory cells. h. Vasculitis. i. Lung parenchyma. j. Collapse areas (circle). k. Area of hemorrhage (circle). l. Perivascular infiltrate (arrow). Representative image (n = 5 for group)
Fig. 1
Fig. 1
Histological analysis shows the inflammation triggered by SARS-CoV-2 and a significant reduction from the intervention with BBG. Hematoxylin and Eosin (HE) staining. Animals were inoculated with 50 μL of mock or iSARS-CoV-2 (2 × 10.6 PFU) by intratracheal administration. BBG inoculation was 24 h before mock or iSARS-CoV-2 inoculation by intraperitoneal administration, 50 mg/kg. Lung samples were collected three days after mock or iSARS-CoV-2 inoculation. In a-b histological analysis of mice from the MOCK group, in c-d MOCK + BBG group, e–h SARS group, i-l SARS + BBG group. a. Preserved lung parenchyma. b. Terminal bronchiole (TB) with preserved endothelium, respiratory bronchiole (RB), and alveolar duct (AD). c. Terminal bronchiole (TB). d. Terminal bronchiole (TB) with preserved endothelium, respiratory bronchiole (RB), and alveolar duct (AD). e. Modified lung parenchyma with an area of collapse ("c"), an area with dilation (“d”), and a vessel with perivascular inflammation (arrow). f. Vessel with inflammatory infiltrate (arrow). g. Inflammatory cells. h. Vasculitis. i. Lung parenchyma. j. Collapse areas (circle). k. Area of hemorrhage (circle). l. Perivascular infiltrate (arrow). Representative image (n = 5 for group)
Fig. 2
Fig. 2
iSARS-CoV-2 increases pathological injury in the lung of K18ACE-2 mice, and BBG attenuates these injuries. Mice were inoculated with 2 × 106 PFU of iSARS-CoV-2. Lung samples were collected three days after inoculation. The graph shows individual values; data are expressed as mean ± SEM (n = 5–6). Non-parametric analysis (T-test) was used, **p < 0.001
Fig. 3
Fig. 3
iSARS-CoV-2 increases extracellular ATP and LDH levels in the plasma of K18ACE-2 mice. Animals were inoculated with 2 × 106 PFU of iSARS-CoV-2. ATP and LDH levels were measured using an ATP and LDH determination kit. Plasma samples were collected on euthanasia day, three days after inoculation. The graph shows individual values; data is expressed as mean ± SD (n = 6–10). Simple one-way ANOVA was used, *p < 0.05, **p < 0.01
Fig. 4
Fig. 4
iSARS-CoV-2 upregulates the relative gene expression of P2X7, P2Y12, CD39, IL-1β, and TNF-α mRNA in lung K18ACE-2 mice. K18ACE-2 mice were inoculated with 2 × 106 PFU of iSARS-CoV-2 intratracheally 24 h before inoculation; the treated group received 50 mg/kg of BBG. Lung samples were collected three days after viral inoculation. RT-qPCR determined the relative gene expression. a. Relative gene expression of P2X7. b. Relative gene expression of P2Y12. c. Relative gene expression of Entpd1. d. Relative gene expression of Nt5e. e. Relative gene expression of IL-1β. f. Relative gene expression of TNF-α. The graph indicates individual values and data are expressed as mean ± SD (n = 3–6). Simple one-way ANOVA was used, *p < 0.05, **p < 0.01, ****p < 0.001
Fig. 5
Fig. 5
iSARS-CoV-2 increases P2X7 receptor expression in the lung. Animals were inoculated with 50 μL of mock or iSARS-CoV-2 (2 × 106 PFU) by intratracheal administration. BBG inoculation was 24 h before mock or iSARS-CoV-2 inoculation by intraperitoneal administration, 50 mg/kg. Lung samples were collected three days after mock or iSARS-CoV-2 inoculation. In a. MOCK group control, b. MOCK + BBG group, c. SARS group, d. SARS + BBG group, and e., shows the quantification of immunostaining: representative images and quantitative analysis for immunohistochemical. Data represent three independent experiments (n = 3) and are expressed as mean ± SEM of 20 fields per condition. The graph indicates individual values, and data are expressed as mean ± SD. Simple one-way ANOVA was used, ****p < 0.0001 (n = 3–5 for the group)
Fig. 6
Fig. 6
iSARS-CoV-2 increases CD39 expression in lung. Animals were inoculated with 50 μL of mock or iSARS-CoV-2 (2 × 106 PFU) by intratracheal administration. BBG inoculation was 24 h before mock or iSARS-CoV-2 inoculation by intraperitoneal administration, 50 mg/kg. Lung samples were collected three days after mock or iSARS-CoV-2 inoculation. In a. MOCK group control, b. MOCK + BBG group, c. SARS group, d. SARS + BBG group. Representative images and quantitative analysis for (A–D) CD39. Data represent three independent experiments (n = 3) and are expressed as mean ± SEM of 20 fields per condition. The graph indicates individual values, and data are expressed as mean ± SD. Simple one-way ANOVA was used, ***p < 0.001; ****p < 0.0001 (n = 3–5 for the group)
Fig. 7
Fig. 7
iSARS-CoV-2 increases P2Y12 receptor expression in the vessels. Animals were inoculated with 50 μL of mock or iSARS-CoV-2 (2 × 106 PFU) by intratracheal administration. BBG inoculation was 24 h before mock or iSARS-CoV-2 inoculation by intraperitoneal administration, 50 mg/kg. Lung samples were collected three days after mock or iSARS-CoV-2 inoculation. In a. MOCK group control, b. MOCK + BBG group, c. SARS group, d. SARS + BBG group. Representative images and quantitative analysis for immunohistochemical. Data represent three independent experiments (n = 3) and are expressed as mean ± SEM of ten fields per condition. The graph indicates individual values, and data are expressed as mean ± SD. Simple one-way ANOVA was used, ***p = 0.001, ****p < 0.0001 (n = 3–4 for the group)
Fig. 8
Fig. 8
iSARS-CoV-2 increases P2Y12 receptor expression in bronchioles. Animals were inoculated with 50 μL of mock or iSARS-CoV-2 (2 × 106 PFU) by intratracheal administration. BBG inoculation was 24 h before mock or iSARS-CoV-2 inoculation by intraperitoneal administration, 50 mg/kg. Lung samples were collected three days after mock or iSARS-CoV-2 inoculation. In a. MOCK group control, b. MOCK + BBG group, c. SARS group, d. SARS + BBG group. Representative images and quantitative analysis for immunohistochemical. Data represent three independent experiments (n = 3) and are expressed as mean ± SEM of ten fields per condition. The graph indicates individual values, and data are expressed as mean ± SD. Simple one-way ANOVA was used, **p = 0.01 (n = 3–4 for group)

Similar articles

References

    1. Chan JF, Kok KH, Zhu Z, Chu H, To KK, Yuan S, Yuen KY (2020) Genomic characterization of the 2019 novel human-pathogenic coronavirus isolated from a patient with atypical pneumonia after visiting Wuhan. Emerg Microbes Infect 9:221–236 - PMC - PubMed
    1. Wu F, Zhao S, Yu B, Chen YM, Wang W, Song ZG, Hu Y, Tao ZW, Tian JH, Pei YY, Yuan ML, Zhang YL, Dai FH, Liu Y, Wang QM, Zheng JJ, Xu L, Holmes EC, Zhang YZ (2020) A new coronavirus associated with human respiratory disease in China. Nature 579:265–269 - PMC - PubMed
    1. Ruan YJ, Wei CL, Ee AL, Vega VB, Thoreau H, Su ST, Chia JM, Ng P, Chiu KP, Lim L, Zhang T, Peng CK, Lin EO, Lee NM, Yee SL, Ng LF, Chee RE, Stanton LW, Long PM, Liu ET (2003) Comparative full-length genome sequence analysis of 14 SARS coronavirus isolates and common mutations associated with putative origins of infection. Lancet 361:1779–1785 - PMC - PubMed
    1. Rehman SU, Shafique L, Ihsan A, Liu Q (2020) Evolutionary Trajectory for the Emergence of Novel Coronavirus SARS-CoV-2. Pathogens 9:240 - PMC - PubMed
    1. Jarczak D, Nierhaus A (2022) Cytokine Storm-Definition, Causes, and Implications. Int J Mol Sci 23:11740 - PMC - PubMed

Substances