. 2024 Dec 11;52(22):13733-13756.
doi: 10.1093/nar/gkae1105.

UHRF1 ubiquitin ligase activity supports the maintenance of low-density CpG methylation

Affiliations

UHRF1 ubiquitin ligase activity supports the maintenance of low-density CpG methylation

Rochelle L Tiedemann et al. Nucleic Acids Res. .

Abstract

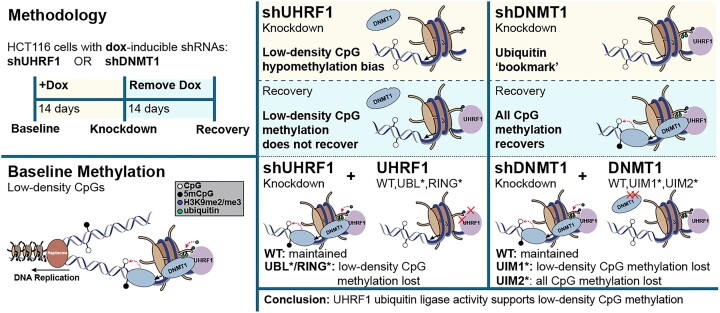
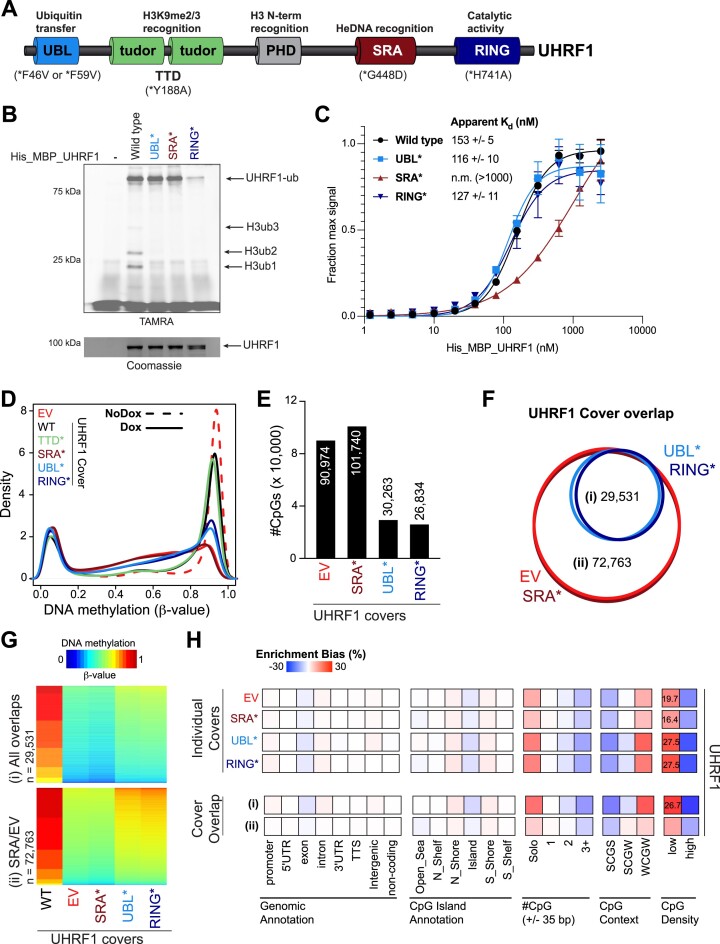
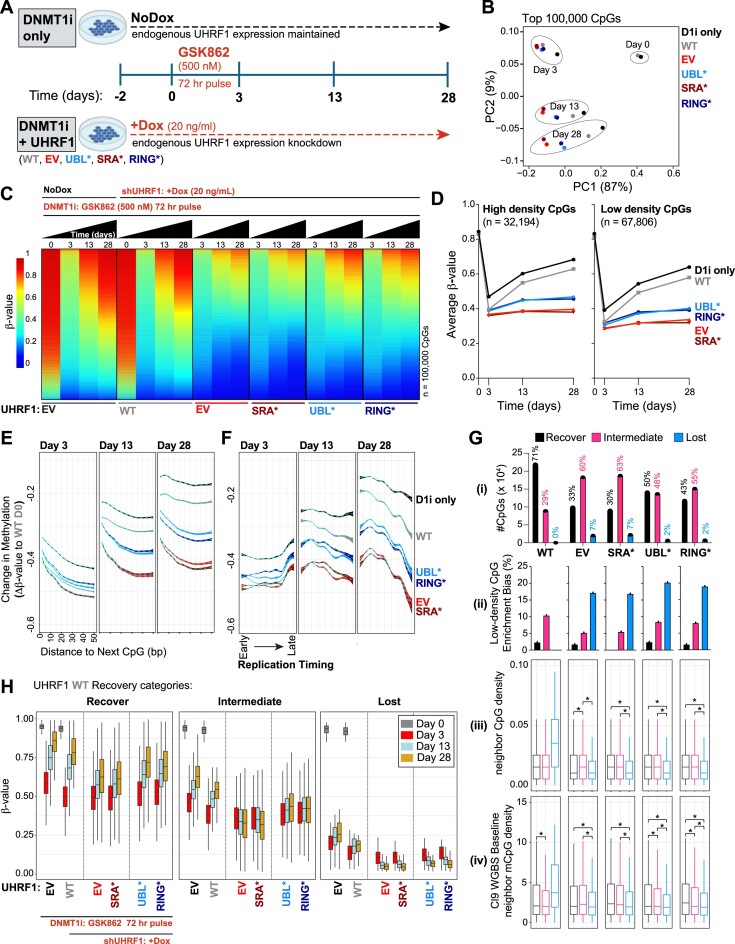
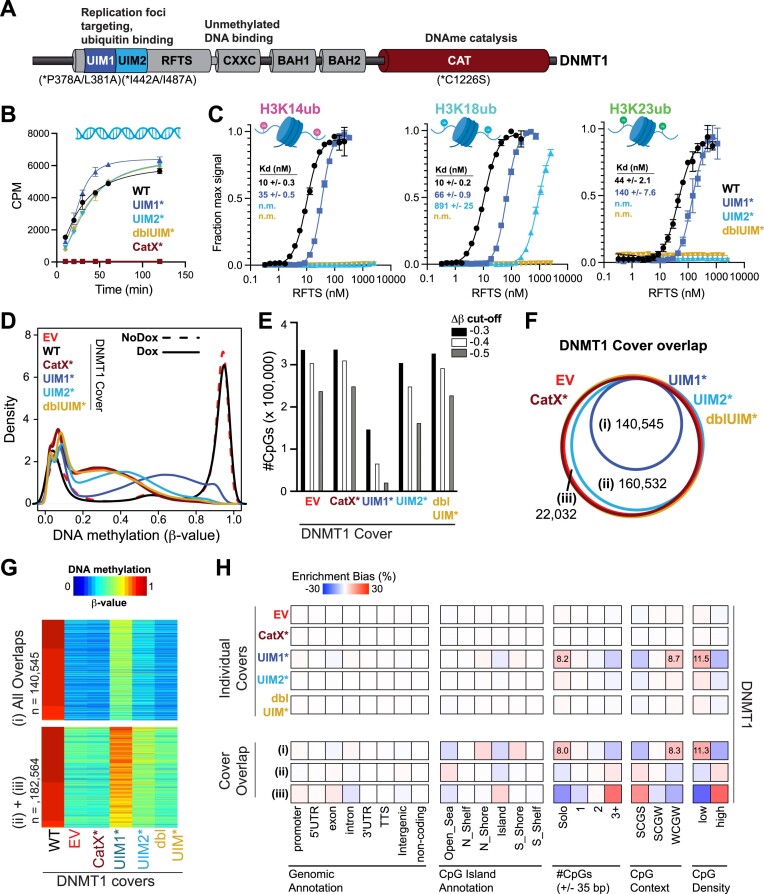
The RING E3 ubiquitin ligase UHRF1 is an established cofactor for DNA methylation inheritance. The model posits that nucleosomal engagement through histone and DNA interactions directs UHRF1 ubiquitin ligase activity toward lysines on histone H3 tails, creating binding sites for DNMT1 through ubiquitin interacting motifs (UIM1 and UIM2). However, the extent to which DNMT1 relies on ubiquitin signaling through UHRF1 in support of DNA methylation maintenance remains unclear. Here, with integrative epigenomic and biochemical analyses, we reveal that DNA methylation maintenance at low-density cytosine-guanine dinucleotides (CpGs) is particularly vulnerable to disruption of UHRF1 ubiquitin ligase activity and DNMT1 ubiquitin reading activity through UIM1. Hypomethylation of low-density CpGs in this manner induces formation of partially methylated domains (PMDs), a methylation signature observed across human cancers. In contrast, UIM2 disruption completely abolishes the DNA methylation maintenance function of DNMT1 in a CpG density-independent manner. In the context of DNA methylation recovery following acute DNMT1 depletion, we further reveal a 'bookmarking' function for UHRF1 ubiquitin ligase activity in support of DNA re-methylation. Collectively, these studies show that DNMT1-dependent DNA methylation inheritance is a ubiquitin-regulated process that is partially reliant on UHRF1 and suggest a disrupted UHRF1-DNMT1 ubiquitin signaling axis contributes to PMD formation in cancers.


Figures

Graphical Abstract
Graphical Abstract
Figure 1.
Figure 1.
Low-density CpGs are most prone to DNA hypomethylation when UHRF1 levels are reduced. (A) Schematic of experimental design including samples, time-points, and types of DNA methylation data collected. (B) DNA methylation distributions of EPIC array probes from dox-inducible shRNA HCT116 cell lines without (black) and with (red) dox treatment (10 ng/ml) for 14 days. Top panel: Density plots for CpG probe distribution across DNA methylation levels [β-value: 0 (unmethylated) to 1 (methylated)]. Bottom panel: Density scatterplots demonstrating density of probes and DNA methylation level in baseline (x-axis) and knockdown (y-axis) methylomes. (C) Bar graph for number of differentially mCpGs (EPIC array) for each knockdown experiment (β-valueBaselineformula image 0.85; varying Δβ-valueKnockdown cutoffs relative to each respective Baseline sample). (D) Hypergeometric analysis of significantly hypomethylated CpGs for each sample from 1C. Positive values indicate significant overrepresentation for hypomethylation of the feature and negative values indicate significant underrepresentation. Enrichment bias values are provided for the most significant positive enrichments. #CpGs indicates the number of CpGs formula image 35 bp upstream and downstream of the hypomethylated CpG. CpG Context represents the −1/+1 position nucleotide (S = C or G; W = A or T) flanking the hypomethylated CpG. CpG density is determined by the number of bps to the next CpG (either upstream or downstream). Low density formula image 20 bp, high density < 20 bp. (E) Normalized preference for CpG density among the shUHRF1 and shDNMT1 samples. ‘CpG density preference’ is calculated by subtracting the average Δβ-value of all the high-density CpGs (EPIC) from the average Δβ-value of the low-density CpGs, divided by the total Δβ-value of all CpGs. As this is a sample-dependent calculation, the difference in the numerator (Δβlow_density CpGs – Δβhigh_denisty CpGs) informs on which CpG density is most hypomethylated relative to all hypomethylated CpGs, where negative values indicate high-density CpG preference and positive values indicate low-density CpG preference. (F) Histogram of the calculated percent methylation lost [(β-valueKnockdown(X) – β-valueBaseline)/Δβ-valueKnockdown(Day14)]*100 across early time points (X = Days 2, 4, 7) for all significantly hypomethylated CpGs in shUHRF1 knockdown (Cl.6) from 1C. Median % Methylation Lost is indicated by the dotted line for each time point. (G) Bar graph for number of differentially mCpGs (β-valueBaselineformula image 0.85, varying Δβ-valueKnockdown cutoffs relative to Baseline) across the early time-points in shUHRF1 knockdown (Cl.6). (H) Hypergeometric analysis of significantly hypomethylated CpGs (from 1G) across the early shUHRF1 (Cl.6) time-points. Legend from 1D applies. (I) Average loss of DNA methylation for all highly methylated CpGs (β-valueBaselineformula image 0.85) across ‘Distance to the Next CpG’ binning. Dotted line indicates the average Δβ-value as a function of distance, colored boundaries indicate 95% confidence intervals. (J) Hypergeometric analysis of significantly hypomethylated CpGs (WGBS) for each sample across CpG binning by ‘Distance to the Next CpG’ (bp). Positive enrichment bias indicates overrepresentation, negative enrichment bias indicates underrepresentation. Dotted line indicates peak positive enrichment bias for all shUHRF1 clones at 32 bp. (K) Boxplots for change in methylation (ΔmCKnockdown) of all highly methylated CpGs (mCBaselineformula image 0.85) from WGBS of each indicated sample across CpG binning by ‘Distance to the Next CpG’. The 32 bp boxplot (peak enrichment bias from 1J) is highlighted. Whiskers were removed for figure clarity. See alsoSupplementary Figure S1.
Figure 2.
Figure 2.
Hypomethylation of low-density CpGs in the absence of UHRF1 and DNMT1 reshapes the DNA methylome. (A) Average DNA methylation (mC) of high and low density CpGs in (i) Baseline and (ii) Knockdown phases and the (iii) average change in methylation (ΔmCKnockdown) across each replication timing phase (16-phase) in HCT116 cells. Replication timing phases are assigned in 50 kb windows genome-wide, and the average DNA methylation (from WGBS) is calculated in 100 bp bins from the start of the 50 kb window to the end for each timing phase. Vertical lines indicate the separation of the different replication timing phases from early to late. shUHRF1 Cl.6 and shDNMT1 Bulk (replicate 1) samples are provided in the main figure. Remaining WGBS samples are presented in Supplementary Figure S2A. (B) Normalized preference for CpG density in shUHRF1 and shDNMT1 samples across replicating timing phases. ‘CpG Density Preference’ is calculated by subtracting the average ΔmC of all the high-density CpGs (WGBS) from the average ΔmC of the low-density CpGs, divided by the total ΔmC of all CpGs in 100 bp bins as described in 2A. Positive values indicate preference for low-density CpGs and negative values for high-density CpGs. (C) Normalized preference for CpG density in shUHRF1 and shDNMT1 samples across genomic features known to be localized in early replicating chromatin (HMDs, H3K36me3) and mid/late replicating domains (H3K27me3/H3K9me3). DNA methylation is averaged from the 5′ end of the Domain/Peak to the 3′end in size normalized windows. (D) Proportional coverage of the genome for called Methylation Domains in the Baseline and Knockdown stage for each shUHRF1 and shDNMT1 WGBS sample. HMD, highly methylated domain; PMD, partially methylated domain; LMR, lowly methylated region; UMR, unmethylated region. Baseline mC distributions for methylation domains are provided in Supplementary Figure S2C. (E) Distribution shift of called Methylation Domains in the Knockdown methylome from Baseline HMDs (left) and PMDs (right). (F) Overlap analysis of called Methylation Domains from Baseline and Knockdown methylomes across shUHRF1 and shDNMT1 WGBS samples. The Jaccard Index measures the extent of the overlap with 0 being no overlap to 1 being complete overlap. (G) Scatterplot of UMR length in Baseline methylomes versus Knockdown methylomes. Over 90% of the UMRs located within Baseline PMDs expand with loss of UHRF1 and DNMT1. (H) Browser shot of 22 Mb region on Chr15 demonstrating the observations made from WGBS sequencing analysis of Baseline and Knockdown methylomes in the shUHRF1 Cl.6 sample integrated with Repli-Seq, histone PTMs, and locality of called methylation domains. See alsoSupplementary Figure S2.
Figure 3.
Figure 3.
Recovery of low-density CpG methylation requires UHRF1. (A) Recovery analysis strategy for classifying recovery dynamics of significantly hypomethylated CpGs (from Supplementary Figure S1D) across shUHRF1 and shDNMT1 (WGBS) samples. shUHRF1 Clone 9 is presented to illustrate recovery dynamic binning analysis. DNA methylation recovery is determined by calculating the ΔmC of Day 28 samples (Recovery) to the respective Baseline (NoDox) samples. DNA methylation recovery measurements were then binned into three groups, where CpGs with recovery values (|ΔmCRecovery|*100) < 30% are considered lost, > 70% are considered recovered, and between 30 and 70% are considered intermediate recovered. (B) Distribution of recovery categories among shUHRF1 and shDNMT1 samples (WGBS). Legend from 3A applies. (C) Hypergeometric analysis for enrichment of low-density CpGs across recovery categories for each shUHRF1 and shDNMT1 sample (WGBS) from 3B. (D) Boxplots for change in methylation recovery (ΔmCRecovery) of all highly methylated CpGs (mCBaselineformula image 0.85) from WGBS of each indicated sample across CpG binning by ‘Distance to the Next CpG’ [color bar (2–100 bp)]. Whiskers were removed for figure clarity. (E) Boxplots for change in methylation recovery (ΔmCRecovery) of all highly methylated CpGs (mCBaselineformula image 0.85) from WGBS of each indicated sample across replication timing phases. (F) Proportional coverage of the genome of called Methylation Domains in the Recovery stage for each shUHRF1 and shDNMT1 sample (WGBS). (G) Overlap analysis of called Methylation Domains from Baseline and Recovery methylomes across shUHRF1 and shDNMT1 WGBS samples. The Jaccard Index measures the extent of the overlap with 0 being no overlap and 1 being complete overlap. (H) Browser shot of 10 Mb region on Chr5 demonstrating the observations made from WGBS analysis of the Recovery methylome in shUHRF1 Cl.6 and shDNMT1 replicate 1 samples integrated with Repli-Seq, histone PTMs, and locality of called Methylation Domains. See alsoSupplementary Figure S3.
Figure 4.
Figure 4.
UHRF1 ubiquitin ligase activity is required for the maintenance of low-density CpG methylation. (A) Schematic of UHRF1 protein domains and mutations made to the UHRF1 transgene covers. (B) In vitro ubiquitin ligase activity assays with recombinant WT UHRF1 or the indicated domain loss-of-function mutants and unmodified nucleosomes with 26 bp linker DNA as substrate. (C) In vitro Alpha-screen proximity assays measuring interactions between unmodified nucleosomes with 26 bp linker DNA and recombinant recombinant WT UHRF1 or the indicated domain loss-of-function mutants. (D) Density plot for CpG probe distribution across DNA methylation levels [β-value: 0 (unmethylated) to 1 (methylated)] for WT and mutant(*) UHRF1 transgene covers. (E) Bar graph of number of hypomethylated CpGs (EPIC array) for each UHRF1 cover (β-valueWT_coverformula image 0.85; Δβ-valuemutant_coversformula image −0.3). (F) Venn diagram demonstrating overlap of hypomethylated CpGs from UHRF1 cover experiments. (G) Heatmap of DNA methylation (β-value) values for overlapping hypomethylated CpGs from the (i) Ubiquitin mutant covers and (ii) EV and SRA mutant covers. (H) Hypergeometric analysis of hypomethylated CpGs from UHRF1 cover experiments. Positive values indicate significant overrepresentation for hypomethylation of the feature (genomic annotation, CpG island annotation, etc.) and negative values indicate significant underrepresentation. Enrichment bias values are provided for the most significant positive enrichments. See alsoSupplementary Figure S4.
Figure 5.
Figure 5.
UHRF1 ubiquitin ligase activity is required for recovery of low-density CpG methylation. (A) Schematic of treatment paradigm in HCT116 dox-inducible shUHRF1 Clone 9 cells with UHRF1 transgene covers (used in experiments presented in Figure 4). To inhibit DNMT1 activity, all cell lines were treated with a single-dose of GSK-3484862 (GSK862) (500 nM) for 72 h. For the DNMT1i only control (D1i only), cells were not treated with dox in order to maintain expression of endogenous UHRF1. DNMT1i + UHRF1 cover lines were pretreated with dox (20 ng/ml) for 48 h prior to GSK862 to remove expression of endogenous UHRF1 and measure depletion and recovery of DNA methylation in the presence of the UHRF1 transgene cover. Dox treatment (20 ng/ml) was maintained throughout the duration of the experiment (28 days) to maintain knockdown of endogenous UHRF1. Created with BioRender.com (B) Principal components analysis of the top 100 000 most variably methylated CpGs (EPIC array) across all samples and time-points. (C) Heatmaps of the top 100 000 most differentially methylated CpGs (comparison: Day 28 UBL*/RING* versus Day 28 D1i only/D1i + WT cover). CpGs are ranked from highest to lowest DNA methylation for the Day 28 WT cover cells. (D) Average DNA methylation of top 100 000 most differentially methylated high-density CpGs (left) and low-density CpGs (right) from C across all time-points. (E) Average loss of DNA methylation for all highly methylated CpGs (β-value(WTcover_Day0)formula image 0.85) across bins of decreasing CpG density. Dotted line indicates the average Δβ-value as a function of distance. Boundaries indicate 95% confidence intervals. (F) Average loss of DNA methylation for all highly methylated CpGs (β-value(WTcover_Day0)formula image 0.85) across replication timing phases. Dotted line indicates the average Δβ-value as a function of replication timing. Boundaries indicate 95% confidence intervals. (G) Characterization of recovery dynamic categories across UHRF1 transgene cover experiments: (i) Number of significantly hypomethylated CpGs (β-value(WTcover_Day0)formula image 0.85; Δβ-value(Day3-WTcover_Day0)formula image −0.3) that demonstrate indicated recovery dynamics among the UHRF1 cover transgene experiments. (ii) Hypergeometric analysis for enrichment of low-density CpGs across recovery dynamic categories for each UHRF1 transgene cover experiment. (iii) Boxplots of neighboring CpG density (−/+ 100 bp flanking CpG of interest). *pval < 2.2e-16 by one-sided Mann–Whitney U-test. (iv) Boxplots of neighboring methylated CpG density (values derived from shUHRF1 Cl.9 baseline WGBS; −/+ 100 bp flanking CpG of interest). *P-value < 2.2e-16 by one-sided Mann–Whitney U-test. (H) DNA methylation distributions across the time-course for CpGs that recover with UHRF1 WT (left), intermediately recover with UHRF1 WT (middle), or are lost (right). DNA methylation values among the EV and UHRF1 mutant covers for CpGs in the designated UHRF1 WT recovery bins demonstrate which CpGs require UHRF1 for DNA methylation recovery. See also Supplementary Figure S5.
Figure 6.
Figure 6.
DNMT1 ubiquitin recognition is essential for DNA methylation maintenance. (A) Schematic of DNMT1 protein domains and mutations made to the DNMT1 transgene covers. (B) In vitro methyltransferase assays measuring catalytic activity of recombinant full length DNMT1 WT, Catalytic Dead (CatX), and UIM mutants toward free hemi-methylated DNA. (C) In vitro Alpha-screen proximity assays measuring interactions between H3 ubiquitinated nucleosomes (K14ub, K18ub, K23ub) and recombinant DNMT1 RFTS domain WT and UIM mutants. (D) Density plot for CpG probe distribution across DNA methylation levels [β-value: 0 (unmethylated) to 1 (methylated)] for WT and mutant(*) DNMT1 transgene covers. (E) Bar graph of number of hypomethylated CpGs (EPIC array) for each DNMT1 cover (β-valueWT_coverformula image 0.85; Δβ-valuemutant_coversformula image −0.3, −0.4, −0.5). (F) Venn diagram demonstrating overlap of hypomethylated CpGs from DNMT1 cover experiments. (G) Heatmap of DNA methylation (β-value) values for overlapping hypomethylated CpGs from (i) All overlaps and (ii + iii) UIM2, dblUIM, CatX and EV overlaps. (H) Hypergeometric analysis of hypomethylated CpGs from DNMT1 cover experiments. Positive values indicate significant overrepresentation for hypomethylation of the feature and negative values indicate significant underrepresentation. Enrichment bias values are provided for the most significant positive enrichments. See alsoSupplementary Figure S6.

Update of

Similar articles

Cited by

References

    1. Bird A.P. DNA methylation and the frequency of CpG in animal DNA. Nucleic Acids Res. 1980; 8:1499–1504. - PMC - PubMed
    1. Colaneri A., Staffa N., Fargo D.C., Gao Y., Wang T., Peddada S.D., Birnbaumer L.. Expanded methyl-sensitive cut counting reveals hypomethylation as an epigenetic state that highlights functional sequences of the genome. Proc. Natl Acad. Sci. U.S.A. 2011; 108:9715–9720. - PMC - PubMed
    1. Lister R., Pelizzola M., Dowen R.H., Hawkins R.D., Hon G., Tonti-Filippini J., Nery J.R., Lee L., Ye Z., Ngo Q.-M.et al. .. Human DNA methylomes at base resolution show widespread epigenomic differences. Nature. 2009; 462:315–322. - PMC - PubMed
    1. Ziller M.J., Gu H., Müller F., Donaghey J., Tsai L.T.-Y., Kohlbacher O., De Jager P.L., Rosen E.D., Bennett D.A., Bernstein B.E.et al. .. Charting a dynamic DNA methylation landscape of the human genome. Nature. 2013; 500:477–481. - PMC - PubMed
    1. Baylin S.B., Jones P.A.. Epigenetic determinants of cancer. Cold Spring Harb. Perspect. Biol. 2016; 8:a019505. - PMC - PubMed

MeSH terms