. 2025 Jan 6;53(D1):D886-D900.
doi: 10.1093/nar/gkae1142.

CZ CELLxGENE Discover: a single-cell data platform for scalable exploration, analysis and modeling of aggregated data

Affiliations

CZ CELLxGENE Discover: a single-cell data platform for scalable exploration, analysis and modeling of aggregated data

CZI Cell Science Program et al. Nucleic Acids Res. .

Abstract

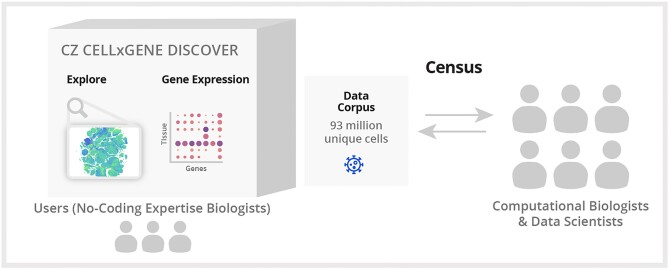
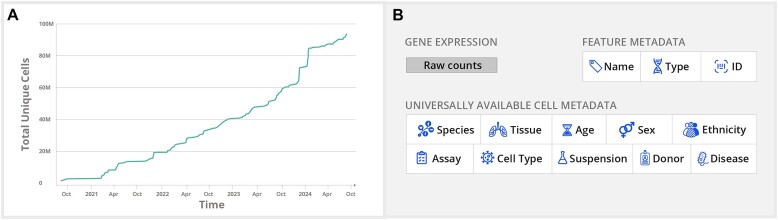
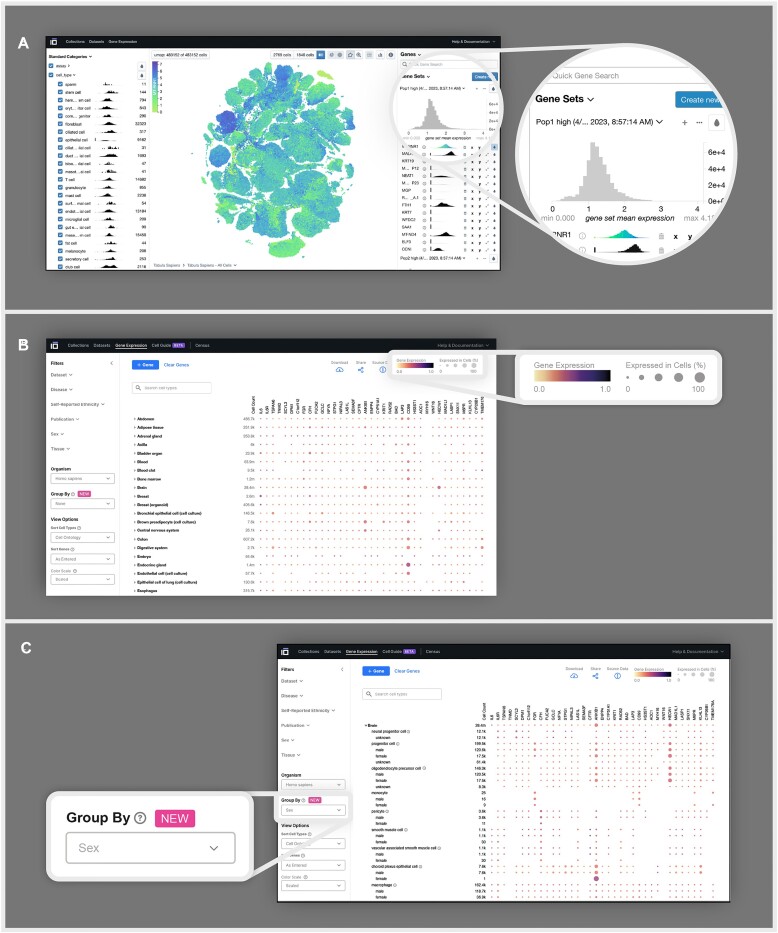
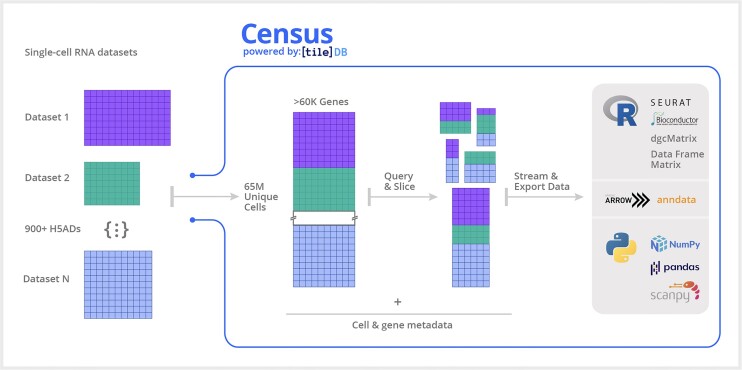
Hundreds of millions of single cells have been analyzed using high-throughput transcriptomic methods. The cumulative knowledge within these datasets provides an exciting opportunity for unlocking insights into health and disease at the level of single cells. Meta-analyses that span diverse datasets building on recent advances in large language models and other machine-learning approaches pose exciting new directions to model and extract insight from single-cell data. Despite the promise of these and emerging analytical tools for analyzing large amounts of data, the sheer number of datasets, data models and accessibility remains a challenge. Here, we present CZ CELLxGENE Discover (cellxgene.cziscience.com), a data platform that provides curated and interoperable single-cell data. Available via a free-to-use online data portal, CZ CELLxGENE hosts a growing corpus of community-contributed data of over 93 million unique cells. Curated, standardized and associated with consistent cell-level metadata, this collection of single-cell transcriptomic data is the largest of its kind and growing rapidly via community contributions. A suite of tools and features enables accessibility and reusability of the data via both computational and visual interfaces to allow researchers to explore individual datasets, perform cross-corpus analysis, and run meta-analyses of tens of millions of cells across studies and tissues at the resolution of single cells.


Figures

Graphical Abstract
Graphical Abstract
Figure 1.
Figure 1.
Description of CZ CELLxGENE schema and data curation efforts. (A) The total number of unique cells available on CZ CELLxGENE now surpasses 93 million cells. (B) All data on CZ CELLxGENE conforms to a standard metadata schema. The schema requires raw counts (e.g. mapped but unnormalized) as part of data submission. Required metadata covers 10 generally available categories that are completed for each sample and cell to increase reusability for downstream analyses. An additional metadata category, not shown in the figure above, is the is_primary_data field. This field is used to mark each observation as ‘primary’ exactly one time throughout the corpus so that cross-corpus aggregations can avoid redundant observations in their analysis.
Figure 2.
Figure 2.
CZ CELLxGENE data corpus across various metadata categories. (A–C) A breakdown of total unique cells in CZ CELLxGENE by suspension type, modality and organisms showing the majority of data available in CZ CELLxGENE is generated from human and mouse tissue using 10X Genomics transcriptomic assays. Data is available across additional modalities (e.g. non-10× transcriptomic assays, spatial transcriptomics, epigenomic and multimodal data types, are supported if they meet the minimal schema requirements) and species (e.g. Macaca mulatta, Pan troglodytes and others) are supported if they meet the minimal schema requirements. (D) A breakdown of the total unique cells across all major organ systems for both mouse and human available in CZ CELLxGENE. (E–G) A summary of human data across self-reported ethnicity, developmental stage and sex.
Figure 3.
Figure 3.
CZ CELLxGENE features Explorer and Gene expression enable interactive analysis of single-cell datasets. (A) A UMAP of all 483 152 cells in the Tabula Sapiens dataset available on Explorer visualized by the expression of MT-RNR1, a gene that encodes for an ribosomal RNA responsible for regulating insulin sensitivity and metabolic homeostasis (36). UMAPs can be visualized based on metadata categories, including cell type and other metadata categories, or by the expression of one or multiple genes, as shown above. (B) A heatmap generated using Gene Expression visualizing the mean gene expression of specific genes across and within all tissues and cell types present in the data corpus, where the quantity of cells used for calculating the mean gene expression is indicated in the leftmost column of the heatmap under ‘cell count.’ The gene expression is displayed using two visual elements: color, representing the mean gene expression and size, signifying the proportion of cells in each cell type or tissue expressing the respective gene. (C) A heatmap generated using the Group By feature demonstrates the variation in gene expression among different cell types according to sex. Group By allows researchers to group mean gene expression values by specific metadata values, including, sex, disease and ethnicity.
Figure 4.
Figure 4.
ANOVA on average normalized gene expression values. Results for one-way repeated measures ANOVA scores conducted on marker and housekeeping genes in five different cell types. Results show that for most cell types, we do not have sufficient evidence to say that there is a statistically significant difference between the average normalized gene expression values among covariate values [9/10 and 6/10 P values for ln (CPM + 1) for dataset_id and assay Pval = 0.05, aggregated over marker and housekeeping genes].
Figure 5.
Figure 5.
Recall of marker genes: comparison between raw counts, quantile normalization and log transform normalization. Each point represents the sensitivity of marker gene recall for a specific cell type and tissue, as compared to canonical marker genes from HuBMAP.
Figure 6.
Figure 6.
Overview of Census framework. Census is built upon the TileDB-SOMA framework to enable computational scientists to execute complex and specific queries across over 65 million cell measurements compiled from 900+ datasets spanning human and mouse organs available in CZ CELLxGENE using Census. Leveraging out-of-core processing, SOMA provides the API and data model to facilitate the storage, retrieval and analysis of datasets exceeding memory capacity. The standardized schema required by the data portal enables users to effortlessly query and export any segment of the extensive 65+ million cell dataset for in-depth analysis using Python and R.

Similar articles

Cited by

References

    1. Lane N. The unseen world: reflections on Leeuwenhoek (1677) ‘Concerning little animals’. Phil. Trans. R. Soc. B. 2015; 370:20140344. - PMC - PubMed
    1. Regev A., Teichmann S.A., Lander E.S., Amit I., Benoist C., Birney E., Bodenmiller B., Campbell P., Carninci P., Clatworthy M.et al. .. The Human Cell Atlas. Elife. 2017; 6:e27041. - PMC - PubMed
    1. HuBMAP Consortium The human body at cellular resolution: the NIH Human Biomolecular Atlas Program. Nature. 2019; 574:187–192. - PMC - PubMed
    1. Li H., Janssens J., De Waegeneer M., Kolluru S.S., Davie K., Gardeux V., Saelens W., David F.P.A., Brbić M., Spanier K.et al. .. Fly Cell Atlas: a single-nucleus transcriptomic atlas of the adult fruit fly. Science. 2022; 375:eabk2432. - PMC - PubMed
    1. The Tabula Sapiens Consortium Jones R.C., Karkanias J., Krasnow M.A., Pisco A.O., Quake S.R., Salzman J., Yosef N., Bulthaup B., Brown P.et al. .. The Tabula Sapiens: a multiple-organ, single-cell transcriptomic atlas of humans. Science. 2022; 376:eabl4896. - PMC - PubMed

LinkOut - more resources