. 2024 Nov 28:13:RP100433.
doi: 10.7554/eLife.100433.

Telomerase RNA component knockout exacerbates Staphylococcus aureus pneumonia by extensive inflammation and dysfunction of T cells

Affiliations

Telomerase RNA component knockout exacerbates Staphylococcus aureus pneumonia by extensive inflammation and dysfunction of T cells

Yasmina Reisser et al. Elife. .

Abstract

The telomerase RNA component (Terc) constitutes a non-coding RNA critical for telomerase function, commonly associated with aging and pivotal in immunomodulation during inflammation. Our study unveils heightened susceptibility to pneumonia caused by Staphylococcus aureus (S. aureus) in Terc knockout (Tercko/ko) mice compared to both young and old infected counterparts. The exacerbated infection in Tercko/ko mice correlates with heightened inflammation, manifested by elevated interleukin-1β (IL-1β) levels and activation of the NLR family pyrin domain containing 3 (NLRP3) inflammasome within the lung. Employing mRNA sequencing methods alongside in vitro analysis of alveolar macrophages (AMs) and T cells, our study elucidates a compelling correlation between Tercko/ko, inflammation, and impaired T cell functionality. Terc deletion results in compromised T cell function, characterized by dysregulation of the T cell receptor and absence of CD247, potentially compromising the host's capacity to mount an effective immune response against S. aureus. This investigation provides insights into the intricate mechanisms governing increased vulnerability to severe pneumonia in the context of Terc deficiency, which might also contribute to aging-related pathologies, while also highlighting the influence of Terc on T cell function.

Keywords: Staphylococcus aureus; T cells; Terc; aging; infectious disease; inflammation; microbiology; mouse; pneumonia.


Conflict of interest statement

YR, FH, AH, TL, SN, BL, SD No competing interests declared

Figures

Figure 1.
Figure 1.. Tercko/ko mice exhibit more severe pneumonia with increased mortality and a higher bacterial load.
(A) Clinical score of non-infected and infected young wild-type (WT) (n=10, 5 non-infected and 5 infected), old WT (n=10, 5 non-infected and 5 infected), and Tercko/ko (n=8, 3 non-infected and 5 infected) mice at 24 hr post infection (hpi). The age and genetic background of the different groups is depicted below. (B) Bacterial load of the lungs of infected mice at 24 hpi. Data is displayed as logarithmic. (C) Relative body weight of young WT, old WT, and Tercko/ko mice. Relative body weight displays body weight at 24 hpi as a percentage of the body weight at the time of infection. (D) Relative lung weight of young WT, old WT, and Tercko/ko mice. Relative lung weight displays lung weight at 24 hpi as a percentage of the current body weight. (E) Immunofluorescence staining of lung tissue of infected young (WT 8 weeks), old (WT 2 years), and Tercko/ko mice. Lungs were stained for S. aureus (green), actin (red), and DAPI (blue). Representative pictures are shown for each group. *p<0.05, **p<0.01, ***p<0.001. p-Values calculated by Kruskal-Wallis test (A–D). Data is displayed as violin plot showing the median as well as lower and upper percentile of each dataset. Each replicate is displayed as a data point. Created with BioRender.com.
Figure 1—figure supplement 1.
Figure 1—figure supplement 1.. Tercko/ko mice with systemic infection display more severe pneumonia with bacteremia and increased mortality.
(A) Clinical score of infected Tercko/ko mice at the time of infection (0 dpi) and 24 hr post infection (hpi) (1 dpi). The mice were divided into three groups according to their clinical score values: mice with mild infection (dark blue dots; n=1), mice with systemic infection (light blue dots; n=2), and mice where infection resulted in a fatal outcome (black dots; n=2). Mice with systemic infection were defined as mice with an increased clinical score and the presence of bacteria in organs other the lung. (B) Bacterial load in kidney and liver tissue of the infected Tercko/ko mice 24 hpi (each n=3). Light blue data points represent mice with systemic infection, while dark blue dots represent the mouse with mild infection. (C) Bacterial load of the lung of infected mice at 24 hpi. Young wild-type (WT) and old WT mice: n=5; Tercko/ko mice with systemic infection: n=2, Tercko/ko mice without systemic infection: n=1. Data is displayed as logarithmic. (D) Relative body weight of young WT (each n=5), old WT (each n=5), and Tercko/ko mice (non-infected: n=3; with systemic infection: n=2; without systemic infection: n=1). Relative body weight displays body weight at 24 hpi as a percentage of the body weight at the time of infection. (E) Relative lung weight of young WT (each n=5), old WT (each n=5), and Tercko/ko mice (non-infected: n=3; with systemic infection: n=2; without systemic infection: n=1). Relative lung weight displays lung weight after 24 hpi as a percentage of the current body weight. (F) Measurement of average telomere length per chromosome end in lungs of young WT (n=4), old WT (n=4), and Tercko/ko mice (n=4). (G) Principal component analysis (PCA) of sequenced lungs from non-infected and infected young WT (each n=3), old WT (each n=3), and Tercko/ko mice (each n=3). The mice with systemic infection clustered separately from the other samples. Nevertheless, the infected Tercko/ko mice were considered one group for the expression analysis and not split into separate groups for the subsequent analysis. (H) Number of differentially expressed genes (DEGs) per comparison including up- and downregulated DEGs as well as the total count. Differential gene expression analysis was conducted using the DESeq2 software as well as negative binomial distribution. For false discovery rate (FDR) calculation the Benjamini-Hochberg procedure was used. Sequencing data displays mRNA sequencing data of non-infected and infected lungs of the three different mice cohorts at 24 hpi. For each mouse cohort three biological replicates were sequenced and used for analysis. Infected Tercko/ko mice were divided into systemic and non-systemic infected mice for several analyses (C, D, and E). Data is displayed as violin plot showing the median as well as lower and upper percentile of each dataset. *p<0.05. p-Values calculated by Kruskal-Wallis test (C–E). Each replicate is displayed as a data point.
Figure 2.
Figure 2.. Lungs of Tercko/ko mice display excessive inflammation and NLRP3 inflammasome activation.
(A) Pro-inflammatory cytokines measured in lung homogenates of non-infected and infected young wild-type (WT) (each n=3), old WT (each n=5), and Tercko/ko mice (non-infected: n=3, with systemic infection: n=2, and without systemic infection: n=1). Infected Tercko/ko mice were grouped into mice with systemic and without systemic infection. Cytokines were measured using a flow cytometry-based LEGENDPlex mouse inflammation panel. Data is displayed on a logarithmic scale. (B) Heatmap of overall gene expression in the lungs of the different mice cohorts at 24 hr post infection (hpi). Gene expression is displayed as the log2 of the fragments per kilobase of transcript per million fragments mapped (fpkm) of each individual gene. Gene expression is normalized to sequencing depth and transcript length. Red indicates upregulation, and green indicates downregulation of the gene expression. The respective mouse groups are visualized above the heatmap. For each mouse cohort three biological replicates were sequenced. (C) Heatmap of differentially expressed genes (DEGs) belonging to the NLRP3 inflammasome pathway. Red indicates upregulation, and blue indicates downregulation of the gene. Differential gene expression analysis was conducted using the DESeq2 software as well as negative binomial distribution. For false discovery rate (FDR) calculation the Benjamini-Hochberg procedure was used. Heatmaps were constructed using RStudio. Only significant DEGs (p-value<0.05) were displayed in the heatmap. Non-significant genes were set to zero and are shown as white. DEGs are displayed as log2fold-change. For each group three biological replicates were sequenced and used for analysis. For clarity, the heatmap has been split in half, and no column clustering has been performed. The respective groups used for the comparison are indicated below each column. (D) KEGG pathway enrichment analysis comparing infected young and Tercko/ko mice at 24 hpi. The gene ratio describes the ratio of differentially expressed genes to all genes of the respective pathway. The dot plot was constructed using RStudio. All sequencing data displays mRNA sequencing data of non-infected and infected lungs of the three different mice cohorts at 24 hpi. ns≥0.05, *p<0.05, **p<0.01, ***p<0.001, ****p<0.0001. p-Values calculated by Kruskal-Wallis test (A). Data is presented as mean ± SD. Each replicate is displayed as a data point.
Figure 2—figure supplement 1.
Figure 2—figure supplement 1.. Several pathways relevant for inflammation and adaptive and innate immune response are differentially expressed in infected Tercko/ko mice.
Heatmaps of differentially expressed genes (DEGs) related to the NLRP3 inflammasome pathway (A), macrophage marker (C), chemokine signaling pathway (D), T helper cell marker (E), or T cell receptor (TCR) signaling (F). Red indicates upregulation, and blue indicates downregulation of the gene. Differential gene expression analysis was conducted using the DESeq2 software as well as negative binomial distribution. For false discovery rate (FDR) calculation the Benjamini-Hochberg procedure was used. Heatmaps were constructed using RStudio. Only significant DEGs (p-value<0.05) were displayed in the heatmap. Non-significant genes were set to zero and are shown as white. DEGs are displayed as log2fold-change. For each mouse cohort three biological replicates were sequenced and used for analysis. The respective groups used for the comparison are indicated below each column. All comparisons are shown. All heatmaps display mRNA sequencing data of non-infected and infected lungs of the three different mice cohorts at 24 hr post infection (hpi). (B) Immunofluorescence staining of CD68 (red), actin (purple), and DAPI (blue) of alveolar macrophages (AMs) isolated from Tercko/ko and young wild-type (WT) mice. Representative pictures are shown for each group.
Figure 3.
Figure 3.. Elevated expression of pro-inflammatory M1 macrophages markers and chemokines are present in the lungs of infected Tercko/ko mice.
(A) Colorized scanning electron microscopy (SEM) picture of an alveolar macrophage (AM) isolated from young wild-type (WT) mice phagocytosing S. aureus. Heatmap of differentially expressed macrophage markers (B) and differentially expressed genes (DEGs) belonging to the chemokine signaling pathway (C). Red indicates upregulation, and blue indicates downregulation of the gene. Differential gene expression analysis was conducted using the DESeq2 software as well as negative binomial distribution. For false discovery rate (FDR) calculation the Benjamini-Hochberg procedure was used. Heatmaps were constructed using RStudio. Only significant DEGs (p-value<0.05) were displayed in the heatmap. Non-significant genes were set to zero and are shown as white. DEGs are displayed as log2fold-change. For each group three biological replicates were sequenced and used for analysis. The respective groups used for the comparison are indicated below each column. All heatmaps display mRNA sequencing data of non-infected and infected lungs of the three different mice cohorts at 24 hr post infection (hpi).
Figure 4.
Figure 4.. T cell receptor (TCR) in infected Tercko/ko mice is partially downregulated.
Heatmap of differentially expressed T helper cell markers (A) and differentially expressed genes (DEGs) belonging to the TCR signaling pathway (C). Red indicates upregulation, and blue indicates downregulation of the gene. Differential gene expression analysis was conducted using the DESeq2 software as well as negative binomial distribution. For false discovery rate (FDR) calculation the Benjamini-Hochberg procedure was used. Heatmaps were constructed using RStudio. Only significant DEGs (p-value<0.05) were displayed in the heatmap. Non-significant genes were set to zero and are shown as white. DEGs are displayed as log2fold-change. For each mouse cohort three biological replicates were sequenced and used for analysis. The respective groups used for the comparison are indicated below each column. All heatmaps display mRNA sequencing data of non-infected and infected lungs of the three different mice cohorts at 24 hr post infection (hpi). (B) Percentage of CD3+-living cells in non-infected young WT (n=3), old WT (n=3), and Tercko/ko mice (n=5) spleen. Cells were analyzed with flow cytometry. Gene expression levels in fragments per kilobase of transcript per million fragments mapped (fpkm) of CD247 (D), PDCD1 (E), and CD4 (F) in the lungs of non-infected and infected young WT (n=3), old WT (n=3), and Tercko/ko mice (n=3) at 24 hpi. ns≥0.05, *p<0.05, **p<0.01. p-Values calculated by Kruskal-Wallis test (B, D–F). Data is displayed as violin or box plot showing the median as well as lower and upper percentile of each dataset. Each replicate is displayed as a data point.
Figure 4—figure supplement 1.
Figure 4—figure supplement 1.. Frequency of different immune cell populations in the spleen of young and old WT as well as Tercko/ko mice.
(A) Exemplary gating strategy for the immunophenotyping of cells from murine spleen. First, lymphocytes were selected, then duplicates and dead cells were excluded (APC-Cy7 negative). To avoid autofluorescence of macrophages, the F4/80 negative population was selected. For further calculations of T cell frequencies the CD3+ CD19- cell population was used. Other immune cell populations were selected by the indicated marker. For calculation of macrophage frequencies the F4/80 positive population was selected. (B) Percentage of Ly-6G+-living cells in the spleen of non-infected young wild-type (WT) (n=3), old WT (n=3), and Tercko/ko mice (n=5). Cells were analyzed with flow cytometry. (C) Percentage of CD19+-living cells in the spleen of non-infected young WT (n=3), old WT (n=3), and Tercko/ko mice (n=5). Cells were analyzed with flow cytometry. (D) Percentage of CD335+-living cells in the spleen of non-infected young WT (n=3), old WT (n=3), and Tercko/ko mice (n=5). Cells were analyzed with flow cytometry. (E) Percentage of F4/80+-living cells in the spleen of non-infected young WT (n=3), old WT (n=3), and Tercko/ko mice (n=5). Cells were analyzed with flow cytometry. (F) Percentage of CD11c+-living cells in the spleen of non-infected young WT (n=3), old WT (n=3), and Tercko/ko mice (n=5). Cells were analyzed with flow cytometry. ns≥0.05, *p<0.05, **p<0.01. p-Values calculated by Kruskal-Wallis test (B–F). Data is displayed as violin plot showing the median as well as lower and upper percentile of each dataset. Each replicate is displayed as a data point.
Figure 5.
Figure 5.. T cells of Tercko/ko mice do not adequately react to bacterial challenge.
(A) Schematic representation of experiment. Murine T cells and alveolar macrophages (AMs) were isolated, co-cultured, and stimulated with heat-killed S. aureus with a multiplicity of infection 5 (MOI5) for 24 hr. (B) Colorized scanning electron microscopy (SEM) picture of the experimental setup. An AM close to a T cell is shown. (C) Immunofluorescence staining of infected and non-infected AMs from young wild-type (WT) and Tercko/ko mice. AMs were stained with antibodies for S. aureus (red), actin (purple), and DAPI (blue). (D) CD247 expression measured with flow cytometry of non-infected and infected T cells (left) and co-cultured T cells and AMs (right) of young WT (each n=3) and Tercko/ko mice (each n=3) after 24 hr post infection (hpi). CD247 expression is displayed as geometric mean fluorescence intensity (gMFI). (E) Interleukin-1α (IL-1α) from supernatants of T cells (left) and co-cultured T cells and AMs (right) of young WT (each n=3) and Tercko/ko mice (each n=3) at 2 and 24 hpi. IL-1α levels were measured using a flow cytometry-based LEGENDPlex mouse T helper cytokine panel. ns≥0.05, *p<0.05. p-Values calculated by Kruskal-Wallis test (D, E). Data is displayed as violin plot showing the median as well as lower and upper percentile of each dataset. Each replicate is displayed as a data point. Created with BioRender.com.
Figure 5—figure supplement 1.
Figure 5—figure supplement 1.. Altered immune response to infection of Tercko/ko mice relative to control cohorts.
(A) KEGG pathway enrichment analysis comparing infected Tercko/ko vs. infected old wild-type (WT), infected young WT vs. non-infected young WT, and infected Tercko/ko vs. non-infected Tercko/ko mice. The gene ratio describes the ratio of differentially expressed genes to all genes of the respective pathway. The dot plots were constructed using RStudio. (B) Gating strategy for T cells isolated from murine spleen to asses CD247 expression. First, lymphocytes were selected, duplicates and dead cells were excluded before selecting CD3+ CD247+ cells. This population was used for further calculations. (C) CD44 expression measured with flow cytometry of non-infected and infected T cells (left) and co-cultured T cells and alveolar macrophages (AMs) (right) of young WT (each n=3) and Tercko/ko mice (each n=3) after 24 hr post infection (hpi). CD44 expression is displayed as geometric mean fluorescence intensity (gMFI). (D) Heatmap of differentially regulated myeloid suppressor cell (MSC) markers. Red indicates upregulation, and blue indicates downregulation of the gene. Differential gene expression analysis was conducted using the DESeq2 software as well as negative binomial distribution. For false discovery rate (FDR) calculation the Benjamini-Hochberg procedure was used. Heatmaps were constructed using RStudio. Only significant differentially expressed genes (DEGs) (p-value<0.05) were displayed in the heatmap. Non-significant genes were set to zero and are shown as white. DEGs are displayed as log2fold-change. For each mouse cohort three biological replicates were sequenced and used for analysis. The respective groups used for the comparison are indicated below each column. All heatmaps display mRNA sequencing data of non-infected and infected lungs of the three different mice cohorts at 24 hpi. ns≥0.05. p-Values calculated by Kruskal-Wallis test (C). Data is displayed as violin plot showing the median as well as lower and upper percentile of each dataset. Each replicate is displayed as a data point.
Figure 6.
Figure 6.. Graphical summary.
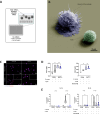
Loss of Terc leads to an exaggerated inflammatory response and inflammasome activation upon S. aureus infection. This overactive inflammation disrupts T cell function, thereby impairing the immune response. Consequently, Tercko/ko mice show a significantly higher bacterial load and increased mortality following infection. Created with BioRender.com.
Figure 6—figure supplement 1.
Figure 6—figure supplement 1.. Overview of the methods used in this publication.
Created with BioRender.com.

Update of

  • doi: 10.1101/2024.06.19.599722
  • doi: 10.7554/eLife.100433.1
  • doi: 10.7554/eLife.100433.2

References

    1. Baniyash M. TCR zeta-chain downregulation: curtailing an excessive inflammatory immune response. Nature Reviews Immunology. 2004;4:675–687. doi: 10.1038/nri1434. - DOI - PubMed
    1. Birch J, Barnes PJ, Passos JF. Mitochondria, telomeres and cell senescence: implications for lung ageing and disease. Pharmacology & Therapeutics. 2018;183:34–49. doi: 10.1016/j.pharmthera.2017.10.005. - DOI - PubMed
    1. Boe DM, Boule LA, Kovacs EJ. Innate immune responses in the ageing lung. Clinical and Experimental Immunology. 2017;187:16–25. doi: 10.1111/cei.12881. - DOI - PMC - PubMed
    1. Bronstein-Sitton N, Cohen-Daniel L, Vaknin I, Ezernitchi AV, Leshem B, Halabi A, Houri-Hadad Y, Greenbaum E, Zakay-Rones Z, Shapira L, Baniyash M. Sustained exposure to bacterial antigen induces interferon-gamma-dependent T cell receptor zeta down-regulation and impaired T cell function. Nature Immunology. 2003;4:957–964. doi: 10.1038/ni975. - DOI - PubMed
    1. Canan CH, Gokhale NS, Carruthers B, Lafuse WP, Schlesinger LS, Torrelles JB, Turner J. Characterization of lung inflammation and its impact on macrophage function in aging. Journal of Leukocyte Biology. 2014;96:473–480. doi: 10.1189/jlb.4A0214-093RR. - DOI - PMC - PubMed

MeSH terms

LinkOut - more resources