. 2025 Jan:59:101086.
doi: 10.1016/j.neo.2024.101086. Epub 2024 Nov 27.

5-Aza-2'-deoxycytidin (Decitabine) increases cancer-testis antigen expression in head and neck squamous cell carcinoma and modifies immune checkpoint expression, especially in CD39-positive CD8 and CD4 T cells

Affiliations

5-Aza-2'-deoxycytidin (Decitabine) increases cancer-testis antigen expression in head and neck squamous cell carcinoma and modifies immune checkpoint expression, especially in CD39-positive CD8 and CD4 T cells

Adrian Fehn et al. Neoplasia. 2025 Jan.

Abstract

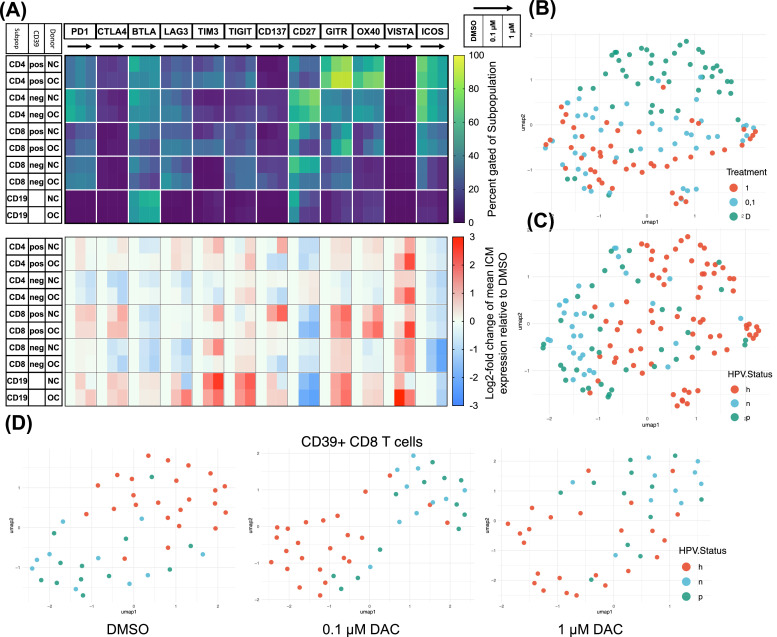
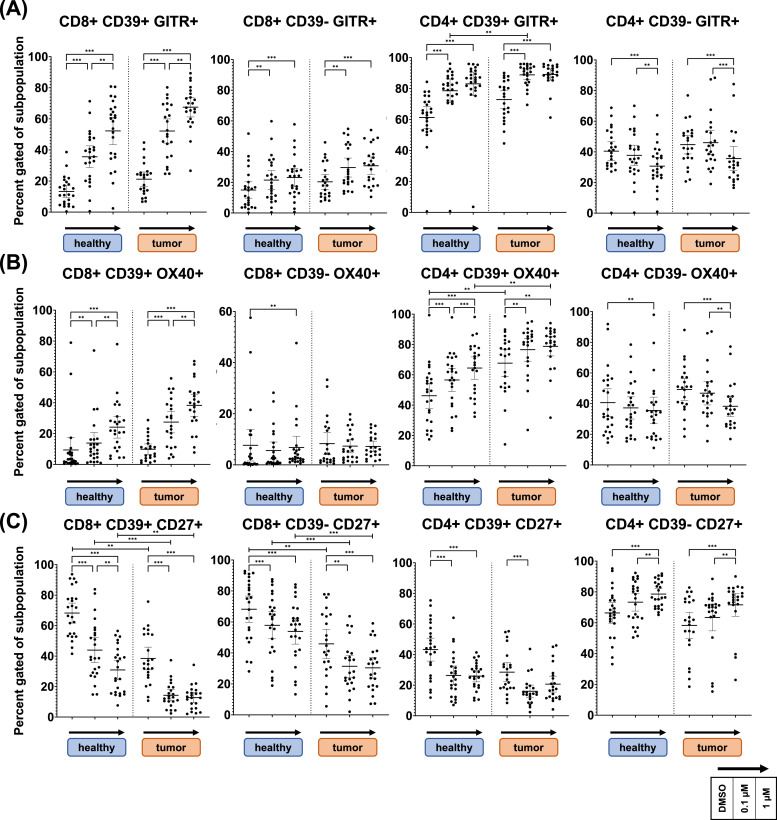
Failure of immunotherapy in head and neck squamous cell carcinoma (HNSCC) patients represents an unmet need to augment leverage of adaptive immunity. Immunogenic cancer-testis antigen (CTA) expression as well as lymphocyte differentiation and function are regulated by DNA methylation. Therefore, epigenetic therapy via inhibition of DNA-Methyltransferases by 5-Aza-2'-deoxycytidine (DAC) serves a promising adjuvant in immunotherapy. We investigated the effects of DAC on CTA expression and proliferative capacity in HNSCC cell lines and on the expression of 12 immune checkpoint molecules (ICM) on lymphocytes of oropharyngeal squamous cell carcinoma (OPSCC) patients and healthy donors. In all cell lines CTA were upregulated accompanied by decreased proliferation. In lymphocytes pronounced alterations of the ICM repertoire were observed, influenced by donor type and subpopulation. On CD39+ CD4 and CD8 T cells, the expression of co-stimulatory ICM GITR and OX40 increased dose dependently, whereas expression decreased on CD39- CD4 T cells. PD1 expression increased primarily on CD39+ CD8 T cells and decreased on CD39- CD4 T cells. CD27 expression decreased primarily in CD8 T cells, but increased in CD39- CD4 T cells, whereas ICOS expression was lowered in both CD39+ and CD39- subsets of CD4 as well as CD8 T cells. DAC treatment increased immunogenicity and decreased proliferation in HNSCC cells while enhancing expression of co-stimulatory ICM GITR and OX40. We propose low dose DAC treatment as a adjuvant to immunotherapy.

Keywords: Cancer Testis Antigens; DNA-Methylation; Decitabine; HPV; Immune-Checkpoint-Molecules; OPSCC.


Conflict of interest statement

Declaration of competing interest The authors declare the following financial interests/personal relationships which may be considered as potential competing interests: Simon Laban: Advisory Boards: Merck Sharp & Dohme (MSD), Bristol Myers Squibb (BMS), Sanofi Genzyme, Astra Zeneca (AZ). Honoraria: MSD, BMS. Travel reimbursement: Merck Serono, Astra Zeneca. Thomas K Hoffmann: Advisory Boards: Merck Sharp & Dohme (MSD), Bristol Myers Squibb (BMS), Sanofi Genzyme.

Figures

Image, graphical abstract
Graphical abstract
Fig 1:
Fig. 1
DAC Treatment of HNSCC Cell lines. Six HNSCC cell lines were treated during culture on days 1 and 3 following reseeding with 1µM DAC and DMSO as control. UD-SCC-1, UD-SCC-4 and UD-SCC-5 are derived from HPV- OPSCC while UD-SCC-2, UM-SCC-47 and UPCI-SCC-90 are derived from HPV+ OPSCC. DAC treated samples are depicted in red and the DMSO controls in green. (A) Proliferative capability following reseeding on day 6 of treatment was shown to be severely impaired in all cell lines. Except for UPCI-SCC-90 all control samples started regrowing after 96 hours. Three independent experiments with duplicates were performed. Mann-Whitney-U test was used for comparison. p-values < 0.05 were considered significant. (B) Impact of DAC on metabolic activity of cancer cells was evaluated in an MTT Assay. Metabolic activity of all treated cell lines was reduced significantly. Three independent experiments were conducted with six replicates each. Mann-Whitney-U test was used for comparison. Error bars represent SD, p-values < 0.05 were considered significant. (C) To verify the proposed demethylation effect, we assessed promotor methylation of three cancer testis antigens by Bisulfite-Pyrosequencing. Except for UD-SCC-4, in every cell line, significant promotor demethylation was observed. Three independent experiments with triplicates were performed. Mann-Whitney-U test was used for comparison. p-values < 0.05 were considered significant. (D) To evaluate the transcriptional impact of demethylation we conducted qRT-PCR of the corresponding CTAs. For every significantly demethylated promotor sequence, we observed significantly upregulated transcription. Three independent experiments with triplicates were performed. Mann-Whitney-U test was used for comparison. p-values < 0.05 were considered significant.
Fig 2
Fig. 2
Proliferation, Viability, and fractions of subpopulations after six-day cultivation. Donor lymphocytes were cultivated in vitro for 6 days with decitabine (Dacogen) treatment at 0,1µM and 1µM and DMSO as control. (A) After cultivation the number and viability of the donor lymphocytes were measured by automated trypan blue cell counting. The individual values for healthy donors and tumor patients are depicted as black dots or circles, respectively, in scatter plots. DAC treatment resulted in significant reduction of viability and cell number. In OPSCC samples we observed significantly reduced cell numbers in DMSO and reduced viability after 1µM DAC treatment. (B) A CFSE assay was conducted on four normal control (NC) samples. The Division Indices (DI) were calculated based on the decrease in fluorescence intensity. A two-sided, paired t-test was used to evaluate the differences in the DI between unstimulated and 1 µM DAC treated, CD3CD28 stimulated samples in the CD39- fraction, which represents population with the lowest proliferation. Compared to unstimulated samples, all subfractions in all stimulated treatment regimens achieved significant proliferation, with ** = p<0.01, *=p<0.05(C) Bar plots illustrate results of an AnnexinV/7AAD apoptosis assay of ten cultivated samples. Percentages of viable, early apoptotic, late apoptotic, and necrotic cells are stacked. The differences in the viable fraction were tested using Friedemann tests and corrected for multiple testing. Treatment with 1 µM DAC, but not 0.1 µM DAC, resulted in significantly reduced viability in all subfractions except CD19+CD39- cells, which had distinctly low viability. No significant difference in viability was observed in CD4+ and CD8+ cells based on CD39 status. (D) ICM expression was measured on different subsets via flow cytometry. We observed significant decrease of CD8+ but not CD4+ cells. DAC treatment had significant impact on the fraction of CD39 positive cells in both subpopulations. Lines are drawn at mean with whiskers spanning the 95 % confidence interval. Statistical analysis for treatment effects in NC and OPSCC lymphocytes were performed using a Friedemann test, analysis for difference between NC and OPSCC lymphocytes in each treatment group was performed with Kruskall Wallis test. The two-stage linear step-up procedure of Benjamini, Krieger and Yekutieli was used for correction of multiple testing (Q = 0.01). Significant results are marked with asterisks ****=p<0.0001 *** = p<0.001 ** = p<0.01.
Fig 3:
Fig. 3
Treatment effect on ICM expression and differences in donor type. Donor lymphocytes were cultivated in vitro for 6 days with decitabine (Dacogen) treatment at 0,1µM and 1µM and DMSO as control. Subsequently cells were assessed flow cytometrically for expression of twelve ICMs on five subpopulations. (A) The shown heatmaps display mean gated-positive percentage at the top and log-2-fold change relative to DMSO control at the lower panel. Each checkpoint is displayed with the treatment groups sorted from left to right, starting at DMSO, indicated by the black arrow. The five covered subpopulations are subdivided by donor type into NC (h) and OPSCC (t). We observed manifold expression changes upon DAC treatment, most prominently, increased expression of GITR and OX40 in CD39+ T-cells. ICOS and CD27 expression was significantly decreased in all subpopulations, except for CD27 in CD4+CD39- cells. (B) UMAP of all samples based on expression values of all ICMs in all subpopulations is shown. Donor type is depicted as color code with “h” resembling healthy, “p” HPV-positive and “n” HPV-negative. Treatment groups are labeled with “D” for DMSO, “0,1″ for 0.1µM and “1″ for 1µM decitabine (Dacogen) treatment. We observed clear treatment-dependent embedding with a gradual dose dependence. (Hyperparameters: spread 0.8, n_epochs: 1000, min_dist: 0.1, n_neighbors: 15) (C) The same UMAP highlights distinct clustering dependent on donor type with HPV negative samples being mapped more closely, indicating a more homogeneous sample collective. (D) Three treatment-wise UMAPs of the CD39+ CD8 T cell subpopulation reveal similar mapping patterns dependent on donor type with HPV positive samples tending to be more intertwined with healthy donor samples. While HPV negative samples were embedded more closely. (Hyperparameters: Spread 1, n_epochs: 1000, min_dist: 0.1, n_neighbors: 13).
Fig 4:
Fig. 4
GITR, OX40 and CD27 expression changes, influence of CD39 and donor type. Donor lymphocytes were cultivated in vitro for 6 days with decitabine (Dacogen) treatment at 0,1µM and 1µM and DMSO as control. Subsequently cells were assessed flow cytometrically for expression of twelve ICMs. Fig. 4 shows expression of co-stimulatory ICMs GITR, OX40 and CD27 in CD4 and CD8 T cells. As shown on panel A, GITR shows higher expression in CD4+ cells and significantly higher expression in OPSCC derived CD39+ CD4 T cells. Except for CD39- CD4 T cells, GITR significantly increased in all subpopulations. The same pattern was observed for OX40 except for CD39- CD8 T cells, showing only marginal alteration in expression. Shown in panel B. Conversely, CD8 T cells of OPSCC patients, expression of CD27 was significantly lower expressed, as seen in panel C. This difference was maintained in all treatment groups. In addition, DAC treatment resulted in significant decrease of CD27 expression in all subsets, only opposed by CD4+CD39- cells with a significant increase. Lines are drawn at mean with whiskers spanning the 95 % confidence interval. Statistical analysis for treatment effects in NC and OPSCC lymphocytes were performed using a Friedemann test, analysis for difference between NC and OPSCC lymphocytes in each treatment group was performed with Kruskall Wallis test. The two-stage linear step-up procedure of Benjamini, Krieger and Yekutieli was used for correction of multiple testing (Q = 0.01). Significant results are marked with asterisks ****=p<0.0001 *** = p<0.001 ** = p<0.01.
Fig 5:
Fig. 5
ICOS, TIM3 and PD1 expression changes, influence of CD39 and donor type. Donor lymphocytes were cultivated in vitro for 6 days with decitabine (Dacogen) treatment at 0,1µM and 1µM and DMSO as control. Subsequently cells were assessed flow cytometrically for expression of twelve ICMs. Fig. 6 shows expression of co-stimulatory ICM ICOS as well as co-inhibitory ICMs TIM3 and PD1 in CD4 and CD8 T cells. Panel A shows, that ICOS was globally expressed higher in CD4 than in CD8 T cells and significantly decreased in response to DAC treatment in all subpopulations. Interestingly, baseline TIM3 expression was significantly higher in all subpopulations of OPSCC derived samples, as shown in panel B. In CD39+ CD4 and CD8 T cells, TIM3 expression significantly increased in NC samples, to reach OPSCC expression levels at 1µM DAC. Contrary, elevated expression in CD39- CD4 T cells of OPSCC patients significantly decreased to reach NC levels. Panel C shows expression percentage of PD1. Its expression was significantly increased in CD39+ CD8 T cells. Opposingly, PD1 expression was significantly reduced in CD39- CD4 T cells. In CD39+ CD4 T cells an inverse u shaped response was observed. Lines are drawn at mean with whiskers spanning the 95 % confidence interval. Statistical analysis for treatment effects in NC and OPSCC lymphocytes were performed using a Friedemann test, analysis for difference between NC and OPSCC lymphocytes in each treatment group was performed with Kruskall Wallis test. The two-stage linear step-up procedure of Benjamini, Krieger and Yekutieli was used for correction of multiple testing (Q = 0.01). Significant results are marked with asterisks ****=p<0.0001 *** = p<0.001 ** = p<0.01.

References

    1. Burtness B., et al. Pembrolizumab alone or with chemotherapy versus cetuximab with chemotherapy for recurrent or metastatic squamous cell carcinoma of the head and neck (KEYNOTE-048): a randomised, open-label, phase 3 study. Lancet. 2019;394:1915–1928. - PubMed
    1. Argiris A., et al. LBA36 Nivolumab (N) + ipilimumab (I) vs EXTREME as first-line (1L) treatment (tx) for recurrent/metastatic squamous cell carcinoma of the head and neck (R/M SCCHN): Final results of CheckMate 651. Ann. Oncol. 2021;32:S1310–S1311.
    1. Lee P.P., et al. A Critical Role for Dnmt1 and DNA Methylation in T Cell Development, Function, and Survival. Immunity. 2001;15:763–774. - PubMed
    1. Hanahan D. Hallmarks of Cancer: New Dimensions. Cancer Discov. 2022;12:31–46. - PubMed
    1. Lübbert M., et al. Low-dose decitabine versus best supportive care in elderly patients with intermediate- or high-risk myelodysplastic syndrome (MDS) ineligible for intensive chemotherapy: final results of the randomized phase III study of the European Organisation for Research and Treatment of Cancer Leukemia Group and the German MDS Study Group. J. Clin. Oncol. 2011;29:1987–1996. - PubMed

Publication types

MeSH terms