. 2025 Mar 12;5(1):100187.
doi: 10.1016/j.bpr.2024.100187. Epub 2024 Nov 27.

CD spectra reveal the state of G-quadruplexes and i-motifs in repeated and other DNA sequences

Affiliations

CD spectra reveal the state of G-quadruplexes and i-motifs in repeated and other DNA sequences

Levi Diggins et al. Biophys Rep (N Y). .

Abstract

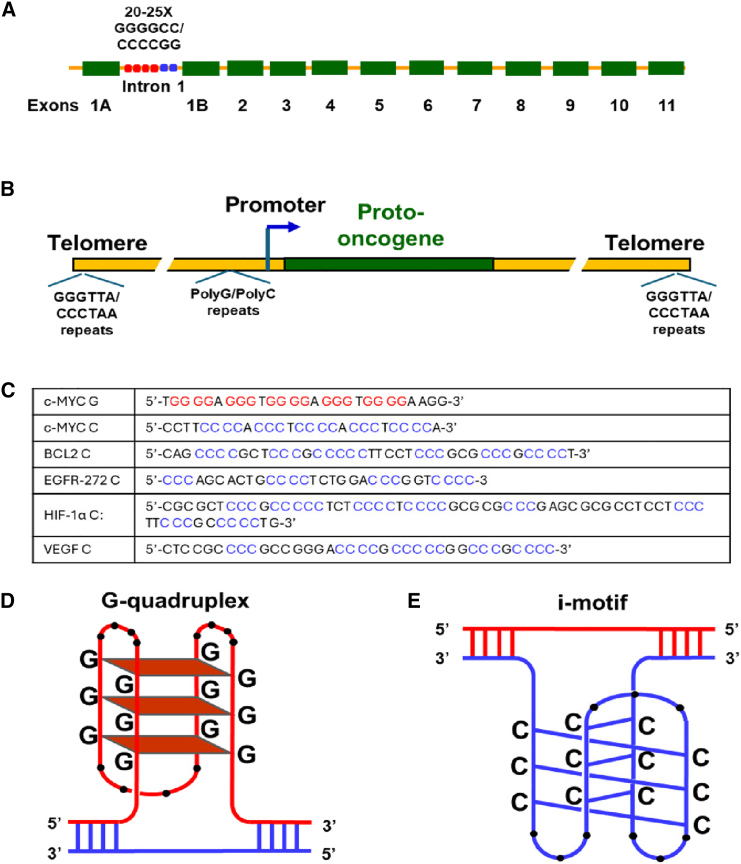
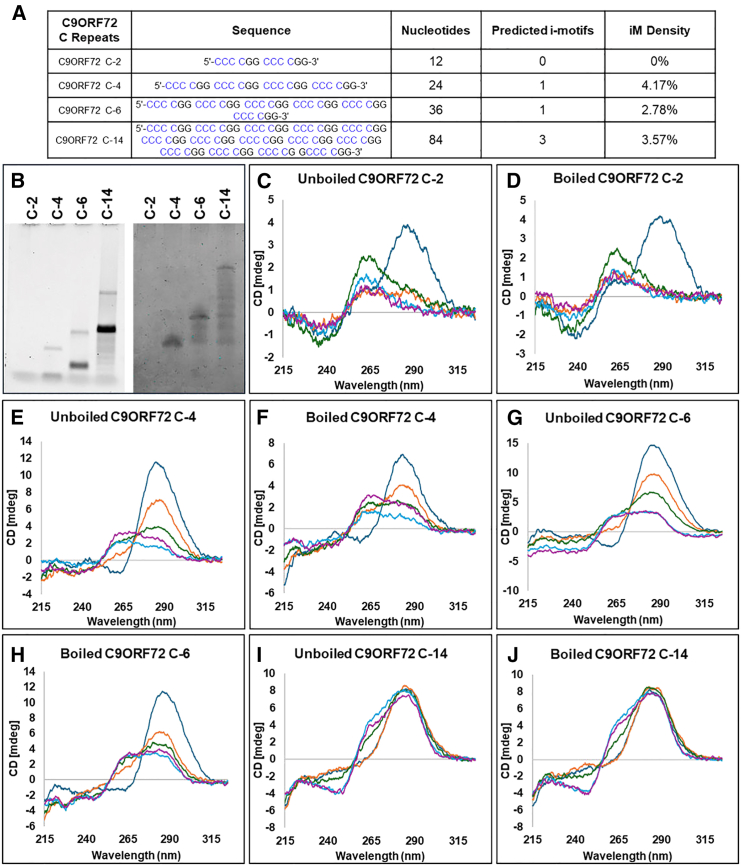
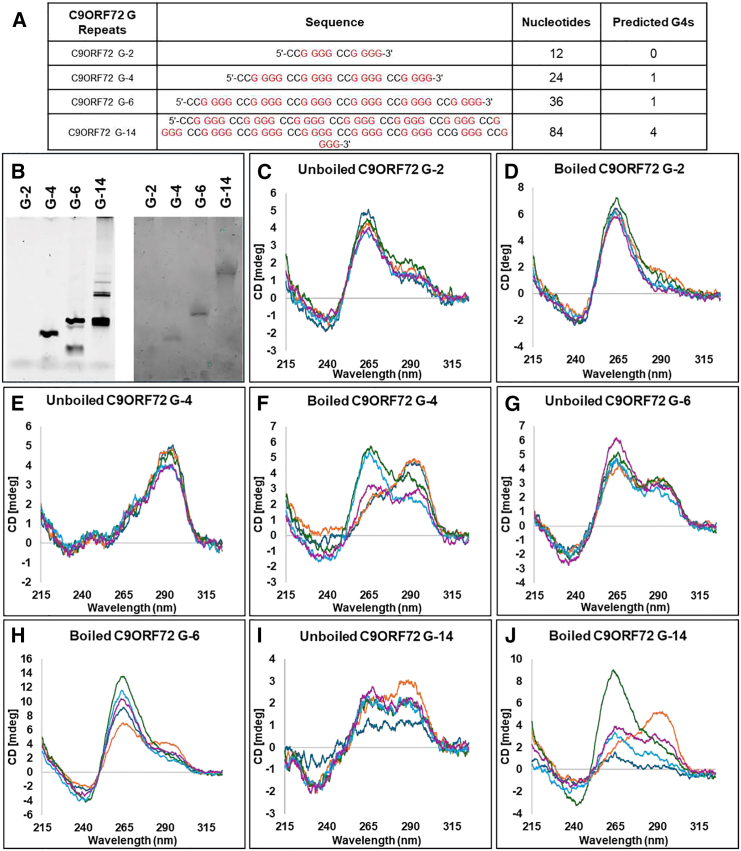
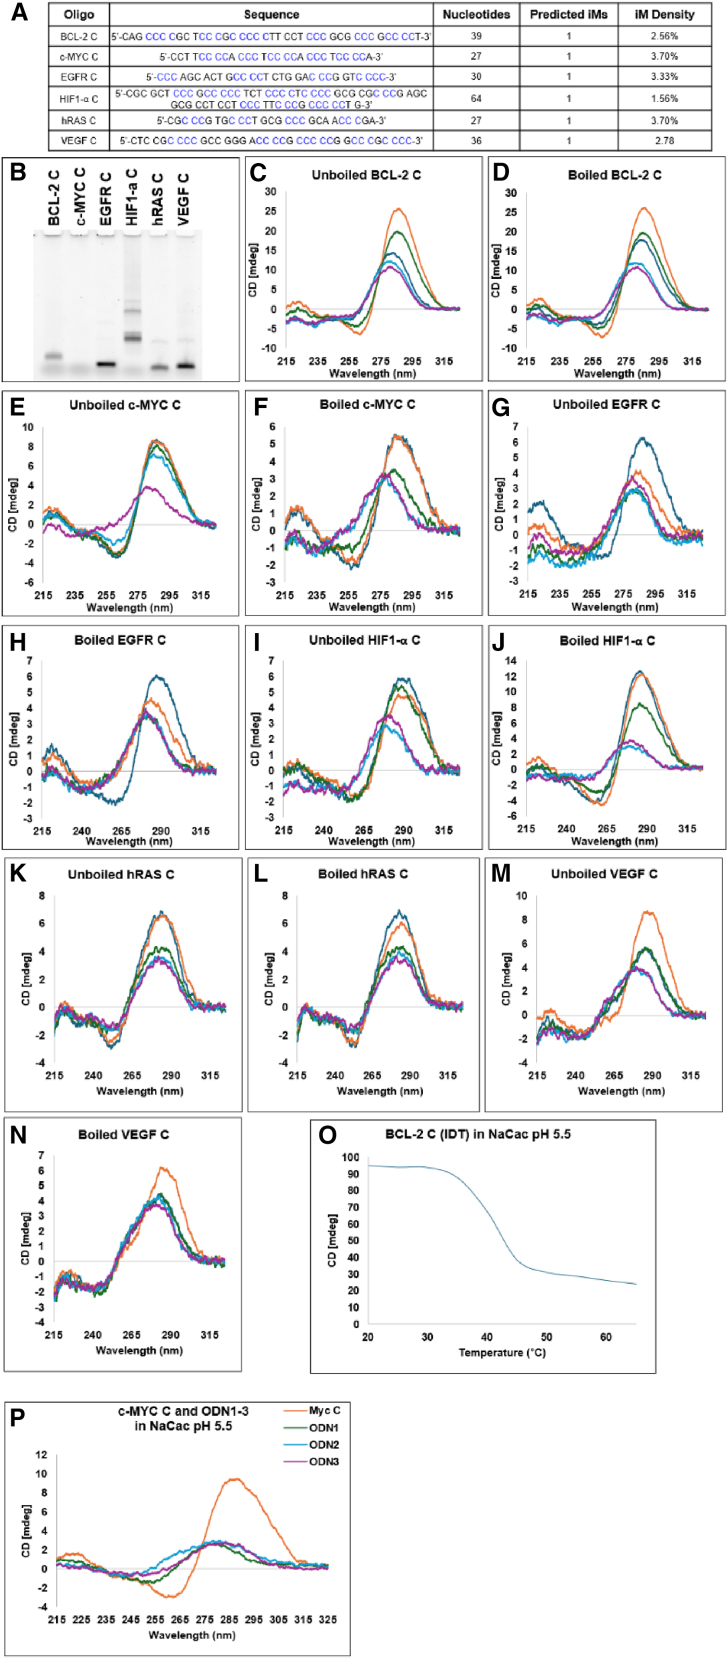
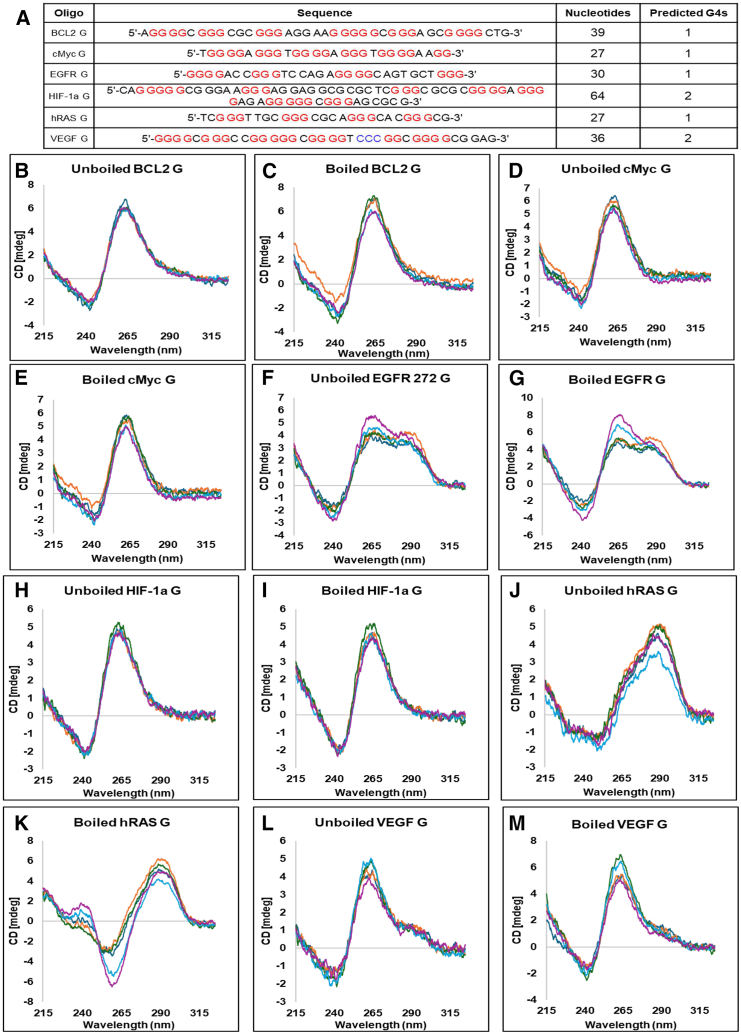
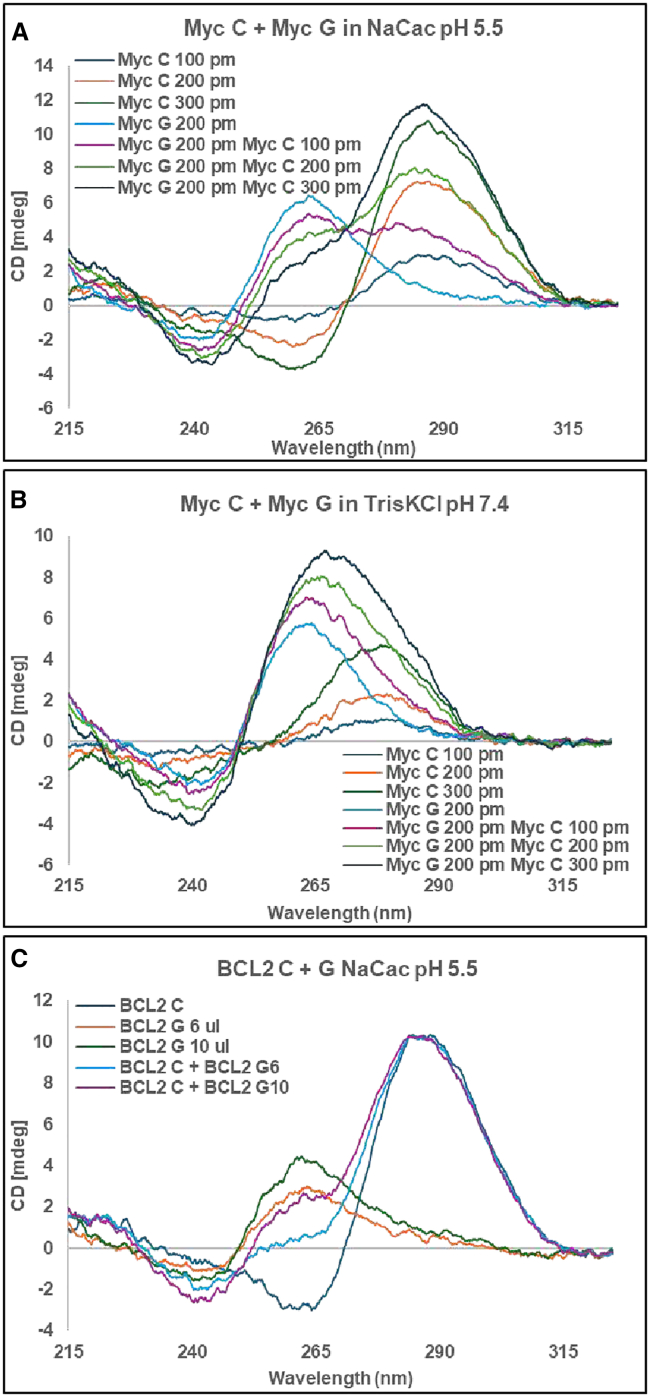
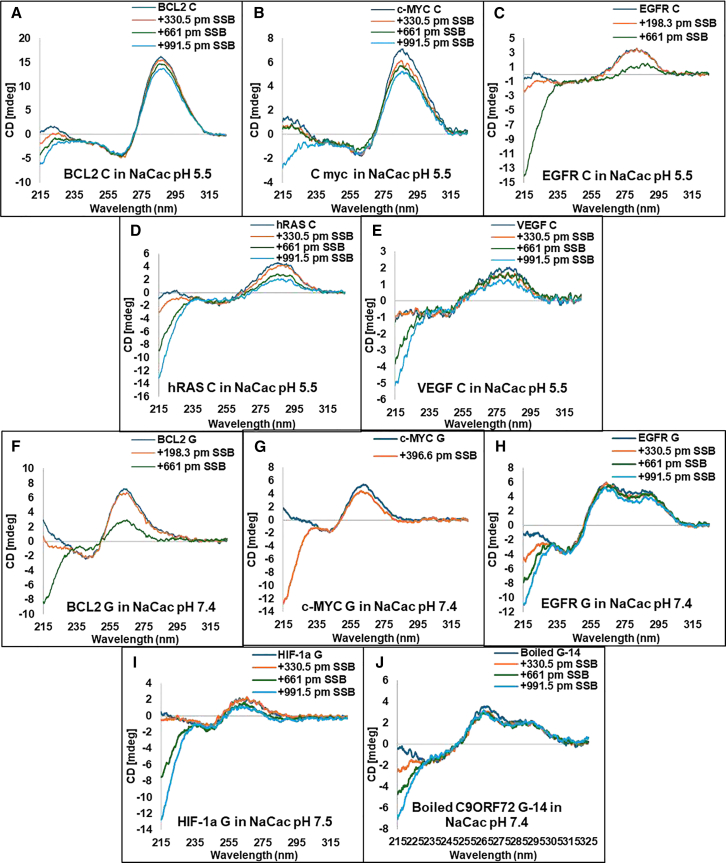
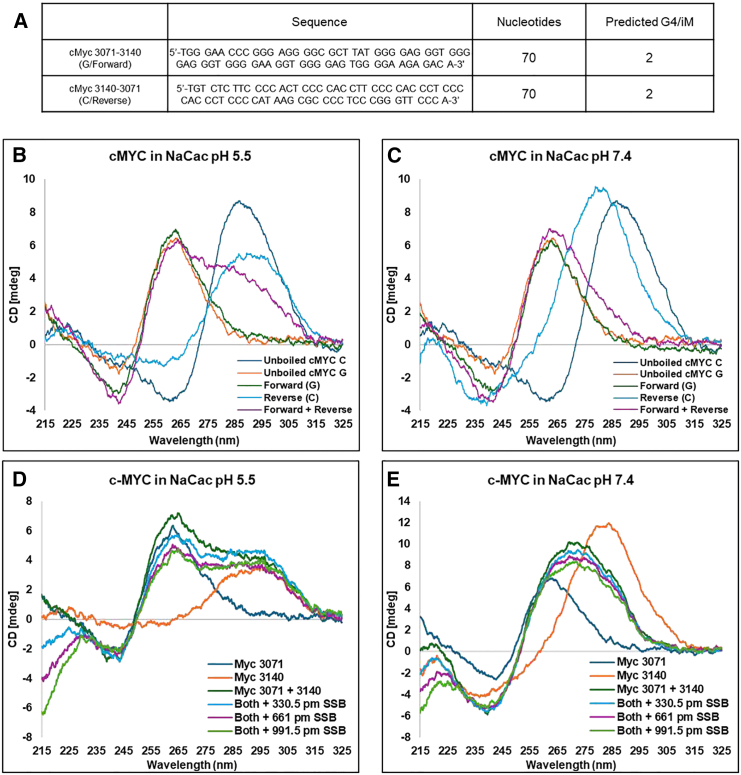
The B-DNA of the genome contains numerous sequences that can form various noncanonical structures including G-quadruplex (G4), formed by two or more stacks of four guanine residues in a plane, and intercalating motif (i-motif [iM]) formed by alternately arranged C-C+ pairs. One of the easy yet sensitive methods to study G4s and iMs is circular dichroism (CD) spectroscopy, which generates characteristic G4 and iM peaks. We have analyzed and compared the effects of various environmental factors including pH, buffer composition, temperature, flanking sequences, complimentary DNA strands, and single-stranded DNA binding protein (SSB) on the CD patterns of G4s and iMs generated by two groups of DNA molecules, one containing tandem repeats of GGGGCC and CCCCGG from the C9ORF72 gene associated with amyotrophic lateral sclerosis and frontotemporal dementia, and the second containing polyG/polyC clusters from oncogene promoter-proximal regions without such tandem repeats. Changes in pH caused drastic changes in CCCCGG-iM and GGGGCC-G4 and the changes were dependent on repeat numbers and G-C basepairing. In contrast, with the DNA sequences from the promoter-proximal regions of oncogenes, iMs disassembled upon pH changes with the peak slowly shifting to lower wavelength but the G4s did not show significant change. Complementary DNA strands and flanking DNA sequences also regulate G4 and iM formation. The SSB disassembled both G4s and iMs formed by almost all sequences suggesting an in vivo role for SSBs in the disassembly of G4s and iMs during DNA replication and other DNA transactions.


Conflict of interest statement

Declaration of interests The author declares no competing interests.

Figures

Figure 1
Figure 1
DNA sequences, G4s and iMs. (A) Hexanucleotide repeats in intron 1 of C9ORF72. (B) Promotor-proximal region of oncogenes. (C) DNA sequences of promoter-proximal regions of various oncogenes. (D) Model showing a G-quadruplex. (E) Model showing an iM.
Figure 2
Figure 2
Effects of pH, buffer composition, and boiling on CD spectra of iM-forming sequences of hexanucleotide repeats present at intron 1 of C9ORF72 gene. (A) Prediction of iM formation using iM Seeker. (B) A 6% polyacrylamide gel (left) and a 15% urea-acrylamide gel (right) showing oligos used in the experiment. (C–J) CD spectra of oligos containing 2, 4, 6, and 14 repeats of the hexanucleotide 5′-CCCCGG-3ʹ. Blue, Na-Cac pH 5.5; orange, Tris-Acetate pH 6.0; green, MES pH 6.5; light blue, Na-Cac pH 7.4; purple, Tris-KCl pH 7.4.
Figure 3
Figure 3
Effects of pH, buffers, and temperature on CD spectra of C9ORF72 G4-forming oligos (G2, G4, G6, and G14). (A) Prediction of G4 formation using QGRS mapper. (B) A 6% polyacrylamide gel (left) and a 15% urea-acrylamide gel (right) showing oligos used in the experiment. (C–J) Oligos containing 2, 4, 6, and 14 repeats of the hexanucleotide 5′-GGGGCC-3ʹ. Blue, Na-Cac pH 5.5; orange, Tris-Acetate pH 6.0; green, MES pH 6.5; light blue, Na-Cac pH 7.4; purple, Tris-KCl pH 7.4.
Figure 4
Figure 4
CD spectra of iM-forming sequences from oncogene promoter-proximal region. (A) Prediction of iM formation using iM Seeker. (B) A 6% polyacrylamide gel showing oligos used in the experiment. (C–N) CD spectra of oligos containing polyC-rich DNA sequences from promoter-proximal region of various oncogenes. Blue, Na-Cac pH 5.5; orange, Tris-Acetate pH 6.0; green, MES pH 6.5; light blue, Na-Cac pH 7.4; purple, Tris-KCl pH 7.4. (O) Melting curve of BCL-2 in Na-Cac at pH 5.5. (P) c-MYC C oligo along with three negative control oligos ODN 1–3 at pH 5.5.
Figure 5
Figure 5
CD spectra of G4-forming sequences from oncogene promoter-proximal region. (A) Prediction of G4 formation using QGRS Mapper. (B–M) CD spectra of oligos containing polyG-rich DNA sequences from promoter-proximal region of various oncogenes. Blue, Na-Cac pH 5.5; orange, Tris-Acetate pH 6.0; green, MES pH 6.5; light blue, Na-Cac pH 7.4; purple, Tris-KCl pH 7.4.
Figure 6
Figure 6
Effect of a complementary strand on G4 and iM formation. (A) Effect of increasing concentration of c-MYC C strand on G4 formation by polyG/polyC-rich oligos at pH 5.5. (B) Effect of increasing concentration of c-MYC C strand on G4 formation by polyG-rich DNA at pH 7.4. (C) Effect of complementary strands of the BCL-2 promoter-proximal region.
Figure 7
Figure 7
Effect of SSB protein on G4 and iM stability. (A–E) Effects of SSB on iM formation by oligos with DNA sequences from promoter-proximal regions of BCL-2, c-MYC, EGFR, hRAS, and VEGF. (F–J) Effects of SSB on G4 formation by oligos with DNA sequences from promoter-proximal regions of BCL-2, c-MYC, EGFR, HIF1-α, and C9ORF72 G-14.
Figure 8
Figure 8
Effects of flanking sequences and SSB on G4 and iM formation at pH of c-MYC promoter-proximal region. (A) Sequences of oligonucleotides and predictions of G4/iM formation. (B and C) CD spectra of c-MYC G4 and iM formation by oligos with flanking sequences. (D and E) CD spectra of effects of SSB on G4 and iM formation in oligos with G4/iM-forming sequences and their flanking sequences.

Similar articles

References

    1. Poggi L., Richard G.-F. Alternative DNA Structures In Vivo: Molecular Evidence and Remaining Questions. Microbiol. Mol. Biol. Rev. 2021;85 - PMC - PubMed
    1. Kaushik M., Kaushik S., et al. Kukreti S. Structural diversity and specific recognition of four stranded G-quadruplex DNA. Curr. Mol. Med. 2011;11:744–769. - PubMed
    1. Ortiz de Luzuriaga I., Lopez X., Gil A. Learning to Model G-Quadruplexes: Current Methods and Perspectives. Annu. Rev. Biophys. 2021;50:209–243. - PubMed
    1. Alba J.J., Sadurní A., Gargallo R. Nucleic Acid i-Motif Structures in Analytical Chemistry. Crit. Rev. Anal. Chem. 2016;46:443–454. - PubMed
    1. Chambers V.S., Marsico G., et al. Balasubramanian S. High-throughput sequencing of DNA G-quadruplex structures in the human genome. Nat. Biotechnol. 2015;33:877–881. - PubMed

LinkOut - more resources