. 2025 Apr 7;74(5):787-803.
doi: 10.1136/gutjnl-2024-332121.

Genetic variation at 11q23.1 confers colorectal cancer risk by dysregulation of colonic tuft cell transcriptional activator POU2AF2

Affiliations

Genetic variation at 11q23.1 confers colorectal cancer risk by dysregulation of colonic tuft cell transcriptional activator POU2AF2

Vidya Rajasekaran et al. Gut. .

Abstract

Background: Common genetic variation at 11q23.1 is associated with colorectal cancer (CRC) risk, exerting local expression quantitative trait locus (cis-eQTL) effects on POU2AF2, COLCA1 and POU2AF3 genes. However, complex linkage disequilibrium and correlated expression has hindered elucidation of the mechanisms by which genetic variants impart underlying CRC risk.

Objective: Undertake an interdisciplinary approach to understand how variation at 11q23.1 locus imparts CRC risk.

Design: We employ analysis of RNA sequencing, single-cell RNA sequencing, chromatin immunoprecipitation sequencing and single-cell ATAC sequencing data to identify, prioritise and characterise the genes that contribute to CRC risk. We further validate these findings using mouse models and demonstrate parallel effects in human colonic mucosa.

Results: We establish rs3087967 as a prime eQTL variant at 11q23.1, colocalising with CRC risk. Furthermore, rs3087967 influences expression of 21 distant genes, thereby acting as a trans-eQTL hub for a gene-set highly enriched for tuft cell markers. Epigenomic analysis implicates POU2AF2 as controlling the tuft cell-specific trans-genes, through POU2F3-correlated genomic regulation. Immunofluorescence confirms rs3087967 risk genotype (T) to be associated with a tuft cell deficit in the human colon. CRISPR-mediated deletion of the 11q23.1 risk locus genes in the mouse germline exacerbated the ApcMin/+ mouse phenotype on abrogation of Pou2af2 expression specifically.

Conclusion: We demonstrate that genotype at rs3087967 controls a portfolio of genes through misregulation of POU2AF2. POU2AF2 is the primary transcriptional activator of tuft cells with a tumour suppressive role in mouse models. We therefore implicate tuft cells as having a key tumour-protective role in the large bowel epithelium.

Keywords: cancer; cancer susceptibility; colorectal cancer; colorectal cancer genes.


Conflict of interest statement

Competing interests: None declared.

Figures

Figure 1
Figure 1. Several 11q23.1 variants exhibit significant associations with POU2AF2, COLCA1 and POU2AF3 expression in GTEx transverse colon RNA sequencing. LocusZoom plots of variant position and significance of association with POU2AF2, COLCA1 and POU2AF3 expression. Recombination rate (blue line) is derived from HapMap reference population. Variants are coloured according to their linkage disequilibrium (LD) with the tag variant (rs3802842, represented by a purple triangle), and are shown in grey if no LD information is available. Previously suggested top-associated variants are highlighted.
Figure 2
Figure 2. Summarised Mendelian randomisation (SMR) of 11q23.1 trans-expression quantitative trait locus (eQTL) targets identifies 21 novel genes with colorectal cancer (CRC) risk association. SMR analysis shows an association between the expression of nominally significant 11q23.1 trans-eQTL targets (p<0.01) with greater 11q23.1 trans-eQTL effect than cis-eQTL effect (n=1474) and CRC risk. 11q23.1 trans-eQTL targets with genome-wide significance for CRC risk (pSMR<8.4e-6) are highlighted and orange for those with significant trans-eQTL effects (p<5e-8).
Figure 3
Figure 3. Pan-tissue 11q23.1 expression quantitative trait locus (eQTL) analysis indicates risk-associated transcriptional dynamics are largely colon-specific. Posterior mean and local false sign rate (LFSR) significance of eQTL effects of rs3087967 on 11q23.1 cis-eQTL and trans-eQTL targets across all GTEx tissue sites, calculated by multiple adaptive shrinking analysis. *P<0.05; **p<0.01; ***p<0.001; ****p<0.0001. Grey boxes indicate the absence of posterior mean statistics for tissues where the gene did not meet the minimum expression threshold (see ‘Materials and methods’ section).
Figure 4
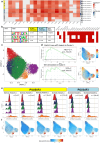
Figure 4. POU2AF2 and POU2AF3 are potential regulators of the colonic tuft cell chromatin accessibility landscape in the human colon. (a) Heatmap of signal values (log2+1) for POU2AF2, POU2AF3 and POU2F3 binding at refined trans-eQTL targets across NCIH211, NCIH526 and NCIH1048 SCLC-P cell lines. Gene set enrichment analysis of refined trans-eQTL targets, based on all bound sequences ranked by signal value, is also shown. (b) HOMER known motif enrichment results at POU2AF2-bound and POU2AF3-bound sequences surrounding refined 11q23.1 trans-eQTL targets (left). Heatmap denoting presence of core motif in sequences at refined trans-eQTL targets (right, red if present). (c) Uniform Manifold Approximation Projection (UMAP) embedding of single-cell ATAC sequencing (scATACseq) data from 21 620 healthy colonic epithelial cells. Colour denotes cell-cluster. (d) Enrichment of refined 11q23.1 trans-eQTL targets and putative colonic tuft cell signature previously defined in cluster 5 accessibility marker genes and all cells. (e) Distribution of z-scored accessibility of POU2AF2-bound and POU2AF3-bound sequences per-cell (denoted as ‘zPOU2AF2 Accessibility’ and ‘zPOU2F3 Accessibility’, respectively) for each antibody/cell line replicate across scATACseq clusters. Vertical line indicates the mean normalised accessibility for each cluster. P values calculated by t-test of normalised enrichment scores in cluster 5 compared with all other clusters combined. (f) Per-cell enrichment scores shown in (e) displayed on the UMAP embedding.
Figure 5
Figure 5. Colorectal cancer (CRC) risk genotype at 11q23.1 is associated with reduced colonic tuft cell abundance. Double immunofluorescent staining of tuft cell markers ChAT/POU2F3 (top) and PTGS1/POU2F3 (bottom) in human colon epithelium across rs3087967 genotype, C=non-CRC risk allele, T=CRC risk-associated allele. P values calculated by unpaired Wilcoxon rank-sum test. Scale bar=50 µm. Example positive cells are indicated by yellow arrowheads.
Figure 6
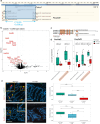
Figure 6. C11orfΔ-/- mice recapitulate 11q23.1 variation associated transcriptional dynamics and tuft cell abundance. (a) Generation of the C11orfΔ model, characterised by a 19 358 bp deletion across all three homologs of 11q23.1 cis-expression quantitative trait loci (eQTL). Schematic obtained from ensembl (https://www.ensembl.org/, accessed 21 September 2022). (b) Volcano plot of the differentially expressed (DE) genes from C11orfΔ-/- (n=4) vs wild-type (n=7) colon RNA sequencing (RNAseq). Genes with absolute log2 fold change >1.5 and false discovery rate (FDR) <0.05 are highlighted in red and underlined if an 11q23.1 trans-eQTL target homolog. (c) Pou2f interaction domain homology between Pou2af1, Pou2af2 and Pou2af3 protein sequences (left) and transcripts encoding this domain (right and boxed to highlight). (d) Expression of detected Pou2af2 and Pou2af3 transcripts across C11orfΔ-/- and wild-type colon RNAseq. FDR calculated to account for the number of cis-eQTL transcripts being tested only. Orange highlight indicates transcripts encoding Pou2f interaction domain. (e) Immunofluorescent stains of Dclk1/acetylated-⍺-tubulin (ac-⍺-tub) and Pou2f3/ac-⍺-tub across C11orfΔ-/- genotype. Scale bar=50 μm. P values calculated by unpaired Wilcoxon rank-sum test.
Figure 7
Figure 7. 11q23.1 trans-expression quantitative trait loci (eQTL) target homolog expression is correlated with Pou2f interaction domain encoding Pou2af2 transcript specifically. (a) Generation of the Pou2af2 and Pou2af3 models. Schematic obtained from ensembl (https://www.ensembl.org/, accessed 22 September 2022). (b) Weighted Gene Co-expression Network Analysis of the expression of genes nominally significantly downregulated C11orfΔ mice (p<0.01, n=584), across Pou2af2-/- (n=2) and wild-type (n=7) colon RNA sequencing (RNAseq). (c) Sample trait matrix of the Pearson’s correlation (above) and false discovery rate (FDR)-corrected significance (below) between module eigengenes and sample traits, including cis-eQTL target homolog transcripts (boxed if contain POU2F-ID). (d) Pairwise Pearson’s correlations (p<0.05) between genes downregulated in C11orfΔ-/- mice (figure 6b) identified in the green module, in addition to Pou2af2 and Pou2af3 transcripts. (e) Kamadakawai network of green module gene relatedness (adjacency >0.3).
Figure 8
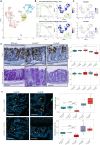
Figure 8. Pou2af2 and Pou2af3 expression is divergent across murine colonic epithelium and correlates with the abundance of tuft and goblet cells, respectively. (a) UMAP embedding of single-cell RNA sequencing (scRNAseq) from 16 828 healthy mouse colon epithelial cells. Cells are annotated by confidently annotated cell-cluster, see ‘Materials and methods’ section. (b) Gene set enrichment analysis (GSEA) (left) and single-sample GSEA (right) of C11orfΔ-/- vs wild-type differentially expressed genes (top, figure 6b) and Pou2af2 correlated genes from the green module (bottom, figure 6c) in murine tuft cell markers and across single cells. (c) Raw expression of Pou2af2 and Pou2af3 across individual cells in (a). (d) Abundance of Clca1 and periodic acid-Schiff stains of goblet cells and mucins, respectively, across Pou2af2 and Pou2af3 genotypes. P values are calculated by unpaired Wilcoxon rank-sum test. Count number is normalised to the length of crypts along their axis, as shown by yellow bar. (e) Abundance of double positive cells for Dclk1/ac-⍺-tub and Pou2f3/ac-⍺-tub markers of tuft cells by immunofluoresence (figure 6e) across Pou2af2 and Pou2af3 genotype. P values are Benjamini-Hochberg corrections of unpaired Wilcoxon rank-sum test. Scale bar=50 μm.
Figure 9
Figure 9. Expression of Pou2af2, but not Pou2af3, is protective of tumourigenesis in ApcMin/+ mice. (a) Kaplan-Meier curves of ApcMin/+Pou2af2 (left) and ApcMin/+Pou2af3 (right) survival. Both hazard ratio (HR) of homozygous Pou2af2 and Pou2af3 genotypes and likelihood ratio test (LRT) statistics are shown for univariate Cox proportional hazard tests. (b) (Left) Example images of methylene blue stained intestinal samples, with yellow arrowhead identifying example polyps. Scale bar=1 cm. (Right) Abundance and size of methylene blue-stained polyps across ApcMin/+Pou2af2 and ApcMin/+Pou2af3 mice (middle and right). pSI, proximal small intestine; dSI, distal small intestine; LI, large intestine/colon. P values are Benjamini-Hochberg corrections of unpaired Wilcoxon rank-sum test.

References

    1. Sud A, Kinnersley B, Houlston RS. Genome-wide association studies of cancer: current insights and future perspectives. Nat Rev Cancer. 2017;17:692–704. doi: 10.1038/nrc.2017.82. - DOI - PubMed
    1. Fernandez-Rozadilla C, Timofeeva M, Chen Z, et al. Deciphering colorectal cancer genetics through multi-omic analysis of 100,204 cases and 154,587 controls of European and east Asian ancestries. Nat Genet. 2023;55:89–99. doi: 10.1038/s41588-022-01222-9. - DOI - PMC - PubMed
    1. Whiffin N, Dobbins SE, Hosking FJ, et al. Deciphering the genetic architecture of low-penetrance susceptibility to colorectal cancer. Hum Mol Genet. 2013;22:5075–82. doi: 10.1093/hmg/ddt357. - DOI - PMC - PubMed
    1. Loo LWM, Lemire M, Le Marchand L. In silico pathway analysis and tissue specific cis-eQTL for colorectal cancer GWAS risk variants. BMC Genomics. 2017;18:381. doi: 10.1186/s12864-017-3750-2. - DOI - PMC - PubMed
    1. Biancolella M, Fortini BK, Tring S, et al. Identification and characterization of functional risk variants for colorectal cancer mapping to chromosome 11q23.1. Hum Mol Genet. 2014;23:2198–209. doi: 10.1093/hmg/ddt584. - DOI - PMC - PubMed