. 2024 Nov 28;15(1):10353.
doi: 10.1038/s41467-024-54502-9.

A massively parallel reporter assay library to screen short synthetic promoters in mammalian cells

Affiliations

A massively parallel reporter assay library to screen short synthetic promoters in mammalian cells

Adam M Zahm et al. Nat Commun. .

Abstract

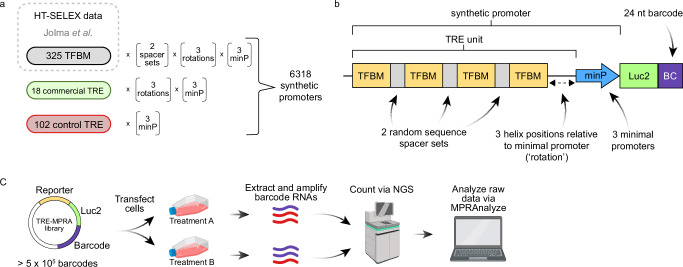
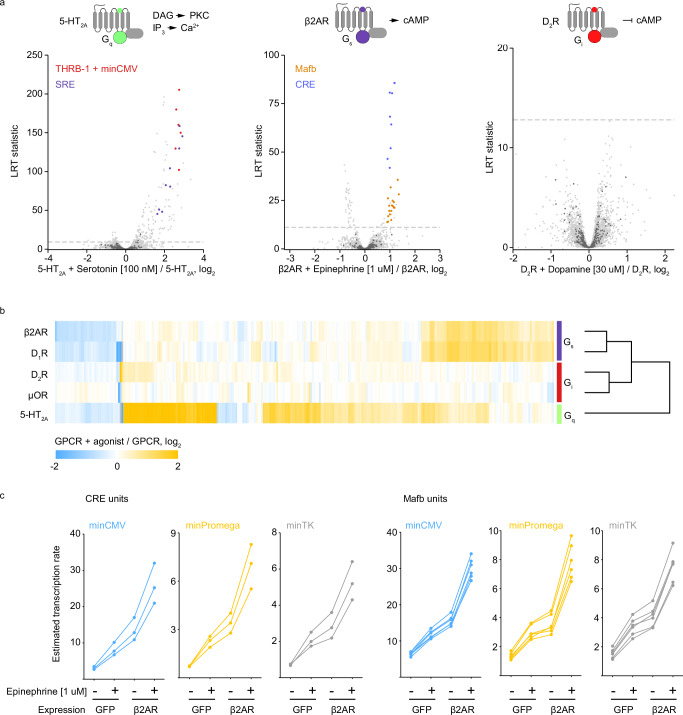
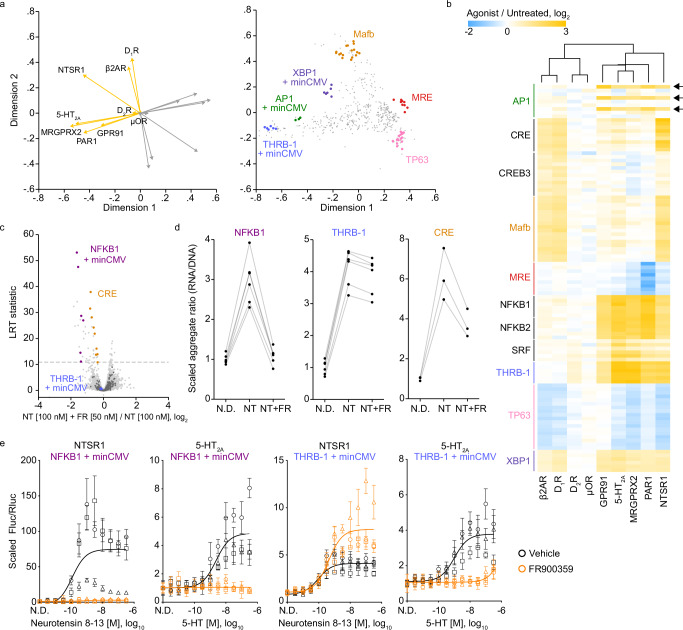
Cellular responses to stimuli underpin discoveries in drug development, synthetic biology, and general life sciences. We introduce a library comprising 6144 synthetic promoters, each shorter than 250 bp, designed as transcriptional readouts of cellular stimulus responses in massively parallel reporter assay format. This library facilitates precise detection and amplification of transcriptional activity from our promoters, enabling the systematic development of tunable reporters with dynamic ranges of 50-100 fold. Our library proved functional in numerous cell lines and responsive to a variety of stimuli, including metabolites, mitogens, toxins, and pharmaceutical agents, generating robust and scalable reporters effective in screening assays, biomarkers, and synthetic circuits attuned to endogenous cellular activities. Particularly valuable in therapeutic development, our library excels in capturing candidate reporters to signals mediated by drug targets, a feature we illustrate across nine diverse G-protein coupled receptors (GPCRs), critical targets in drug development. We detail how this tool isolates and defines discrete signaling pathways associated with specific GPCRs, elucidating their transcriptional signatures. With its ease of implementation, broad utility, publicly available data, and comprehensive documentation, our library will be beneficial in synthetic biology, cellular engineering, ligand exploration, and drug development.


Conflict of interest statement

Competing interests: W.S.O., A.N.G., J.S.B., S.K., and H.C. hold equity in and/or are employed by Octant Inc., a company where similar types of assays are used for its drug discovery efforts. The remaining authors declare no competing interests.

Figures

Fig. 1
Fig. 1. TRE-MPRA overview.
a Transcription factor binding motifs (TFBMs) included in the TRE-MPRA library were derived from the HT-SELEX dataset of Jolma et al. Candidate synthetic promoters were designed by combining homotypic TFBMs and one of three minimal promoters in multiple configurations. Commercially available TREs, as well as negative control promoters were also included in the TRE-MPRA library. b Four copies of a given TFBM were oriented on alternating sides of the DNA double helix using spacer sets of random nucleotides and rotated along the helix relative to the minimal promoter (TRE unit). TRE units combined with minimal promoters (‘promoters’) regulate the expression of a Luc2 CDS containing 24 nucleotide barcodes in the 3’ UTR. Barcodes were mapped to associated TRE units using next-generation sequencing (NGS) during library preparation. c Barcoded RNAs were extracted from transfected cells and sequenced via NGS alongside the input TRE-MPRA plasmid libraries. Resulting barcode counts were used to generate estimated transcription rates and analyzed via MPRAnalyze to compare promoter activities between treatments. Created in BioRender. Zahm, A. (2024) https://BioRender.com/i28a348.
Fig. 2
Fig. 2. TRE-MPRA benchmarking with fetal bovine serum and forskolin.
a Promoter responses of HEK293 cells treated with 10% FBS (left) or 20 µM forskolin (right) (n = 3 each) compared to untreated cells (n = 4). Select promoters are colored by TFBM. Dashed lines: 5% FDR threshold. Dark gray data points: negative control promoters. LRT, likelihood ratio test. b Barcode fold changes for promoters containing the THRB-1 motif or similar motifs following 10% FBS treatment. Individual barcode responses of each THRB-1 (c) or Mafb (e) promoter in FBS or forskolin treated cells, respectively, relative to controls. d, f Dose-response curves of THRB-1 (d) and Mafb (e) TRE promoters tested in dual-luciferase assays. Data were scaled to the Fluc/Rluc ratio in untreated cells (N.D. – no drug). Data points and error bars: mean and standard deviation (n = 4 technical replicates) within each experimental replicate (n = 3 independent experiments). Shaded lines indicate TRE-MPRA doses.
Fig. 3
Fig. 3. TRE-MPRA results using additional stimuli.
a Heatmap of fold change responses in HEK293 cells across ten stimulus conditions relative to untreated cells. Treatment conditions were clustered using Euclidean distance with complete linkage. Displayed are the fold change values for all promoters that were significantly altered by treatment in at minimum one comparison. b Volcano plot of promoter responses following treatment of HEK293 cells with 100 nM dexamethasone in comparison to untreated cells. Dashed line indicates an FDR threshold of 5%. Negative control promoters are indicated by dark gray data points. c Dose response curve from HEK293 cells transfected with an AR promoter dual luciferase reporter and treated with dexamethasone (AR, minCMV, rotation 4, spacer set 1). Data were scaled (baseline normalized) to the Fluc/Rluc ratio in untreated cells (N.D. – no drug). The curve was fit to baseline normalized Fluc/Rluc values. Data points and error bars indicate the mean and standard deviation of technical replicates within each of three experimental replicates (n = 3 independent experiments, distinguished via color). The shaded vertical line indicates the dose of dexamethasone used in the TRE-MPRA experiment. d Scatterplot comparing promoter responses between lithium and cadmium treatments. HSF1 units were more responsive to cadmium. Dashed line indicates the identity line (y = x). e Separated biplots of standardized baseline transcription rates in the six mammalian cell lines. Displayed are the untreated cell line (left) and promoter (right) projections across two dimensions. All colored units are paired with the minCMV promoter. Orange and gray projection lines indicate the positive and negative directions of the treatment projection, respectively. f Example cell line-specific promoters responsive to treatment with 10% FBS. Each displayed promoter was significantly induced by FBS treatment in exactly one of six mammalian cell lines (FDR < 5%).
Fig. 4
Fig. 4. TRE-MPRA detects distinct transcriptional signals downstream of aminergic GPCR agonism.
a Volcano plots of promoter responses following receptor agonism in HEK293 cells co-transfected with the TRE-MPRA library and GPCR expression plasmids. Dashed lines indicate an FDR threshold of 5%. Negative control promoters are indicated by dark gray data points. Created in BioRender. Zahm, A. (2024) https://BioRender.com/f26t609. b Heatmap of promoter fold change responses to GPCR agonism in HEK293 cells. Displayed are the fold change values for all promoters that were significantly altered by agonist treatment in at minimum one comparison. GPCRs were clustered using Euclidean distance with complete linkage. c Transcription rate estimates (aggregate RNA/DNA ratios) for CRE and Mafb units in HEK293 cells following 1 µM epinephrine treatment or ADRB2 overexpression, or both. Each connected set of data points represents a single promoter.
Fig. 5
Fig. 5. Profiling promoter activity following activation of additional GPCRs.
a Separated biplots for the set of promoters that showed a significant response to receptor agonism in at least one of the nine datasets. Displayed are the GPCR log2 fold changes (agonist versus untreated) (left) and promoter (right) projections across two dimensions. Responding promoters of interest are highlighted. Orange and gray projection lines indicate the positive and negative directions of the treatment projection, respectively. b Heatmap of selected promoter responses to agonism across GPCR experiment groups. GPCRs were clustered using Euclidean distance with complete linkage. Arrows indicate the AP1 unit/minCMV promoters. A list of promoter (row) labels can be found in Supplementary Data 6. c Volcano plot of promoter responses following neurotensin 8−13 (NT) treatment in HEK293 cells co-transfected with the TRE-MPRA library and an NTSR1 expression plasmid, with or without addition of the Gαq-specific inhibitor FR900359 (FR). d Scaled transcription rate estimates (aggregate ratios) for NFKB1, THRB-1, and CRE units paired with minCMV in HEK293 cells expressing NTSR1. N.D., no drug; NT, neurotensin 8−13 [100 nM]; NT + FR, neurotensin 8−13 [100 nM] + FR900359 [50 nM]. Each set of connect dots represents a single promoter. e Dual luciferase response curves in HEK293 cells in the presence or absence of 50 nM of the Gαq-specific inhibitor FR900359 (THRB-1, minCMV, rotation 8, spacer set 1; NFKB1, minCMV, rotation 8, spacer set 1). Data were scaled (baseline normalized) to the Fluc/Rluc ratio in untreated cells (N.D. – no drug). The curve was fit to baseline normalized Fluc/Rluc values across three experimental replicates. Data points and error bars indicate the mean and standard deviation of four technical replicates within each of three experimental replicates (n = 3 independent experiments, distinguished via shape).

Update of

References

    1. Dynan, W. S. & Tjian, R. Control of eukaryotic messenger RNA synthesis by sequence-specific DNA-binding proteins. Nature316, 774–778 (1985). - PubMed
    1. Kadonaga, J. T., Carner, K. R., Masiarz, F. R. & Tjian, R. Isolation of cDNA encoding transcription factor Sp1 and functional analysis of the DNA binding domain. Cell51, 1079–1090 (1987). - PubMed
    1. Maniatis, T., Goodbourn, S. & Fischer, J. A. Regulation of inducible and tissue-specific gene expression. Science236, 1237–1245 (1987). - PubMed
    1. Fink, J. S. et al. The CGTCA sequence Motif is essential for biological activity of the vasoactive intestinal peptide gene cAMP-regulated enhancer. Proc. Natl Acad. Sci. USA85, 6662–6666 (1988). - PMC - PubMed
    1. Harbison, C. T. et al. Transcriptional regulatory code of a eukaryotic genome. Nature431, 99–104 (2004). - PMC - PubMed

Publication types

Substances

Associated data