. 2024 Nov 28;15(1):10356.
doi: 10.1038/s41467-024-54437-1.

Mechanistic basis for the emergence of EPS1 as a catalyst in salicylic acid biosynthesis of Brassicaceae

Affiliations

Mechanistic basis for the emergence of EPS1 as a catalyst in salicylic acid biosynthesis of Brassicaceae

Michael P Torrens-Spence et al. Nat Commun. .

Abstract

Salicylic acid (SA) production in Brassicaceae plants is uniquely accelerated from isochorismate by EPS1, a newly identified enzyme in the BAHD acyltransferase family. We present crystal structures of EPS1 from Arabidopsis thaliana in both its apo and substrate-analog-bound forms. Integrating microsecond-scale molecular dynamics simulations with quantum mechanical cluster modeling, we propose a pericyclic rearrangement lyase mechanism for EPS1. We further reconstitute the isochorismate-derived SA biosynthesis pathway in Saccharomyces cerevisiae, establishing an in vivo platform to examine the impact of active-site residues on EPS1 functionality. Moreover, stable transgenic expression of EPS1 in soybean increases basal SA levels, highlighting the enzyme's potential to enhance defense mechanisms in non-Brassicaceae plants lacking an EPS1 ortholog. Our findings illustrate the evolutionary adaptation of an ancestral enzyme's active site to enable a novel catalytic mechanism that boosts SA production in Brassicaceae plants.


Conflict of interest statement

Competing interests: J.K.W. is a member of the Scientific Advisory Board and a shareholder of DoubleRainbow Biosciences, Galixir, and Inari Agriculture, which develop biotechnologies related to natural products, drug discovery, and agriculture. All other authors have no competing interests.

Figures

Fig. 1
Fig. 1. The metabolic function and evolutionary origin of EPS1.
a The SA biosynthetic pathway in Brassicaceae plants. b Simplified maximum likelihood tree of the EPS1 clade (purple), the EPS1 sister clade (blue) and its most closely related HXXXD-type acyl-transferase family protein ancestral clade (green). Note that the blue EPS1 sister clade is seemingly lost in the majority of Brassicaceae plants. The purple EPS1 clade enzymes and not the neighboring clades display strict conservation for the serine substitution for the characteristic histidine in the (HXXXD) motif. c Simplified taxonomy of Brassicaceae plants displaying the presence or absence of the green ancestor clade, the blue EPS1 sister clade or the purple true EPS1 clade enzymes. d In A. thaliana, the EPS1 gene (purple arrow and shading) is adjacent to its closest homolog AT5G67150.1 (green arrow and shading). In the related species A. lyrata, EPS1 is sandwiched between the AT5G67150.1 ortholog AL8G44210.t1 (green arrow and shading) and the even more closely related A. lyrata AL8G44190.t1 (blue arrow and shading). Our analyses suggest that in the common ancestor of Brassicaceae plants, the HXXXD-clade progenitor duplicated in situ to yield two derived copies that founded the EPS1 clade and the EPS1 sister clade, respectively. Whereas the EPS1 clade acquired IPGL activity, the EPS1 sister clade genes were then lost in A. thaliana and the majority of other profiled extant Brassicaceae species.
Fig. 2
Fig. 2. Structural features of AtEPS1.
a The CAG-bound AtEPS1 structure. The N-terminal domain is displayed in salmon, the crossover loop is displayed in slate blue, the dynamic portion of the crossover loop is colored in cyan, the C-terminal domain is displayed in maroon, and the lid loop is colored in purple. |2Fo – Fc| electron density map for the CAG ligand is contoured at 1.5 σ. b Structure of the EPS1 ligand (CAG) and the native substrate (IGA). c The CAG-bound AtEPS1 and the gray superimposed p-coumaroylshikimate-bound AtHCT (PDB: 5KJU). AtEPS1 residues corresponding to the AtHCT catalytic triad and the bulky residues filling the acetyl donor site are individually labeled and colored in salmon. The two catalytic residues of AtHCT are labeled and colored in gray. d Superimposition of the AtEPS1 CAG-bound and apo structures. The apo structure is displayed in bluewhite with the dynamic loops rendered in black. The dynamic loops from both structures are displayed in cartoon putty where the radius of the loops represents relative b-factor. Val355, Ser356, and Val357, annotated in the CAG-bound model, are the only dynamic-loop residues in both structures, within 6 Å distance from CAG.
Fig. 3
Fig. 3. The catalytic mechanism of EPS1.
a Binding pose of IGA (yellow) in the EPS1 active site revealed by docking, simulated annealing and MD simulations. The pose of CAG (green) is superposed. b Structural difference of IGA in water (dashed line) and when bound to EPS1 (solid line) measured by three representative distances: d1:H2-C9 (blue), d2: ether O-amide H (orange), and d3: H2-N (green). c IPGL process of IGA in EPS1. Rearrangement results in intramolecular strain release and separation of products through a 57° flipping of SA adjusted by two residues (Arg395 and Arg44) and anchoring of NPG with Thr306, leading to an irreversible IPL process. d Proposed pericyclic reaction where the hydrogen atom at C2 is transferred to C9 of the side chain simultaneously with C-O cleavage. e The structure of the geometry optimized QM cluster model starting from the MD snapshots. The secondary structure is depicted with an orange cartoon representation. Carbons of key amino acids are shown in gray, and the substrate carbons are shown in light blue. All other atoms are colored as follows: nitrogen in blue, oxygen in red, and hydrogen in white. f Relative ΔG energy profiles in kcal/mol of the enzymatic reaction (black) and non-enzymatic reaction (red) calculated at the B3LYP/def2-TZVP level of theory.
Fig. 4
Fig. 4. Relative SA pathway metabolite accumulation in various transgenic yeast lines.
Error bars indicate standard error of the mean (SEM) based on biological triplicates. Statistical analysis was conducted by two-tailed unpaired t-test. *P < 0.05, **P < 0.01, and ***P < 0.001. a IGA. b SA. c NPG. d Relative depletion of IGA in AtEPS1 alanine mutants alongside rescuing mimetic mutations (blue bars) in the heterologous yeast system which additionally express SID2 and PBS3.
Fig. 5
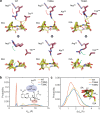
Fig. 5. Guarding effect of Thr306 to retain IPGL-active binding.
a Transiently altered binding pose of IGA due to flipped Arg282 only restored in WT and T306C. Populated structures of IGA and Arg282 in the WT simulations are displayed transparently. The red and green arrows indicate the variation upon Arg282 flipping and after restoration, respectively. Hydrogen bonds are illustrated by the yellow dashed lines. b Probability distribution of the minimum distance between the α-carboxylate of IGA and the guanidine group of Arg282 (d282). c Probability distribution of the distance between the C4 atom of IGA from a given simulation and the corresponding C4’ atom of product SA in the top cluster centroid structure from the WT simulations (ΔdC4).
Fig. 6
Fig. 6. Overexpression of AtEPS1 in soybean leads to ectopic accumulation of SA and a stunted growth phenotype correlated with SA level.
a Four-week-old, greenhouse-grown wild-type soybean plant and three representative independent lines of transgenic soybean overexpressing AtEPS1. Phenotypes were categorized as wild-type-like (1), moderate (2), and severe (3). b SA levels in the individual plants as pictured in a. Results are presented as mean peak area values, based on three biological replicates obtained from distinct leaf samples of the same plant, with SEM indicated as error bars. Statistical analysis was conducted using a two-tailed, unpaired t-test. ***P < 0.001. c Relative expression levels of the AtEPS1 transgene in the individual plants as pictured in a. The relative expression levels were quantified using the relative quantification (ΔΔCt) method based on three technical replicates.

References

    1. Ding, P. & Ding, Y. Stories of salicylic acid: a plant defense hormone. Trends Plant Sci.25, 549–565 (2020). - PubMed
    1. Raskin, I. Role of salicylic acid in plants. Annu. Rev. Plant Physiol. Plant Mol. Biol.43, 439–463 (1992).
    1. León, J., Shulaev, V., Yalpani, N., Lawton, M. A. & Raskin, I. Benzoic acid 2-hydroxylase, a soluble oxygenase from tobacco, catalyzes salicylic acid biosynthesis. Proc. Natl Acad. Sci. USA92, 10413–10417 (1995). - PMC - PubMed
    1. Wildermuth, M. C., Dewdney, J., Wu, G. & Ausubel, F. M. Isochorismate synthase is required to synthesize salicylic acid for plant defence. Nature414, 562–565 (2001). - PubMed
    1. Silverman, P. et al. Salicylic acid in rice (biosynthesis, conjugation, and possible role). Plant Physiol.108, 633–639 (1995). - PMC - PubMed

Publication types

MeSH terms

LinkOut - more resources