. 2024 Nov 28;15(1):10345.
doi: 10.1038/s41467-024-54744-7.

Structural basis of orientated asymmetry in a mGlu heterodimer

Affiliations

Structural basis of orientated asymmetry in a mGlu heterodimer

Weizhu Huang et al. Nat Commun. .

Abstract

The structural basis for the allosteric interactions within G protein-coupled receptors (GPCRs) heterodimers remains largely unknown. The metabotropic glutamate (mGlu) receptors are complex dimeric GPCRs important for the fine tuning of many synapses. Heterodimeric mGlu receptors with specific allosteric properties have been identified in the brain. Here we report four cryo-electron microscopy structures of mGlu2-4 heterodimer in different states: an inactive state bound to antagonists, two intermediate states bound to either mGlu2 or mGlu4 agonist only and an active state bound to both glutamate and a mGlu4 positive allosteric modulator (PAM) in complex with Gi protein. In addition to revealing a unique PAM binding pocket among mGlu receptors, our data bring important information for the asymmetric activation of mGlu heterodimers. First, we show that agonist binding to a single subunit in the extracellular domain is not sufficient to stabilize an active dimer conformation. Single-molecule FRET data show that the monoliganded mGlu2-4 can be found in both intermediate states and an active one. Second, we provide a detailed view of the asymmetric interface in seven-transmembrane (7TM) domains and identified key residues within the mGlu2 7TM that limits its activation leaving mGlu4 as the only subunit activating G proteins.


Conflict of interest statement

Competing interests: P.R. and J.P.P. are involved in a collaborative team between the CNRS and Cisbio Revvity, developing htrf-based tools. The remaining authors declare no competing interests.

Figures

Fig. 1
Fig. 1. Cryo-EM structures for mGlu2-4 heterodimer.
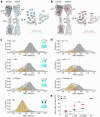
a Structural model for the mGlu2-4 heterodimer in inactive state with two potent competitive antagonists of the group-II and -III mGlu receptors, LY341495 and CPPG. Structural models for mGlu2-4 heterodimer in two intermediate states with mGlu2 agonist LY379268 bound to mGlu2 subunit (b) or with mGlu4 agonist L-AP4 bound to mGlu4 subunit (c). d Structural model for mGlu2-4 heterodimer in the active state in complex with heterotrimeric Gi3 protein and in the presence of Glu and the mGlu4 PAM VU0155041, where two molecules of Glu stabilize the close state of both mGlu2 and mGlu4 VFTs.
Fig. 2
Fig. 2. PAM binding mode of VU0155041.
a Comparison of the PAM binding pocket in mGlu4 and mGlu2 subunit. The mGlu4 PAM VU0155041 is shown as magenta sticks. The mGlu2 PAM JNJ-40411813 is shown as yellow sticks. b Detailed binding mode of VU0155041 in mGlu4 subunit. c Potency (pEC50) of Glu with or without VU0155041 on mGlu2-4 chimeric heterodimer (composed of mGlu2C1 and mGlu4C2, referred as Ctr) and the indicated mutants. Data points represent mean ± s.e.m. from independent experiments (n = 3, 5, 4, 3, 3, 4, 4, 4, 4) and analyzed using unpaired student t test (two-tailed) to determine significance between pEC50 of Glu without and with VU0155041 treatment for each receptor. ***P < 0.001, not significant (ns) >0.05. P values for (c): 0.0042, 0.5357, 0.3131, 0.1191, 0.6036, 0.6994, 0.0884, 0.3710, 0.2541 (from left to right). Source data are provided as a Source Data file.
Fig. 3
Fig. 3. Rearrangement of the 7TM within the mGlu2-4 heterodimer during activation.
The interface of the 7TM domains of the mGlu2-4 heterodimer in inactive (a) and active (b) state. c Schematic indication of the constructs used in (d). Ctr, mGlu2C1-mGlu4C2 heterodimer. Ctr-CA, Ctr with C121A mutation in mGlu2 and the two C136A and C715A mutations in mGlu4. Ctr-CA+T7937.31C+P8036.55C, Ctr-CA with one additional Cys mutation at residue 793 of mGlu2 and one at residue 803 of mGlu4. d IP1 production in Mock cells, cells transfected with Ctr-CA, or Ctr-CA+T7937.31C+P8036.55C together with Gqi9 and treated with CuP, and without or with Glu treatment. Data points represent mean ± s.e.m. from four independent biological replicates each performed in triplicates and analyzed using one-way ANOVA with Dunnett’s multiple comparison test to determine significance. **P < 0.01, *P < 0.05. P values for (d): 0.0037, 0.0286 (from left to right). Source data are provided as a Source Data file.
Fig. 4
Fig. 4. The partial activation of mGlu2-4 heterodimer due to ligand efficacy.
Side views of the superimposed structures of mGlu2-4 heterodimer in inactive state with two intermediate states, either mGlu2 agonist-bound intermediate state I (a) or mGlu4 agonist-bound intermediate state II (b). Single molecule FRET histograms of mGlu2-4 reorientation sensor in the absence of ligand (Apo) or in the presence of 10 μM L-AP4, 1 μM LY379268 or 10 mM L-Glu without G protein (c) or with G protein (d). FRET histograms show the apparent FRET efficiency (EPR) as the mean ± s.e.m of three independent biological replicates. Histograms display the fitting with four gaussians (white (1) = very low FRET, orange = low FRET, grey = high FRET, white (2) = very high FRET) together with the global fit (black, dotted). The mean high and low FRET efficiencies of the Apo and L-Glu conditions are indicated by dashed lines for comparison. e Fraction of molecules in the active low FRET state without or with G protein. Shown are the means ± SD of at least three independent biological replicates obtained from the number of molecules found in the low FRET population (orange) over the sum of all molecules found in the low FRET (orange) and high FRET (grey) populations. Data were analyzed using one-way ANOVA with a Tukey’s post-hoc multiple comparison test to determine significance. ***P < 0.001, *P < 0.05, not significant (ns) >0.05. P values for (e): Apo no Gi vs Apo + Gi: 0.2319, Apo no Gi vs L-AP4 no Gi: 0.0005, L-AP4 no Gi vs LY379268 no Gi: 0.0346, L-AP4 + Gi vs LY379268 + Gi: 0.1843. Source data are provided as a Source Data file.
Fig. 5
Fig. 5. Conformational change of CRDs within the mGlu2-4 heterodimer during activation.
a Critical residues involved in the interaction between CRD and ECL2 in mGlu2 subunit (left) and mGlu4 subunit (right) in the mGlu2-4G complex. L-AP4 (left) and LY379268 (right) induced G protein activation in mGlu2C1-mGlu4C2 heterodimer (Ctr) without or with the indicated mutations in the CRD and ECL2 of mGlu2 subunit (b) or mGlu4 (c) subunit. Data are normalized by using the maximum response (Emax) of mGlu2-4 Ctr and present as mean ± s.e.m. from at least three independent biological replicates, each performed in triplicate. The indicated number of independent experiments (n): (b), Ctr, E555A-K707A, Q558A-K707A, left: n = 3, 3, 3; right: n = 5, 5, 4; (c), Ctr, E568A-R738A, D563A-Q730A, left: n = 7, 5, 5; right: n = 8, 4, 5. The inserted graphs correspond to representative Emax and analyzed using one-way ANOVA with a Dunnett’s post-hoc multiple comparison test compared with Ctr to determine significance. ****P < 0.0001, ***P < 0.001, **P < 0.01, not significant (ns) >0.05. P values for (b): 0.0015, 0.0030, 0.0003, 0.0004; for (c), 0.0050, <0.0001, 0.0039, 0.8085 (from left to right). Source data are provided as a Source Data file.
Fig. 6
Fig. 6. Conformational change of 7TM within mGlu2-4 heterodimer during activation.
a Comparison of the conformational changes within mGlu4 7TM between mGlu4 subunit in mGlu2-4G complex and mGlu4 subunit in mGlu2G-4 complex (PDB: 8JD5). Left: Side view. Right: magnified view. b Comparison of the conformational changes within mGlu2 7TM between mGlu4 subunit in mGlu2-4G complex and mGlu4 subunit in mGlu2G-4 complex (PDB: 8JD5). Left: Side view. Right: magnified view. c, d Glu-induced G protein activation in mGlu2C1-mGlu4C2 heterodimer (Ctr), mGlu2-2 (WT) or mGlu4-4 homodimer (WT), without or with the indicated mutations in TM3, TM5 and TM6. Data are normalized by using the maximum response (Emax) of Ctr or indicated WT and present as mean ± s.e.m. from at least three independent biological replicates, each performed in triplicate. The indicated number of independent experiments (n): (c), left: Ctr, Y6783.56A, I7725.59A, Y7926.44A, n = 11, 5, 3, 4; right: WT, Y6783.56A, I7725.59A, Y7926.44A, n = 4, 4, 3, 4; (d), left: Ctr, A6583.55Y, F7475.59A, Y7676.44A, n = 7, 4, 5, 4; right: WT, A6583.55Y, F7475.59A, Y7676.44A, n = 9, 7, 4, 6. The inserted graphs correspond to representative Emax and analyzed using one-way ANOVA with a Dunnett’s post-hoc multiple comparison test compared with Ctr or WT to determine significance. ****P < 0.0001, ***P < 0.001, **P < 0.01, *P < 0.05, not significant (ns) >0.05. P values for (c): 0.0080, 0.5383, 0.0304, <0.0001, 0.9794, 0.0001; for (d), 0.9997, 0.2513, 0.9758, <0.0001, 0.0048, 0.0083 (from left to right). Source data are provided as a Source Data file.
Fig. 7
Fig. 7. G protein binding pocket in mGlu2-4 heterodimer.
a Comparison of the Gi binding pocket between mGlu2-4G complex and the mGlu4-4G (PDB: 8JD6). Detailed interactions in mGlu2-4G structure of mGlu4 ICL2 and the intracellular end of TM3 with Gαi3 (b), mGlu4 ICL1 and ICL3 with Gαi3 (c), respectively. d Potency (pEC50) of Glu in mGlu2-4 Ctr and indicated mutants measured by IP1 assay. e Change of IP1 production (referred as Span) in mGlu2-4 Ctr and indicated mutants. Data in (d) and (e) are present as mean ± s.e.m. from at least three independent biological replicates, each performed in triplicate. The indicated number of independent experiments (n): (d), n = 10, 4, 4, 4, 3, 3, 4, 3, 3, 4, 4, 3, 3, 3; (e), n = 10, 4, 5, 5, 3, 4, 4, 3, 3, 5, 4, 3, 5, 3. Data are analyzed using one-way ANOVA with a Dunnett’s post-hoc multiple comparison test compared with Ctr to determine significance. ****P < 0.0001, ***P < 0.001, **P < 0.01, *P < 0.05, not significant (ns) >0.05. nd, not determined (data for which a robust concentration response curve or plateau could not be established within the concentration range tested). P values for (d): 0.9266, 0.1049; for (e): 0.0138, 0.0006, 0.0004, 0.8300, 0.1592, 0.0134, 0.0039, 0.0284, <0.0001, 0.0008, 0.0076, 0.0001, 0.0187 (from left to right). Source data are provided as a Source Data file.
Fig. 8
Fig. 8. Conformational change of ICL2 in mGlu2-4G complex.
a Comparison of the conformation of ICL2 in mGlu4 subunit of the mGlu2-4G complex and in mGlu2 subunit in the mGlu2G-4 complex (PDB: 8JD5), which interacts with α5 and αN of Gαi3. b Glu-induced Ca2+ release in mGlu2C1-mGlu4C2 heterodimer with F781S (FS) mutation in mGlu4 subunit (mGlu4C2-FS + mGlu2C1, Ctr), without or with the indicated single mutation (G667W, A668W) or double mutations (G667W-A668W) in mGlu2 ICL2. Data are normalized by using the maximum response (Emax) of Glu in cells transfected with mGlu4C2-FS + mGlu2C1-G667W-A668W and present as mean ± s.e.m. from at least three independent biological replicates, each performed in triplicate. The indicated number of independent experiments (n): Ctr, G667W, A668W, G667W-A668W, n = 6, 6, 5, 7. c Representative Emax of Ca2+ release in (b). d Sequence alignment of the four residues in the top of ICL2 from mGlu 1-8. e Glu-induced Ca2+ release in mGlu2-2 homodimer WT or the indicated mutants. Data are normalized by using the maximum response (Emax) of Glu in cells transfected with mGlu2-2 WT and present as mean ± s.e.m. from at least three independent biological replicates, each performed in triplicate. The indicated number of independent experiments (n): Ctr, G667W, A668W, n = 8, 6, 6. f pEC50 of Glu in mGlu2-2 WT or indicated mutants in (e). Data in (c) and (f) are analyzed using one-way ANOVA with a Dunnett’s post-hoc multiple comparison test compared with Ctr or WT to determine significance. ****P < 0.0001, ***P < 0.001. P values for (c): 0.0004, <0.0001, <0.0001; for (f): < 0.0001, <0.0001 (from left to right). Source data are provided as a Source Data file.
Fig. 9
Fig. 9. Schematic of the sequential conformational changes for mGlu2-4 heterodimer during activation.
Cartoon illustrates activation-related transitions including inter-subunit and intra-subunit from the inactive, through one agonist-bound intermediate state to the agonist, PAM and G protein-bound full active state.

References

    1. Kenakin, T. G protein coupled receptors as allosteric proteins and the role of allosteric modulators. J. Recept. Signal Transduct. Res.30, 313–321 (2010). - PubMed
    1. Kenakin, T. & Miller, L. J. Seven transmembrane receptors as shapeshifting proteins: the impact of allosteric modulation and functional selectivity on new drug discovery. Pharm. Rev.62, 265–304 (2010). - PMC - PubMed
    1. Pin, J. P. & Bettler, B. Organization and functions of mGlu and GABA(B) receptor complexes. Nature540, 60–68 (2016). - PubMed
    1. Gregory, K. J. & Goudet, C. International Union of Basic and Clinical Pharmacology. CXI. Pharmacology, signaling, and physiology of metabotropic glutamate receptors. Pharm. Rev.73, 521–569 (2021). - PubMed
    1. Doumazane, E. et al. A new approach to analyze cell surface protein complexes reveals specific heterodimeric metabotropic glutamate receptors. FASEB J.25, 66–77 (2011). - PubMed

Publication types

Substances

LinkOut - more resources