. 2024 Nov 28;14(1):208.
doi: 10.1038/s41408-024-01185-6.

High level of circulating cell-free tumor DNA at diagnosis correlates with disease spreading and defines multiple myeloma patients with poor prognosis

Affiliations

High level of circulating cell-free tumor DNA at diagnosis correlates with disease spreading and defines multiple myeloma patients with poor prognosis

Marina Martello et al. Blood Cancer J. .

Abstract

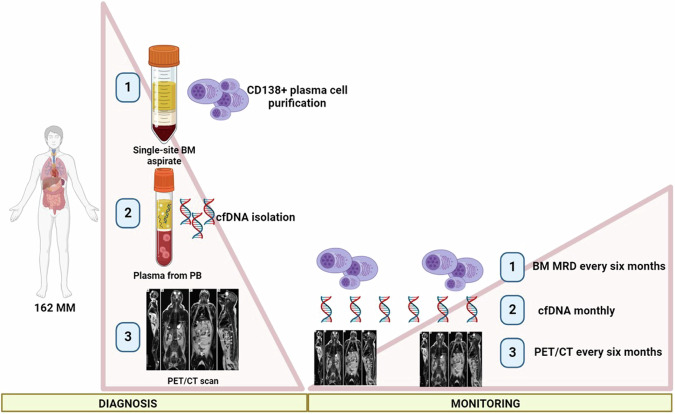
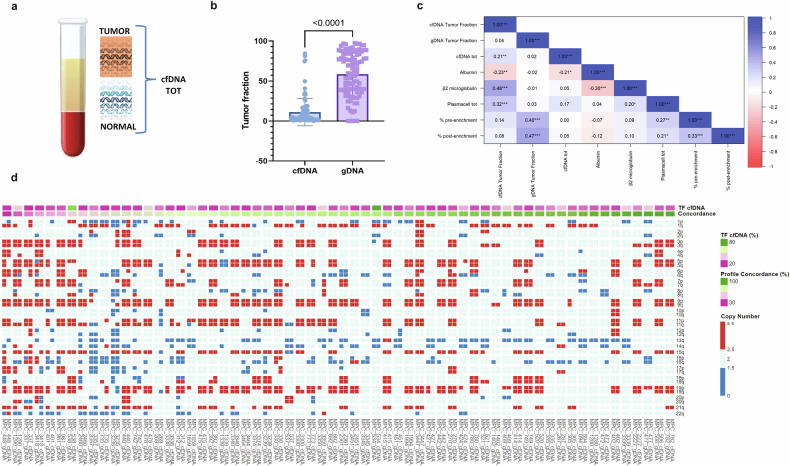
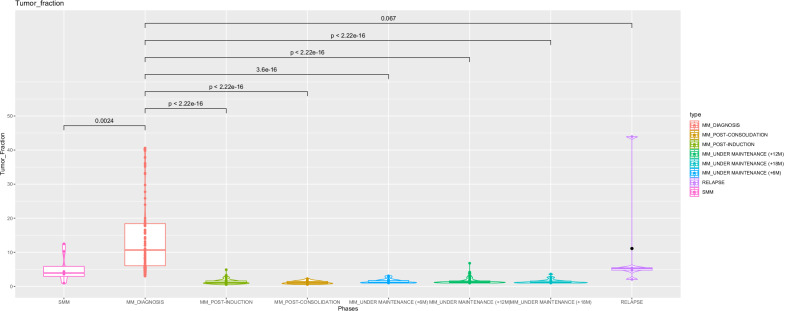
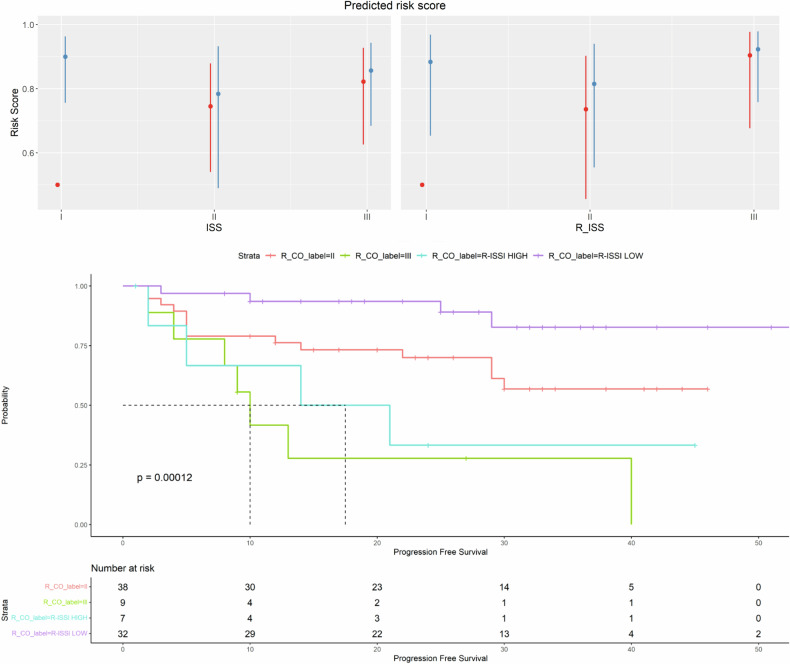
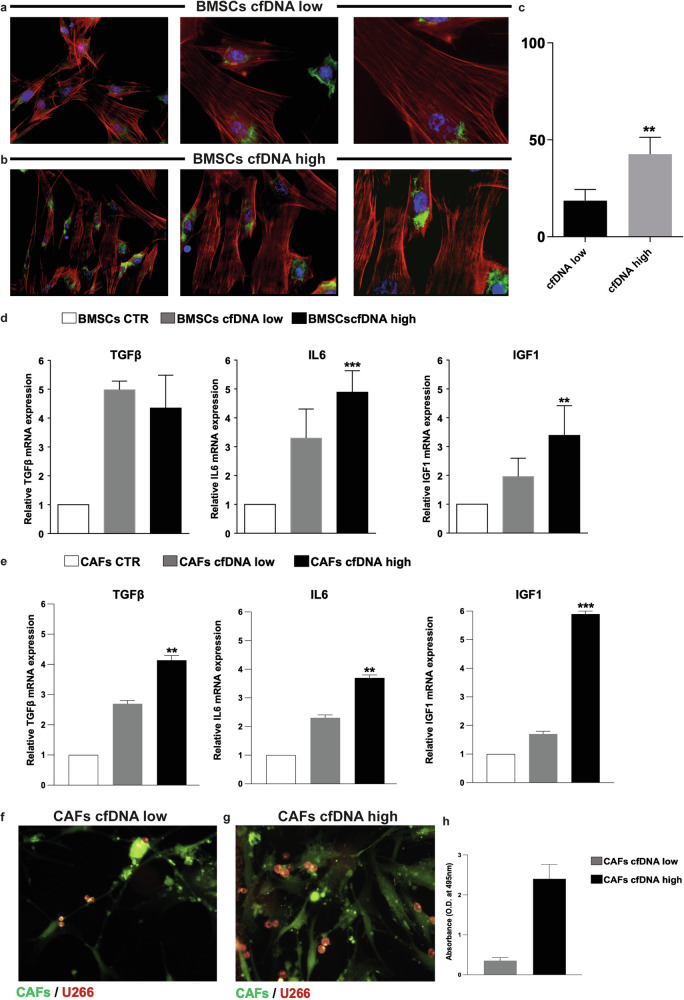
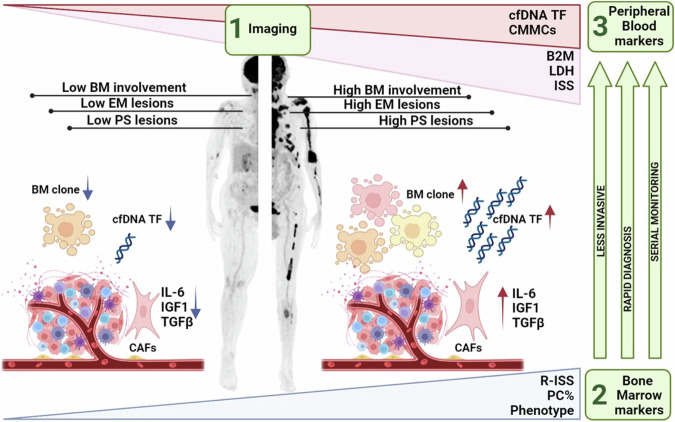
Multiple myeloma (MM) is a plasma cell (PC) disorder characterized by skeletal involvement at the time of diagnosis. Recently, cell-free DNA (cfDNA) has been proven to recapitulate the heterogeneity of bone marrow (BM) disease. Our aim was to evaluate the prognostic role of cfDNA at diagnosis according to disease distribution, and to investigate the role of the MM microenvironment inflammatory state in supplying the release of cfDNA. A total of 162 newly diagnosed MM patients were screened using 18F-FDG PET/CT and assessed by ultra low-pass whole genome sequencing (ULP-WGS). High cfDNA tumor fraction (ctDNA) levels were correlated with different tumor mass markers, and patients with high ctDNA levels at diagnosis were more likely to present with metabolically active paraskeletal (PS) and extramedullary (EM) lesions. Moreover, we demonstrated that microenvironment cancer-associated fibroblast (CAFs)-mediated inflammation might correlate with high ctDNA levels. Indeed, a high cfDNA TF level at diagnosis predicted a poorer prognosis, independent of R-ISS III and 1q amplification; the inclusion of >12% ctDNA in the current R-ISS risk score enables a better identification of high-risk patients. ctDNA can be a reliable and less invasive marker for disease characterization, and can refine patient risk.


Conflict of interest statement

Competing interests: The authors declare no competing interests. Informed consent: All patients provided written informed consent for biological studies (Ethical Committee n. 167/2019/Sper/AUOBo).

Figures

Fig. 1
Fig. 1. Biological samples’ biobanking and timing of MRD monitoring by a trimodality approach.
A specific biological samples’ biobanking has been planned which includes bone marrow (BM) samples and peripheral blood (PB) samples at diagnosis for both CD138+ plasma cells purification and cfDNA isolation, respectively. Moreover, a PET/CT scan has been performed at baseline. To monitor the disease, BM MRD and PET/CT scans have been employed as conventional methods. PB has been collected monthly to isolate plasma for cfDNA. By this trimodality approach, a total of 162 patients have been studied at baseline, and for 22 of them, we have monitored the disease after therapy. Created with BioRender.com.
Fig. 2
Fig. 2. cfDNA tumor fraction as a surrogate of tumor mass index and proxy of genomic complexity.
a Cartoon representing that cell-free DNA included both DNA fragments from normal cells (total cfDNA) and fragments from tumoral cells (ctDNA). b Box plot representing cfDNA tumor fraction (ctDNA TF) median amount in the blood as compared to median gDNA TF in the bone marrow: ctDNA TF is significantly lower than gDNA TF; however, they are strictly correlated. c Correlation matrixes demonstrating that ctDNA is correlated to some MM tumor mass markers, with significant correlation observed for b2-microglobulin, albumin, and total bone marrow plasma cells, similarly observed for the gDNA tumor fraction. Conversely, the total cfDNA is less correlated with tumor mass since it can depend on other non-disease-related factors. d Brick plot illustrating the comparison between the CNVs profiles derived both from BM gDNA and from cfDNA, by two-site analysis, to investigate the degree of similarity between the two tissues. A percentage of concordance between cfDNAs and gDNAs clonal CNVs was calculated, as expressed by the ratio between the number of concordant segments and the total segments’ number: most patients displayed high concordance between CNVs, as identified in both tissues (46/62 = 75.4%; concordance >75%), whereas a small proportion of patients had slightly similar genomic profiles (16/62 = 26.2%; concordance <75%).
Fig. 3
Fig. 3. ctDNA can resume the neoplastic clones’ dynamic.
cfDNA TF values fluctuation throughout the different disease phases, from SMM to MM and under therapy, post-induction, post-consolidation and under maintenance (three time-points: +6 months, +12 months, +18 months).
Fig. 4
Fig. 4. Interaction model between risk scores and ctDNA to determine its contribution to patients' risk status definition.
An improved risk definition was achieved by integrating the high-low cfDNA tumor fraction stratification to the R-ISS score levels, highlighting that R-ISS I patients with high ctDNA (i.e., ≥12%) had a progression-free survival time similar to that of R-ISS III patients (R-ISS I high ctDNA vs. R-ISS III median PFS months: 17.5 vs. 10 months; p = ns). R_CO: variable cut-off >12% ctDNA tumor fraction.
Fig. 5
Fig. 5. Growth factors and cytokines differential expression in bone marrow microenvironment from MM patients with low vs high cfDNA/ A CAFs-mediated inflammatory state in patients with high cfDNA release.
ac Immunofluorescence analysis, validation of increased IL-6 expression (green) in BMSCs isolated from a representative MM patient with cfDNA low (a) vs cfDNA high (b) ones at different magnifications. Cytoskeleton were labeled with phalloidin (red) and nuclei were stained using DAPI (blue). Results, expressed as mean fluorescence intensity (MFI) percentage (c), suggest that the presence of high levels of IL-6 in the cfDNA high cases may promote a more aggressive microenvironment. Original magnification ×20, ×40, ×63, scale bar = 25 μm. **p ≤ 0.0015. d, e qRT-PCR analysis of TGFβ, IL-6, and IGF1 mRNA expression in bone marrow stromal cells (BMSCs) (d) and in related cancer-associated fibroblasts (CAFs) (e) isolated from MM patients with cfDNA low (n = 8) and cfDNA high (n = 8), respectively. Data were expressed as mean ± SD. **p ≤ 0.0015; ***p ≤ 0.0008. fh CAFs isolated from cfDNA high MM patients have a greater protective capacity towards MM-PCs compared to CAFs isolated from cfDNA low ones. Representative images of CAFs isolated from cfDNA low case co-cultured with MM1S (f) versus CAFs isolated from cfDNA high case co-cultured with MM1S (g). CAFs were labeled with CFSE (green), and MM1S were labeled with Dil (red). Quantification of the interaction between CAFs and MM cells, as measured by the percentage of Dil-positive MM cells that were in close proximity (within 50 μm) to CFSE-positive CAFs. The cfDNA high case showed a higher percentage of MM cells in close proximity to CAFs compared to the cfDNA low case. These results suggest that the presence of high levels of cfDNA in the cfDNA high case may promote a tighter interaction between CAFs and MM cells, potentially contributing to disease progression in MM. Original magnification 40X, scale bar 25 μm. Results were validated with an adhesion assay of MM1S (h) stained with Calcein-AM plated for 24 h on CAFs isolated from patients with cfDNA low (n = 6) and with cfDNA high (n = 6). Data were expressed as mean ± SD. *p < 0.002 and **p < 0.005 by Wilcoxon signed-rank test. BMSCs bone marrow stromal cells, CAFs cancer-associated fibroblasts.
Fig. 6
Fig. 6. MM patients’ risk definition by a trimodality approach.
To best characterize the risk of progression of MM patients, the disease must be studied at three levels: in the bone marrow (R-ISS3 and cytogenetics), in the whole body (paraskeletal and extramedullary lesions), and in peripheral blood (ctDNA), enabling to face with the multilayer disease heterogeneity.

References

    1. Kumar SK, Rajkumar SV, Dispenzieri A, Lacy MQ, Hayman SR, Buadi FK, et al. Improved survival in multiple myeloma and the impact of novel therapies. Blood. 2008;111:2516–20. - PMC - PubMed
    1. Rodriguez-Otero P, Paiva B, San-Miguel JF. Roadmap to cure multiple myeloma. Cancer Treat Rev. 2021;100:102284. - PubMed
    1. Neri P, Bahlis NJ, Lonial S. New strategies in multiple myeloma: immunotherapy as a novel approach to treat patients with multiple myeloma. Clin Cancer Res. 2016;22:5959–65. - PubMed
    1. Mohan M, Hari P, Dhakal B. Immunotherapy in multiple myeloma-time for a second major paradigm shift. JCO Oncol Pract. 2021;17:405–13. - PubMed
    1. Romano A, Palumbo GA, Parrinello NL, Conticello C, Martello M, Terragna C. Minimal residual disease assessment within the bone marrow of multiple myeloma: a review of caveats, clinical significance and future perspectives. Front Oncol. 2019;9:699. - PMC - PubMed

Publication types