. 2024 Nov 28;15(1):10350.
doi: 10.1038/s41467-024-54411-x.

E3 ubiquitin ligase RNF10 promotes dissociation of stalled ribosomes and responds to ribosomal subunit imbalance

Affiliations

E3 ubiquitin ligase RNF10 promotes dissociation of stalled ribosomes and responds to ribosomal subunit imbalance

Janina A Lehmann et al. Nat Commun. .

Abstract

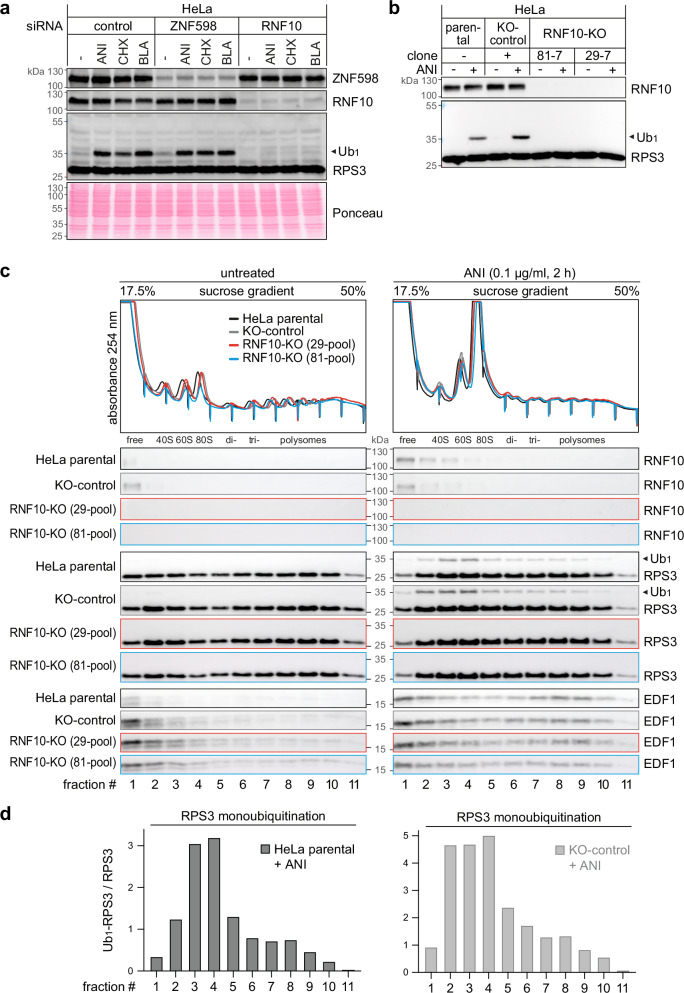
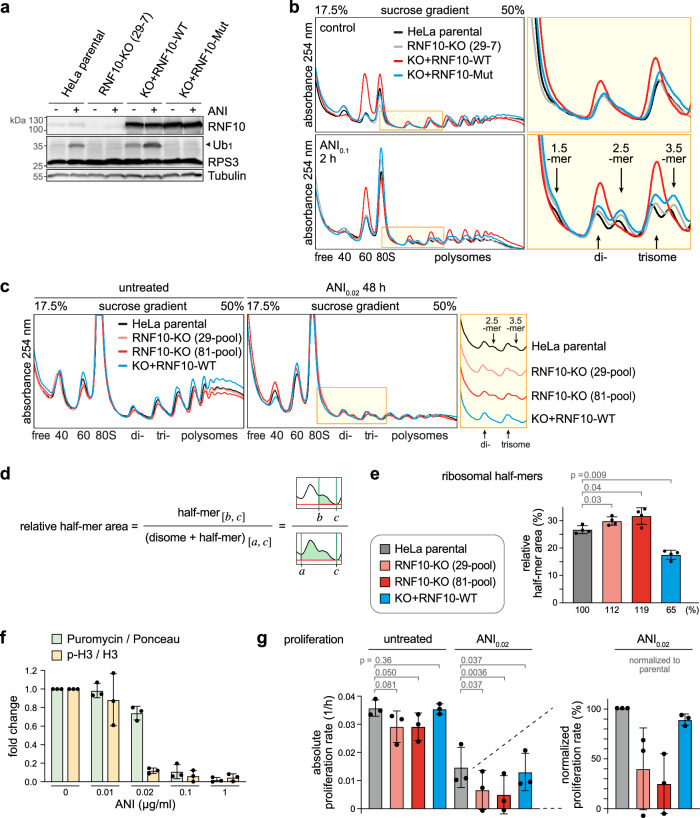
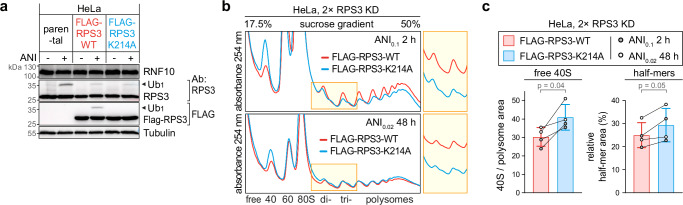
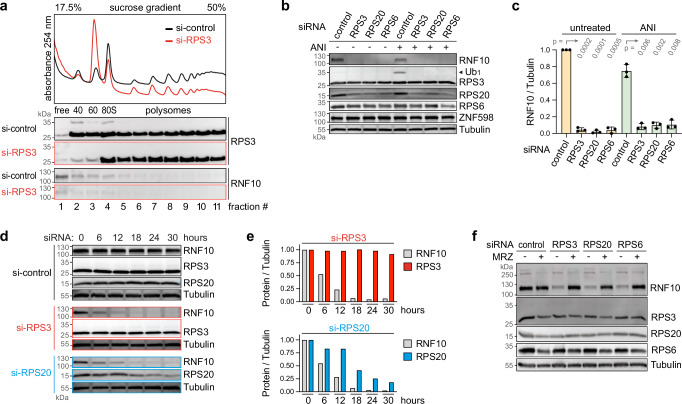
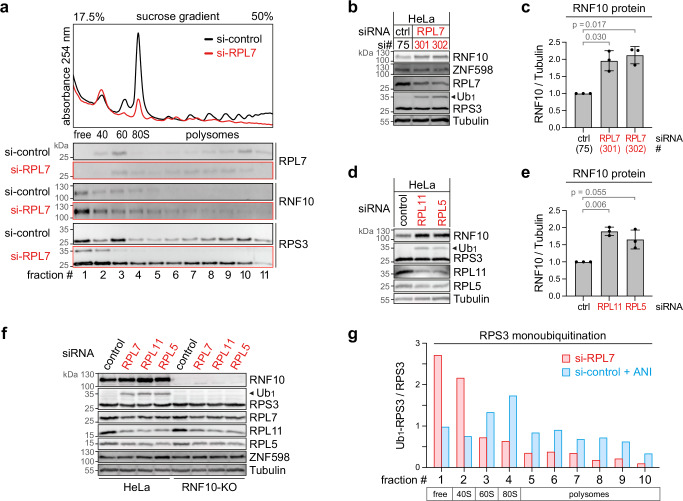
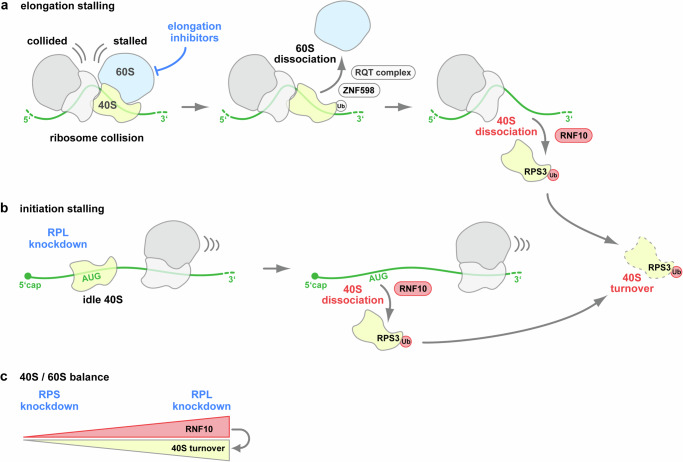
Aberrant translation causes ribosome stalling, which leads to the ubiquitination of ribosomal proteins and induces ribosome-associated quality control. As part of this quality control process, the E3 ubiquitin ligase RNF10 monoubiquitinates ribosomal protein RPS3. Here, we demonstrate that RNF10-mediated RPS3 monoubiquitination antagonizes ribosomal half-mer formation by promoting dissociation of 40S subunits from ribosomes stalled during translation elongation. Interestingly, RNF10 also promotes dissociation of 40S subunits stalled during aberrant translation initiation. Moreover, RNF10 levels are tightly coupled to the amount of 40S subunits. Knockdown of RPS proteins, which abrogates 40S ribosome biogenesis, results in proteasomal degradation of RNF10. Vice versa, knockdown of RPL proteins, which abrogates 60S biogenesis, leads to the accumulation of stalled initiating 40S subunits, increased RNF10 levels, and RPS3 monoubiquitination. As a factor required for the resolution of stalled translation events, RNF10 is part of a fundamental mechanism by which cells respond to imbalances in ribosomal subunit stoichiometry.


Conflict of interest statement

Competing interests: The authors declare no competing interests.

Figures

Fig. 1
Fig. 1. RPS3 monoubiquitination by RNF10 upon translation elongation stalling.
a Following control KD, KD of ZNF598 (S193) or KD of RNF10 (S214) for 72 h, HeLa cells were treated for 2 h with translation elongation inhibitors anisomycin (ANI, 0.1 µg/ml), cycloheximide (CHX, 100 µg/ml), or blasticidine (BLA, 100 µg/ml). RPS3 monoubiquitination (Ub1) was assessed by Western blot analysis. b Western blot analysis showing the effect of ANI treatment (2 h, 0.1 µg/ml) on Ub1-RPS3 in RNF10-KO HeLa cells (clones 81-7 and 29-7) compared to parental HeLa cells or a KO-control clone. The blot is representative of 3 independent experiments. c Polysome profile and fractionation analysis of HeLa RNF10-KO cell pools; the distribution of RNF10 and Ub1-RPS3 in the absence and presence of ANI treatment (2 h, 0.1 µg/ml) was assessed by Western blot analysis. Sharp peaks pointing downwards are artefacts of the electric signal of the fractionator. d The Ub1-RPS3 / RPS3 ratio (n = 1 biological replicate) in parental and KO-control HeLa cells in the presence of ANI was calculated by quantification of Western blots in panel (c). Source data are provided as a Source Data file.
Fig. 2
Fig. 2. Suppression of ribosomal half-mer formation by RNF10.
a Western blot analysis of Ub1-RPS3 in HeLa-RNF10-KO cells stably expressing HA-RNF10-WT (KO+RNF10-WT) or HA-RNF10-Mut (C225S/C228S; KO+RNF10-Mut), ± intermediate dose ANI treatment (2 h, 0.1 µg/ml); Tubulin serves as loading control. The blot is representative of 2 independent experiments. b The same cells as in panel (a) were subjected to polysome profile analysis; the yellow area is enlarged on the right side. c Polysome profiles of parental HeLa cells, HeLa-RNF10-KO pools and HeLa-KO+RNF10-WT cells, ± low dose ANI treatment (48 h, 0.02 µg/ml); profiles are shown separately in the yellow area. d Formula and illustration for the quantification of ribosomal half-mers; half-mer area [b, c] and (disome + half-mer) area [a, c] are shown in green; baseline of the polysome profile in red. e Ribosomal half-mers (2.5 mer / disome ratio) from polysome profiles as in panel (c) were quantified according to panel (d), shown are mean values ± SD (n = 4 biological replicates; p-values determined by two-tailed, paired t-test). f HeLa cells were exposed to increasing concentrations of ANI for 2 h, followed by measurement of total protein synthesis by puromycin incorporation, and assessment of proliferation by monitoring phosphorylation of histone H3 at serine 10. Shown are mean values ± SD (n = 3 biological replicates) based on the quantification of Western blots as in (Supplementary Fig. 2g). g Absolute proliferation rate (left) and relative proliferation rate (right) of parental HeLa cells, HeLa-RNF10-KO pools and HeLa-KO+RNF10-WT cells, ± low dose ANI treatment (72 h, 0.02 µg/ml); color code as in panel (e). Shown are mean values ± SD (n = 3 biological replicates; p-values determined by one-tailed, paired t-test). Source data are provided as a Source Data file.
Fig. 3
Fig. 3. RPS3 ubiquitination at K214 promotes dissociation of stalled 40S subunits.
a FLAG-RPS3-WT and FLAG-RPS3-K214A were stably expressed in HeLa cells, and Ub1-RPS3, ± ANI treatment (2 h, 0.1 µg/ml), was assessed by Western blot analysis; Tubulin serves as loading control. The blot is representative of 3 independent experiments. b Polysome profile analysis of cells as in panel (a) after KD of RPS3 (siRNA S292) on day 1 followed by a second KD of RPS3 on day 3. Polysome profiles were recorded on day 5 after intermediate-dose ANI treatment (2 h, 0.1 µg/ml) or on day 6 after low-dose ANI treatment (for 48 h from day 4–6, 0.02 µg/ml). c Free 40S subunits and ribosomal half-mers (2.5 mer / disome) were quantified from polysome profiles as in panel (b) by calculating the ratio of the corresponding areas under the curve; shown are mean values ± SD (n = 4 biological replicates; p-values determined by two-tailed, paired t-test). Source data are provided as a Source Data file.
Fig. 4
Fig. 4. Proteasomal degradation of RNF10 upon RPS KD.
a Polysome profile and fractionation analysis of HeLa cells 16 h after KD of RPS3 (siRNA S292) in comparison to control KD (S75); the distribution of RPS3 and RNF10 was assessed by Western blot analysis. The blot is representative of one experiment. b Western blot analysis of RNF10 and Ub1-RPS3 in HeLa cells 24 h after control KD (siRNA S75) in comparison to KD of RPS3 (S292), RPS20 (S297) and RPS6 (S299), ± ANI treatment (2 h, 0.1 µg/ml). c RNF10 protein levels were quantified from Western blots as in panel (b), shown are mean values ± SD (n = 3 biological replicates; p-values determined by two-tailed, paired t-test). d Western blot analysis for RNF10, RPS3 and RPS20 was carried out 0, 6, 12, 18, 24 and 30 h after control KD (S75), KD of RPS3 (S292) or KD of RPS20 (S297) in HeLa cells. e RNF10, RPS3 and RPS20 protein levels were quantified from the Western blot in panel (d) (n = 1 biological replicate). f Western blot analysis of RNF10 6 h after control KD (S75) or KD of RPS3 (S292), RPS20 (S297) or RPS6 (S299), ± simultaneous treatment with the proteasome inhibitor marizomib (MRZ, 6 h, 100 nM). The blot is representative of one experiment. In panels (bf), Tubulin serves as loading control. Source data are provided as a Source Data file.
Fig. 5
Fig. 5. Accumulation of RNF10 upon RPL KD.
a Polysome profile and fractionation analysis of HeLa cells 16 h after KD of RPL7 (siRNA S301) in comparison to control KD (S75); the distribution of RPS3 and RNF10 was assessed by Western blot analysis. The blot is representative of 3 independent experiments. b Western blot analysis of RNF10 and Ub1-RPS3 in HeLa cells 24 h after KD of RPL7 using two different siRNAs in comparison to control KD. c RNF10 protein levels were quantified from Western blots as in panel (b), shown are mean values ± SD (n = 3 biological replicates; p-values determined by two-tailed, paired t-test). d Western blot analysis of RNF10 and Ub1-RPS3 in HeLa cells 24 h after KD of RPL11 (S304) and RPL5 (S310) in comparison to control KD (S75). e RNF10 protein levels were quantified from Western blots as in panel (d), shown are mean values ± SD (n = 3 biological replicates; p-values determined by two-tailed, paired t-test). f Western blot analysis of RNF10 and Ub1-RPS3 in HeLa and HeLa-RNF10-KO cells 24 h after KD of RPL7 (S301), RPL11 (S304) or RPL5 (S310) in comparison to control KD (S75). The blot is representative of one experiment. g The ratio of Ub1-RPS3 / RPS3 protein levels (n = 1 biological replicate) in parental HeLa cells 24 h after KD of RPL7 (S301) or control KD (S75) was calculated by quantification from Western blots in (Supplementary Fig. 5d). In panels (bf), Tubulin serves as loading control. Source data are provided as a Source Data file.
Fig. 6
Fig. 6. Transcription factor p53 does not control RNF10 expression.
a Western blot analysis of RNF10 and Ub1-RPS3 in HCT116 p53+/+ and p53-/- cells 24 h after KD of RPS3 (siRNA S292), RPS20 (S297), RPS6 (S299) and RPL7 (S301) in comparison to control KD (S75); Tubulin and Ponceau staining serve as loading controls. b RNF10 protein levels were quantified from Western blots as in panel (a), shown are mean values ± SD (n = 3 biological replicates; p-values determined by two-tailed, paired t-test). Source data are provided as a Source Data file.
Fig. 7
Fig. 7. RNF10 promotes 40S dissociation upon RPL KD.
a Polysome profile analysis of HeLa, HeLa-KO+RNF10-WT and HeLa-KO+RNF10-Mut (C225S/C228S) cells 16 h after KD of RPL7 (siRNA S301) or RPL11 (S304) in comparison to control KD (S75); the yellow area is enlarged on the right side. b Ribosomal half-mers (2.5-mer/disome ratio) were quantified from polysome profiles as in panel (a), shown are mean values ± SD (n = 3 biological replicates; p-values determined by two-tailed, paired t-test). c Polysome profile analysis in parental HeLa cells and HeLa-KO+RNF10-WT cells following KD of RPL7 (S301) for different periods of time; profiles are shown separately in the yellow area on the right side. Source data are provided as a Source Data file.
Fig. 8
Fig. 8. Model of RNF10 promoting half-mer dissociation of stalled 40S subunits during translation elongation or initiation.
a Translation elongation inhibition leads to stalling and collision of elongating ribosomes. As a consequence, small ribosomal proteins are ubiquitinated by ZNF598, which leads to dissociation of the stalled 60S subunit and to a 80S-40S half-mer intermediate that remains associated with the mRNA. Monoubiquitination of ribosomal RPS3 by RNF10 then leads to dissociation of the 40S subunit from the half-mer intermediate. b Knockdown of large ribosomal proteins (RPL) leads to initiating 40S subunits waiting for 60S subunit joining at the start codon (AUG). These stalled initiating 40S subunits are monoubiquitinated on RPS3 by RNF10, promoting their dissociation from the mRNA. Following dissociation, 40S subunits monoubiquitinated on RPS3 are subjected to turnover. c RNF10 protein levels are downregulated after RPS KD and upregulated after RPL KD. This regulatory mechanism helps to maintain the stoichiometric balance between 40S and 60S subunits through RNF10-induced 40S turnover.

References

    1. Tahmasebi, S., Khoutorsky, A., Mathews, M. B. & Sonenberg, N. Translation deregulation in human disease. Nat. Rev. Mol. Cell Biol.19, 791–807 (2018). - PubMed
    1. Song, P., Yang, F., Jin, H. & Wang, X. The regulation of protein translation and its implications for cancer. Signal Transduct. Target Ther. 6, 68 (2021). - PMC - PubMed
    1. Joazeiro, C. A. P. Ribosomal stalling during translation: providing substrates for ribosome-associated protein quality control. Annu. Rev. Cell Dev. Biol.33, 343–368 (2017). - PubMed
    1. Ikeuchi, K., Izawa, T. & Inada, T. Recent progress on the molecular mechanism of quality controls induced by ribosome stalling. Front. Genet.9, 743 (2018). - PMC - PubMed
    1. Chandrasekaran, V. et al. Mechanism of ribosome stalling during translation of a poly(A) tail. Nat. Struct. Mol. Biol.26, 1132–1140 (2019). - PMC - PubMed

Publication types

MeSH terms

LinkOut - more resources