. 2024 Nov 28;15(1):10343.
doi: 10.1038/s41467-024-54355-2.

C/EBPβ-dependent autophagy inhibition hinders NK cell function in cancer

Affiliations

C/EBPβ-dependent autophagy inhibition hinders NK cell function in cancer

Federica Portale et al. Nat Commun. .

Abstract

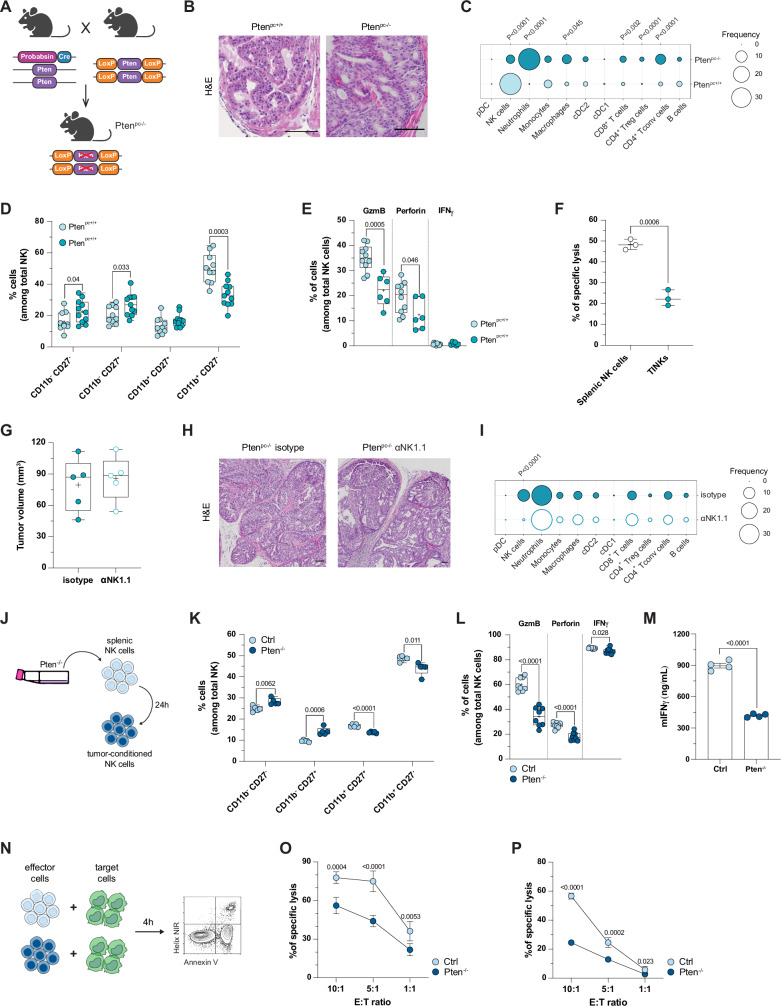
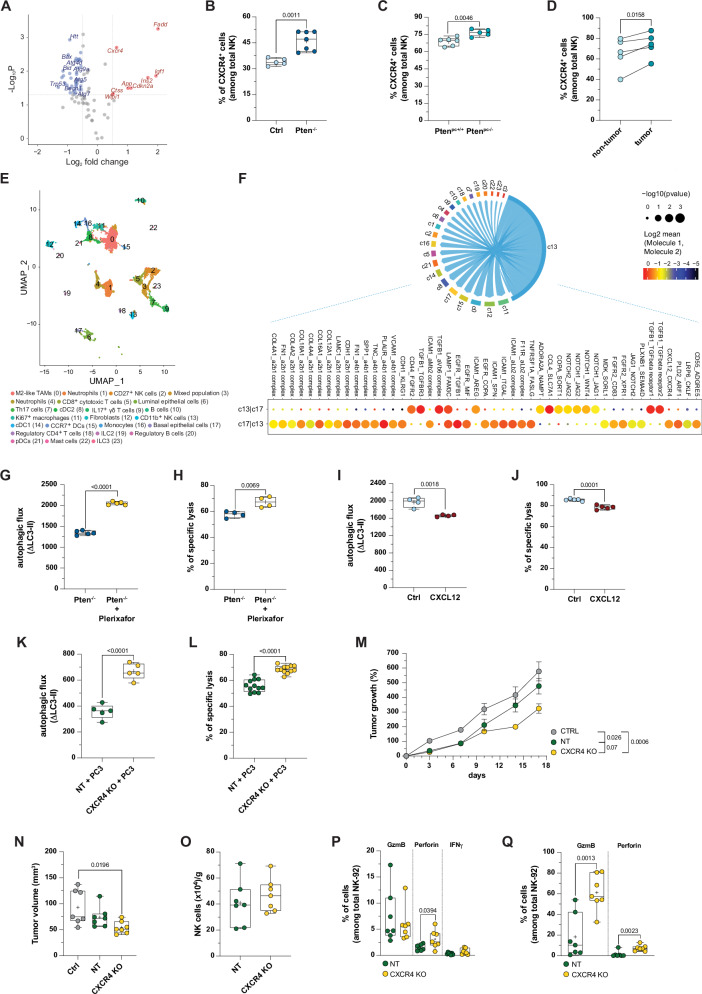
NK cells are endowed with tumor killing ability, nevertheless most cancers impair NK cell functionality, and cell-based therapies have limited efficacy in solid tumors. How cancers render NK cell dysfunctional is unclear, and overcoming resistance is an important immune-therapeutic aim. Here, we identify autophagy as a central regulator of NK cell anti-tumor function. Analysis of differentially expressed genes in tumor-infiltrating versus non-tumor NK cells from our previously published scRNA-seq data of advanced human prostate cancer shows deregulation of the autophagic pathway in tumor-infiltrating NK cells. We confirm this by flow cytometry in patients and in diverse cancer models in mice. We further demonstrate that exposure of NK cells to cancer deregulates the autophagic process, decreases mitochondrial polarization and impairs effector functions. Mechanistically, CCAAT enhancer binding protein beta (C/EBPβ), downstream of CXCL12-CXCR4 interaction, acts as regulator of NK cell metabolism. Accordingly, inhibition of CXCR4 and C/EBPβ restores NK cell fitness. Finally, genetic and pharmacological activation of autophagy improves NK cell effector and cytotoxic functions, which enables tumour control by NK and CAR-NK cells. In conclusion, our study identifies autophagy as an intracellular checkpoint in NK cells and introduces autophagy regulation as an approach to strengthen NK-cell-based immunotherapies.


Conflict of interest statement

Competing interests: T. Tonn is named as an inventor on patents in the field of cancer immunotherapy. The remaining authors declare no competing interests. Ethics statement: This study adheres to the principles outlined in the Declaration of Helsinki and the ethical standards set by our Institution. All human participants provided informed consent, and animal experiments were conducted with approval from the Institutional Animal Care. We promote diversity, equity, and inclusion in research, and we have disclosed any potential conflicts of interest.

Figures

Fig. 1
Fig. 1. Altered phenotype and attenuated cytotoxicity of NK cells in the prostate tumor microenvironment.
A Breeding scheme for the establishment of the Pten knockout (Ptenpc−/−) mouse model. B Hematoxylin and eosin staining of prostate tissues from Ptenpc+/+ and Ptenpc−/− mice. Original magnification, ×20. Scale bar: 100 μm. Representative of an experiment of n = 4 mice/group. C Bubble plot showing the average frequency, referred to CD45+ live cell gate, of immune cell subsets in Ptenpc+/+ and Ptenpc−/− prostate (n = 4 mice/group). D Flow cytometry analysis of NK cell maturation in Ptenpc+/+ and Ptenpc−/− prostate (n = 10 mice/group). E Flow cytometry analysis of effector molecule expression in NK cells in Ptenpc+/+ and Ptenpc−/− prostate, according to gating strategy in S1G (n = 10 Ptenpc+/+ mice/group, n = 6 Ptenpc−/− mice/group). F Cytotoxicity of sorted splenic NK cells from Ptenpc+/+ mice and tumor-infiltrating NK cells from Ptenpc−/− mice (three different mice/conditions). G Tumor volume. n = 5 mice/group. H Hematoxylin and eosin staining of prostate tissues from αNK1.1 or isotype-treated mice. Original magnification, ×20. Scale bar: 100 μm. I Bubble plot showing the average frequency, referred to CD45+ live cell gate, of immune cell subsets in Ptenpc−/− prostate of αNK1.1 or isotype-treated mice (n = 5 mice/group). J Experimental scheme for tumor-conditioned NK cell generation. K Flow cytometry analysis of NK cell maturation in tumor-conditioned and control NK cells (n = 5 biological replicates, independently collected batches of tumor-conditioned medium). L Flow cytometry analysis of effector molecule expression in tumor-conditioned and control NK cells (n = 8 biological replicates, data pooled from two independent experiments). M Quantification of IFNγ release (n = 4 biological replicates/group). N Experimental scheme for cytotoxicity assay. O, P Cytotoxicity of tumor-conditioned and control NK cells against YAC-1 (O) and Pten−/− (P) target cells (n = 6 biological replicates, independently collected batches of tumor-conditioned medium). Data in C and I are presented as bubble plot showing average values; two-tailed unpaired t test. Data in (D), (E), (G), (K), and (L) are presented as Min to Max box-and-whisker plot, the box extends from the 25th to 75th percentiles and the whiskers reach the sample maximum and minimum values, the median is indicated at center line and the mean value is indicated as “+”; two-tailed unpaired t test. Data in (F) are presented as scatter plot mean ± SEM; two-tailed unpaired t test. Data in (M) are presented as scatter plot with bar with mean ± SEM; two-tailed unpaired t test. Symbols in (O) and (P) represent mean and error bars indicate SEM; two-tailed unpaired t test for corresponding E:T ratio.
Fig. 2
Fig. 2. Autophagy is defective in tumor-infiltrating NK cells.
A Graph showing the frequency of NK cells, referred to CD45+ live cell gate, in tumor vs non-tumor samples (n = 10 samples/group) as determined by flow cytometry. B Dot plots of GSEA results illustrating the significant top 15 REACTOME pathways in tumor vs non-tumor NK cells (n = 3 samples/group). C Dot plot showing the proportion of normal and tumor NK cells expressing autophagy induction list genes, according to their average expression. D Graph showing the Median Fluorescence Intensity (MFI) of CYTO-ID on human NK cells in tumor vs non-tumor samples (n = 10 samples/group). E UMAP of NK cell populations in prostate (tumor and normal adjacent tissue), showing the formation of seven main clusters identified by marker genes. F Heat map showing scaled expression of the top 10 marker genes, for each NK cell cluster. G Contour plots of NK cell maturation status in tumor vs non-tumor samples, gated on CD3 CD56+ cells. H Flow cytometry analysis of NK cell main subsets in tumor vs non-tumor samples, according to the gates shown in G. I Graph showing the MFI of CYTO-ID on mouse NK cells in Ptenpc+/+ and Ptenpc−/− prostates (n = 11 mice/group). J Graph showing the frequency of LC3B+ cells in mouse NK cells in Ptenpc+/+ and Ptenpc−/− prostates (n = 9 Ptenpc+/+ mice/group, n = 6 Ptenpc−/− mice/group). Data in (A), (D), (H), and (I) are presented as before-after plot; two-tailed paired t test. Data in (B) are presented as balloon plot; permutation test. Data in (J) are presented as Min to Max box-and-whisker plot, the box extends from the 25th to 75th percentiles and the whiskers reach the sample maximum and minimum values, the median is indicated at center line and the mean value is indicated as “+”; two-tailed unpaired t test.
Fig. 3
Fig. 3. Functional defects of tumor-exposed NK cells are restored by pharmacological and genetic activation of autophagy.
A Graph showing the ΔMFI of CYTO-ID (autophagic flux) on murine NK cells in tumor-conditioned and control condition (n = 7 biological replicates, data pooled from four independent experiments). B Histograms of lipidated LC3 staining in tumor-conditioned and control murine NK cells, with or without Reagent A (RA). C Graph showing the ΔMFI of LC3-II (autophagic flux) on murine NK cells in tumor-conditioned and control condition (n = 4 biological replicates, independently collected batches of tumor-conditioned medium). D Graph showing the autophagic flux on human NK-92 cells in tumor-conditioned and control condition (n = 4 replicates, results are representative of three independent experiments with similar results). E Histograms of LC3-II staining in tumor-conditioned and control NK-92 cells, with or without RA. F Graph showing the autophagic flux on NK-92 cells (n = 5 biological replicates, independently collected batches of tumor-conditioned medium). G, H Representative western blot image (G) and relative quantification (H) of LC3-II expression in NK-92 cells exposed to control or tumor-conditioned medium, with or without Chloroquine (CQ). β-actin was used as loading control (n = 6 biological replicates). I Cytotoxicity of control or tumor-conditioned NK cells, in presence or absence of Metformin, against YAC-1 target cells (n = 4 biological replicates, independently collected batches of tumor-conditioned medium). J Cytotoxicity of NK-92 cells, treated or not with tumor-conditioned medium, with or without Metformin, against PC3 target cells (n = 8 biological replicates, data pooled from two independent experiments). K Relative fold change of key autophagy-related genes in Beclin 1 overexpressing (BECN1 OE) NK-92 cells (n = 6 replicates, data pooled from two independent experiments). L, M Western blot analysis (L) and relative quantification (M) of BECN1 expression in scramble and BECN1 OE NK-92 cells. HSP90 was used as loading control (n = 4 biological replicates). N Graph showing the autophagic flux on scramble and BECN1 OE NK-92 cells, in tumor-conditioned and control condition (n = 4 biological replicates, independently collected batches of tumor-conditioned medium). O Cytotoxicity of scramble and BECN1 OE NK-92 cells, treated or not with tumor-conditioned medium, against PC3 target cells (n = 10 biological replicates, data pooled from two independent experiments). P Representative images of mitochondria in NK-92 cells treated or not with tumor-conditioned medium. Q Quantification of damaged mitochondria in NK-92 cells exposed or not to tumor-conditioned medium; more than 250 mitochondria in at least 25 different cells for each experimental group were analyzed. R Graph showing the levels of mitochondrial membrane potential (Δψm) in NK-92 cells, exposed or not to tumor-conditioned medium (n = 10 biological replicates, independently collected batches of tumor-conditioned medium). S Graph showing the proportion of MitoSox+ NK-92 cells exposed or not to tumor-conditioned medium (n = 5 biological replicates, independently collected batches of tumor-conditioned medium). T Graph showing TMRM incorporation in scramble and BECN1 OE NK-92 cells, exposed or not to tumor-conditioned medium (n = 8 biological replicates, independently collected batches of tumor-conditioned medium). U Graph showing the proportion of MitoSox+ scramble and BECN1 OE NK-92 cells exposed or not to tumor-conditioned medium (n = 6 biological replicates, independently collected batches of tumor-conditioned medium). Data in (A), (C), (D), (F), (H) and (Q–S) are presented as Min to Max box-and-whisker plot, the box extends from the 25th to 75th percentiles and the whiskers reach the sample maximum and minimum values, the median is indicated at center line and the mean value is indicated as “+”; two-tailed unpaired t test. Data in (I), (J), (N), (O), (T), and (U) are presented as Min to Max box-and-whisker plot, the box extends from the 25th to 75th percentiles and the whiskers reach the sample maximum and minimum values, the median is indicated at center line and the mean value is indicated as “+”; one-way ANOVA test with Holm–Šídák’s multiple-comparisons test. Data in (K) and (M) are presented as scatter plot with mean ± SEM; two-tailed unpaired t test.
Fig. 4
Fig. 4. Pharmacological and genetic activation of autophagy enhances the cytolytic activity of NK cells in vivo.
A Tumor model and treatment scheme of tumor-bearing mice with NK cells, treated or not with Metformin. B, C Tumor growth curves (B) and tumor volume at the end of the experiment (C) referred to mice treated as described in A (n = 5 control, n = 10 untreated NK cells, n = 12 Metformin-treated NK cells). DF Graphs showing NK cell maturation status (D), frequency of LC3B+ cells (E), and effector molecule expression in tumor-infiltrating NK cells. n = 9 mice NK cells, n = 11 mice Metformin-treated NK cells. G Tumor model and treatment scheme of tumor-bearing mice with NK-92 cells, treated or not with Metformin. H, I Tumor growth curves (H) and tumor volume at the end of the experiment (I) referred to mice treated as described in G (n = 11 control, n = 11 NK-92 cells, n = 12 Metformin-treated NK-92 cells, data pooled from two independent experiments). J, K Graph showing the absolute number (J) and effector function expression (K) of tumor-infiltrating NK-92 cells. n = 11 control, n = 11 NK-92 cells, n = 12 Metformin-treated NK-92 cells. L, M Tumor growth curves (L) and tumor volume at the end of the experiment (M) referred to mice treated as described in G (n = 9 scramble NK-92 cells, n = 9 BECN1 overexpressing NK-92 cells). N Graph showing the absolute number of tumor-infiltrating NK-92 cells. n = 9 scramble NK-92 cells, n = 9 BECN1 overexpressing NK-92 cells. O, P Graphs showing the frequency of LC3B+ cells (O) and effector function expression (P) in tumor-infiltrating NK-92 cells. n = 9 scramble NK-92 cells, n = 9 BECN1 overexpressing NK-92 cells. Q Graph showing the frequency, referred to live cell gate, of circulating NK-92 cells in mice injected with control or BECN1 overexpressing NK-92 cells (n = 12 mice/group). R, S Graph showing the frequency of LC3B+ cells (R) and effector function expression (S) in peripheral blood circulating NK-92 cells. n = 12 sample/group. Symbols in (B), (H), and (L) represent mean and error bars indicate SEM; one-way ANOVA test with Holm-Šídák’s multiple-comparisons test (B, H) or two-tailed unpaired t test (L), comparing area under the curve (AUC). Data in (C) and (I) are presented as Min to Max box-and-whisker plot, the box extends from the 25th to 75th percentiles, and the whiskers reach the sample maximum and minimum values, the median indicated is at center line and the mean value is indicated as “+”; one-way ANOVA test with Holm-Šídák’s multiple-comparisons test. Data in (DF), (J), (K), and (MS) are presented as Min to Max box-and-whisker plot, the box extends from the 25th to 75th percentiles and the whiskers reach the sample maximum and minimum values, the median is indicated at center line and the mean value is indicated as “+”; two-tailed unpaired t test.
Fig. 5
Fig. 5. The CXCL12/CXCR4 signaling pathway impairs autophagy and functionality in NK cells.
A Volcano plot showing the fold change expression of autophagy genes between tumor-conditioned and control NK cells (n = 2 biological replicates, NK cells from different mice). BD Flow cytometry analysis of CXCR4+ cells in tumor-conditioned vs control NK cells (B, n = 7 biological replicates, independently collected batches of tumor-conditioned medium), Ptenpc+/+ vs Ptenpc−/− prostate-infiltrating NK cells (C, n = 6 Ptenpc+/+ mice and n = 5 Ptenpc−/− mice) and tumor vs non-tumor infiltrating NK cells (D, n = 5 samples/group). E UMAP representation of the 24 major cell types identified within CD45+ and CD45 infiltrating cells in Ptenpc−/− tumor tissues (n = 2 Ptenpc+/+ mice and n = 2 Ptenpc−/− mice). F CellPhoneDB intercellular communication analysis between NK cells and all the other cell clusters identified by scRNA-seq (n = 2 Ptenpc+/+ mice and n = 2 Ptenpc−/− mice). G Graph showing the autophagic flux on murine NK cells in tumor-conditioned NK cells, with or without Plerixafor (n = 5 biological replicates, independently collected batches of tumor-conditioned medium). H Cytotoxicity of tumor-conditioned NK cells, with or without Plerixafor, against YAC-1 target cells (n = 4 biological replicates, independently collected batches of tumor-conditioned medium). I Graph showing the autophagic flux on murine NK cells, in presence or absence of CXCL12 (n = 4 biological replciates, NK cells from different mice). J Cytotoxicity of control or CXCL12-treated NK cells against YAC-1 target cells (n = 5 biological replicates, NK cells from different mice). K Graph showing the autophagic flux on non-targeting (NT) and CXCR4 KO NK-92 cells, upon tumor-conditioned medium exposure (n = 5 biological replicates, independently collected batches of tumor-conditioned medium). L Cytotoxicity of NT and CXCR4 KO NK-92 cells, exposed to tumor-conditioned medium, against PC3 target cells (n = 12, biological replicates, data pooled from two independent experiments). M, N Tumor growth curves (M) and tumor volume at the end of the experiment (N) referred to mice treated as described in 4 G (n = 7 control, n = 7 NT NK-92 cells, n = 7 CXCR4 KO NK-92 cells). O Graph showing the absolute number of tumor-infiltrating NK-92 cells. n = 7 control, n = 7 NT NK-92 cells, n = 7 CXCR4 KO NK-92 cells. P, Q Flow cytometry analysis of effector functions in tumor-infiltrating (P) and circulating (Q) NK-92 cells. n = 7 control, n = 7 NT NK-92 cells, n = 7 CXCR4 KO NK-92 cells. Data in (A) are presented as volcano plot; two-tailed unpaired t test. Data in (B), (C), (GL), and (OQ) are presented as Min to Max box-and-whisker plot, the box extends from the 25th to 75th percentiles and the whiskers reach the sample maximum and minimum values, the median is indicated at center line and the mean value is indicated as “+”; two-tailed unpaired t test. Data in (D) are presented as as before-after plot; two-tailed paired t test. Symbols in (M) represent mean and error bars indicate SEM; one-way ANOVA test, comparing area under the curve (AUC). Data in (F) are presented as balloon plot; enriched ligand–receptor interactions were calculated based on permutation test. Data in (N) are presented as Min to Max box-and-whisker plot, the box extends from the 25th to 75th percentiles and the whiskers reach the sample maximum and minimum values, the median is indicated at center line and the mean value is indicated as “+”; one-way ANOVA test with Holm-Šídák’s multiple-comparisons test.
Fig. 6
Fig. 6. Tumor-derived CXCL12 drives human NK cell impairment via engagement of the CXCR4/C/EBPβ axis.
A Results of the NicheNet analysis performed on scRNA sequencing, described in 4E. B Graph showing the MFI of CXCR4 in NK-92 cells, treated with TGFβ or tumor-conditioned medium, in presence or absence of TGFβ receptor inhibitor LY2109761 (n = 6 replicates, independently collected batches of tumor-conditioned medium). C, D Quantification of TGFβ release from human (C) and murine (D) prostate cancer cell lines (n = 4 biological replicates). E, F Bar graph showing C/EBPβ activation in NK-92 cells upon administration of CXCL12 (E, n = 4 biological replicates) or PC3-derived conditioned media, with or without Plerixafor (F, n = 3 biological replicates). G, H Relative fold change of key autophagy-related genes in NK-92 cells treated or not with Helenalin Acetate (HA), in absence (G) or presence (H) of tumor-conditioned medium (n = 5 biological replicates). I Graph showing the autophagic flux on NK-92 cells, treated or not with HA, with or without tumor-conditioned medium (n = 5 biological replicates, independently collected batches of tumor-conditioned medium). J Cytotoxicity of control or tumor-conditioned NK-92 cells, in presence or absence of HA, against PC3 target cells (n = 5 biological replicates, independently collected batches of tumor-conditioned medium). K) Graph showing the autophagic flux on NK-92 cells, treated or not with HA, in presence or absence of CXCL12 (n = 6 biological replicates). L, M Tumor growth curves (L) and tumor volume at the end of the experiment (M) referred to mice treated with NK-92 cells, exposed or not to HA (n = 15 NK-92 cells, n = 15 HA-treated NK-92 cells). N Graph showing the absolute number of tumor-infiltrating NK-92 cells. n = 15 NK-92 cells, n = 15 HA-treated NK-92 cells. O, P Graph showing the frequency of LC3B+ cells (O) and effector function expression (P) in peripheral blood circulating NK-92 cells. n = 15 NK-92 cells, n = 15 HA-treated NK-92 cells. Data in (B) and (IK) are presented as Min to Max box-and-whisker plot, the box extends from the 25th to 75th percentiles and the whiskers reach the sample maximum and minimum values, the median is indicated at center line and the mean value is indicated as “+”; one-way ANOVA test with Holm-Šídák’s multiple-comparisons test. Data in (CF) are presented as scatter plot with mean ± SEM; one-way ANOVA test with Holm-Šídák’s multiple-comparisons test for (E) and (F). Data in (G) and (H) are presented as scatter plot with mean ± SEM; two-tailed unpaired t test. Symbols in (L) represent mean and error bars indicate SEM; two-tailed unpaired t test, comparing area under the curve (AUC). Data in (MP) are presented as Min to Max box-and-whisker plot, the box extends from the 25th to 75th percentiles and the whiskers reach the sample maximum and minimum values, the median is indicated at center line and the mean value is indicated as “+”; two-tailed unpaired t test.
Fig. 7
Fig. 7. Activation of the autophagic pathway confers a superior anti-tumor function to PD-L1 CAR-NK cells.
A Scheme depicting the structure of PD-L1.CAR NK-92 used in the study. B Flow cytometry analysis of PD-L1.CAR expression on PD-L1.CAR NK-92 and parental NK-92 cells, by human recombinant PD-L1-Fc protein combined with anti-Fc secondary antibody. Filled gray areas indicate negative controls stained with secondary antibody only. Representative data from at least 3 independent experiments are shown. C Flow cytometry analysis of PD-L1 expression in PC3 cell line. Left plot represents Fluorescence Minus One (FMO) control, right plot represents cells stained with PD-L1 antibody. D Cytotoxicity of PD-L1.CAR NK-92 cells, treated or not with tumor-conditioned medium, with or without Metformin, against PC3 target cells (n = 4 biological replicates, independently collected batches of tumor-conditioned medium). E, F Tumor growth curves (E) and tumor volume at the end of the experiment (F) referred to mice treated as described in 4G (n = 7 control, n = 7 CAR NK-92 cells, n = 7 Metformin-treated CAR NK-92 cells). G Graph showing the absolute number of tumor-infiltrating NK-92 cells. n = 7 control, n = 7 CAR NK-92 cells, n = 7 Metformin-treated CAR NK-92 cells. H, I Graph showing the frequency of LC3B+ cells (H) and effector function expression (I) in tumor-infiltrating CAR NK-92 cells. n = 7 control, n = 7 CAR NK-92 cells, n = 7 Metformin-treated CAR NK-92 cells. Data in (D) and (F) are presented as Min to Max box-and-whisker plot, the box extends from the 25th to 75th percentiles and the whiskers reach the sample maximum and minimum values, the median is indicated at center line and the mean value is indicated as “+”; one-way ANOVA test with Holm-Šídák’s multiple-comparisons test. Symbols in (E) represent mean and error bars indicate SEM; one-way ANOVA test with Holm-Šídák’s multiple-comparisons test, comparing area under the curve (AUC). Data in (G), (H), and (I) are presented as Min to Max box-and-whisker plot, the box extends from the 25th to 75th percentiles and the whiskers reach the sample maximum and minimum values, the median is indicated at center line and the mean value is indicated as “+”; two-tailed unpaired t test.

References

    1. June, C. H., O’Connor, R. S., Kawalekar, O. U., Ghassemi, S. & Milone, M. C. CAR T cell immunotherapy for human cancer. Science359, 1361–1365 (2018). - PubMed
    1. Bald, T., Krummel, M. F., Smyth, M. J. & Barry, K. C. The NK cell–cancer cycle: advances and new challenges in NK cell-based immunotherapies. Nat. Immunol.21, 835–847 (2020). - PMC - PubMed
    1. Guillerey, C., Huntington, N. D. & Smyth, M. J. Targeting natural killer cells in cancer immunotherapy. Nat. Immunol.17, 1025–1036 (2016). - PubMed
    1. Myers, J. A. & Miller, J. S. Exploring the NK cell platform for cancer immunotherapy. Nat. Rev. Clin. Oncol.18, 85–100 (2021). - PMC - PubMed
    1. Bonavita, E. et al. Antagonistic inflammatory phenotypes dictate tumor fate and response to immune checkpoint blockade. Immunity53, 1215–1229.e1218 (2020). - PMC - PubMed

Publication types

MeSH terms

Substances

Associated data