. 2024 Nov 28;15(11):863.
doi: 10.1038/s41419-024-07247-8.

Blood matters: the hematological signatures of Coronavirus infection

Affiliations

Blood matters: the hematological signatures of Coronavirus infection

Ayelen Toro et al. Cell Death Dis. .

Abstract

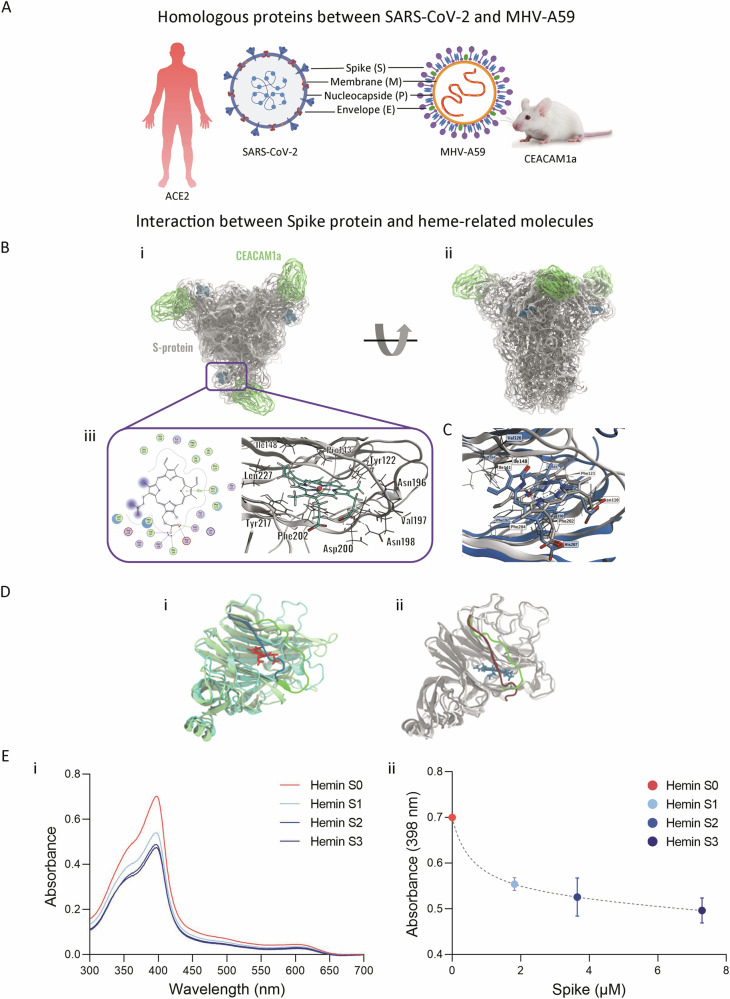
Recent developments have broadened our perception of SARS-CoV-2, indicating its capability to affect the body systemically beyond its initial recognition as a mere respiratory pathogen. However, the pathways of its widespread are not well understood. Employing a dual-modality approach, we integrated findings from a Murine Hepatitis Virus (MHV) infection model with corroborative clinical data to investigate the pervasive reach of Coronaviruses. The novel presence of viral particles within red blood cells (RBCs) was demonstrated via high-resolution transmission electron microscopy, with computational modeling elucidating a potential heme-mediated viral entry mechanism via Spike protein affinity. Our data affirm viral localization in RBCs, suggesting heme moieties as facilitators for cellular invasion. Exacerbation of MHV pathology upon hemin administration, contrasted with chloroquine-mediated amelioration, underscoring a heme-centric pathway in disease progression. These observations extend the paradigm of Coronavirus pathogenicity to include hemoprotein interactions. This study casts new light on the systemic invasion capabilities of Coronaviruses, linking RBC hemoproteins with viral virulence. The modulation of disease severity through heme-interacting agents heralds a promising avenue for COVID-19 therapeutics. Our findings propose a paradigm shift in the treatment approach, leveraging the virus-heme interplay as a strategic hinge for intervention.


Conflict of interest statement

Competing interests: The authors declare no competing interests. Ethics approval and consent to participate: All procedures performed in studies involving human subjects were in accordance with the ethical standards of the institutional and/or national research committee and with the 1964 Helsinki Declaration and its later amendments or comparable ethical standards. Documented approval was obtained from the Ethics Committee of Hospital Español (Administración de los Servicios de Salud del Estado, Uruguay, protocol #ASSESALUD_CEI_290420). Written informed consent was obtained from all participants. All the experimental protocols using mice were approved by the institutional Comisión de Ética en el Uso de Animales (protocol #006-22) and were performed according to national law #18.611 and relevant international laboratory animal welfare guidelines and regulations.

Figures

Fig. 1
Fig. 1. SARS-CoV-2 and MHV RNA were detected in different tissues.
A (i) Schematic representation of sample acquisition from COVID-19 patients from Hospital Español (Administración de los Servicios de Salud del Estado, Uruguay). Nasopharyngeal swabs (n = 10) and lung, heart, and kidney samples from human autopsies (n = 8) were collected for viral load by RT-qPCR analysis. (ii) Viral load (log10(copy/mL) of nasopharyngeal swabs and samples from COVID-19 patients (P). (iii) Viral load (log10(copy/mL) of different organ samples (lung, heart, and kidney) obtained from patient autopsies. B (i) Experimental design of murine Coronavirus infection. BALB/cJ mice were infected with MHV-A59 by intranasal administration (4000 PFU) or by i.p. injection (6000 PFU). Five days post-infection (dpi), the liver, lung, brain, heart, kidney, spleen, and pancreas were dissected for RT-qPCR analyzes. (ii) Viral RNA abundance (−Ct) measured by RT-qPCR in liver, lung, brain, kidney, spleen, and pancreas samples from mice (n = 5) infected by intranasal administration. (iii) Viral RNA abundance (−Ct) measured by RT-qPCR (filled circles) and viral titer (log10(TCID50/g) (open circles) in liver, lung, brain, heart, kidney, spleen, and pancreas samples from mice (n = 6) infected by intraperitoneal administration. BDL below detection limit.
Fig. 2
Fig. 2. Comparative pathophysiology of SARS-CoV-2 and MHV infections.
A COVID-19 multiorgan manifestations (adapted from [18]) B Experimental design of murine Coronavirus infection. BALB/cJ mice were infected with 6000 PFU of MHV-A59 by intraperitoneal injection. Five days post-infection (dpi), the liver and kidney were dissected for macroscopic analyzes. Blood samples were also taken pre- and post-infection for determining blood parameters. C Body weight pre- and post-infection of MHV-infected (MHV) and uninfected (MOCK) mice. D Liver weight (i), macroscopic appearance and pathological scores (grades 1 to 3, where 1 is no damage and 3 is the most damaged) (ii) at necropsy five dpi in MHV-infected (MHV), and uninfected (MOCK) mice. Total protein (g/L) (iii) albumin (g/L) (iv) globulin (g/L) (v) alanine transaminase (ALT) (g/L) (vi) and aspartate aminotransferase (AST) (g/L) (vii) levels measured in the blood of MHV-infected (MHV), and uninfected (MOCK) mice, pre- and post-infection. E Kidney macroscopic appearance and pathological scores (grades 1 to 3, where 1 is no damage and 3 is the most damaged) (i) at necropsy five dpi in MHV-infected (MHV), and uninfected mice (PBS). Blood urea nitrogen (BUN) (mmol/L) (ii) levels measured in the blood of MHV-infected (MHV), and uninfected mice (MOCK), pre- and post-infection. F Spleen weight at necropsy five dpi in MHV-infected (MHV), and uninfected (MOCK) mice. Results are shown as the mean ±SD. Paired student’s t-test was performed to determine statistical differences between pre- and post-infection. Unpaired student’s t-test was performed to determine statistical differences between MHV and mock. Statistical significance was set at p < 0.05. * p < 0.05, ** p < 0.01, *** p < 0.001.
Fig. 3
Fig. 3. Presence of SARS-CoV-2 and MHV in blood specimens.
A (i) Schematic representation of sample acquisition from COVID-19 patients from Hospital Español (Administración de los Servicios de Salud del Estado, Uruguay). Blood samples (n = 10) were collected for viral load by RT-qPCR analysis. (ii) Viral load (log10(copy/mL) of serum samples from COVID-19 patients (P). BDL below detection limit. B (i) Experimental design of murine Coronavirus infection. BALB/cJ mice were infected with 6000 PFU of MHV-A59 by intraperitoneal injection (MHV). Blood samples were taken before and after infection to assess hematological parameters. Blood fractionation was performed by centrifugation. Five days post-infection (dpi), hematological parameters, viral load, and infectious particles were determined in plasma and red blood cell (RBC)-enriched fraction by RT-qPCR analyzes and viral plaque assays, respectively. Additionally, proteomics and high-resolution transmission electron microscopy (HR-TEM) analyzes were performed to identify viral proteins and particles. (ii) Presence of viral RNA and infectious particles in plasma of MHV-infected mice (n = 6). Viral load (log10(copy/mL)) measured by RT-qPCR (filled circles) and viral titers (log10(TCID50/mL)) determined by plaque assays (open circles). BDL below detection limit. C (i) Detection of viral proteins by LC ESI-MS/MS. MHV-infected BALB/cJ mice were subjected to blood extraction and fractionation. Plasma fractions were depleted of the 3 most abundant proteins using the Multiple affinity removal spin cartridge mouse 3 (Agilent) and analyzed by LC ESI-MS/MS. The NCAP-CVMA5 protein (P03416) was identified. (ii) Table depicting the 5 unique peptides found for NCAP-CVMA5 protein. Mz, the amount of peaks matched and spectrum counts are shown. (iii) Identification of N protein. Spectrum from 2 unique peptides found with 2 spectrum counts (DGGADVVSPKPQR and FDSTLPGFETIM[Ox]K). D (i) Hematological parameters assessment in MHV-infected (MHV), and uninfected mice (MOCK). Red blood cell (RBC) (1012/L) (i) hematocrit (HTC) (%) (ii), and hemoglobin (HGB) (g/L) (iii) levels pre- and post-infection. Paired student’s t-test was performed to determine statistical differences between pre- and post-infection. E (i) Presence of viral RNA and infectious particles in RBC-enriched fraction of MHV-infected mice (n = 6). Viral load (log10(copy/mL)) measured by RT-qPCR (filled circles) and viral titers (log10(PFU/mL)) determined by plaque assays (open circles). BDL below detection limit. (ii) Table depicting the mean value for viral load (log10(copy/mL)) and titer (log10(PFU/mL)) from plasma and RBC-enriched fractions. SD: standard deviation. Unpaired student’s t-test was performed to determine statistical differences between plasma and RBC-enriched fractions. Statistical significance was set at p < 0.05. *p < 0.05, ** p < 0.01, ***p < 0.001. F (i) High-resolution transmission electron microscopy (HR-TEM) of liver samples (ab, (b) shows a magnification of what is observed in (a)), RBC-enriched fraction from MHV-infected (ce, (d) shows a magnification of what is observed in (c)), and mock (f) mice. White arrows indicate virus-like particles with electron-dense appearance. Control samples from non-infected mice served as a baseline. Liver samples were used as a positive control of infection. Scale bar: 500 nm. RBC red blood cell, N nucleus. (ii) Bar plot depicting the percentage of imaging fields containing 0, 1, 2, or 3 virus-like particles, observed in the RBC-enriched fraction of MHV-infected mice. (iii) Pie chart depicting the localization (adjacent, attached, or within) of virus-like particles found in the RBC-enriched fraction of MHV-infected mice. (iv) Table summarizing the size (mean ± SD) of virus-like particles observed within liver cells and adjacent/attached/within RBCs.
Fig. 4
Fig. 4. Heme can bind to the SARS-CoV-2 and MHV Spike proteins.
A Homologous proteins and viral receptors between SARS-CoV-2 and MHV-A59. B (i) Visualization of the final MHV S protein-CEACAM1a complex from top view. (ii) Visualization of the final MHV S protein-CEACAM1a complex from side view. (iii) 2D view of the interactions between heme and the NTD binding site on the left, 3D representation of the docked heme in the beta subunit of the MHV sNTD on the right. S protein is shown in gray. CEACAM1a D1 subunit is shown in green. Heme molecules are shown in dark blue spheres. Transparent overlays represent molecular surfaces of MHV S protein and CEACAM1a. C Overlap of heme—MHV S protein complex (in gray, predicted by docking) and experimental biliverdin - SARS-CoV-2 S protein complex (in blue); residues involved in conserved interactions are represented as sticks and labeled. D (i) Visual comparison of the superposed SARS-CoV-2 sNTD (light green) and MHV-sNTD (cyan). (ii) Comparison of the Val188-Asp200 loop in the MHV-sNTD before (dark red) and after (green) manually re-sampling the loop conformation, in the presence of the biliverdin molecule (dark blue) from the SARS-CoV-2 sNTD template (PDB 7BS2). E (i) UV–visible spectra of hemin alone (10 µM, red) or in the presence of increasing amounts of purified SARS-CoV-2 Spike (S1: 1.8 µM in light blue, S2: 3.6 µM in blue, S3: 7.2 µM in dark blue). (ii) Determination of binding affinities (Kd value) between hemin (10 µM) and purified recombinant SARS-CoV-2 Spike protein (S1: 1.8 µM in light blue, S2: 3.6 µM in blue, S3: 7.2 µM in dark blue) by UV–Visible spectrophotometry. Absorbance at 398 nm, which corresponds to Soret band peak, was plotted to determine Kd using GraphPad Software. Results are shown as the mean ± SEM. Data are representative of three independent experiments.
Fig. 5
Fig. 5. Hemin-induced augmentation of viral infection in the MHV model.
A Experimental design of murine Coronavirus infection. BALB/cJ mice were infected with 6000 PFU of MHV-A59 by intraperitoneal injection (MHV). Mice were treated with hemin (a single dose of 10 mg/kg, i.p.). Five days post-infection (dpi), the liver, lung, brain, heart, kidney, spleen, and pancreas were dissected for RT-qPCR analyses. Blood samples were also taken pre- and post-infection. Blood fractionation was performed by centrifugation. Additionally, viral load and infectious particles were determined in plasma and RBC-enriched fraction by RT-qPCR analyzes and viral plaque assays, respectively. B Viral RNA abundance (-Ct), measured by RT-qPCR, in liver, lung, brain, heart, kidney, spleen, and pancreas samples from MHV + PBS (n = 6, red) and MHV + H (n = 6, blue) mice. Each dot represents the mean value of three technical replicates (i) or biological replicates (ii). Viral RNA abundance is shown as the mean ± SEM. C Viral load (log10(copy/mL)), measured by RT-qPCR (filled circles), and viral titers (log10(PFU/mL), determined by plaque assays (open circles), in the plasma and RBC-enriched fractions from MHV-infected mice. Red and blue dots represent MHV-infected mice (n = 6) and MHV-infected and treated with hemin mice (n = 6), respectively. Red dashed lines represent the mean value of control group (MHV + PBS). BDL below detection limit. Unpaired student’s t-test was performed to determine statistical differences between MHV + PBS and MHV + H. Statistical significance was set at p < 0.05. *p < 0.05, ***p < 0.001.
Fig. 6
Fig. 6. Hemin and chloroquine combined treatment reversed the enhanced infection promoted by hemin.
A Experimental design of murine Coronavirus infection. BALB/cJ mice were infected with 6000 PFU of MHV-A59 by intraperitoneal injection. Mice were treated with chloroquine (CQ) (four doses of 30 mg/kg, i.p.) (MHV + CQ) and/or hemin (a single dose of 10 mg/kg, i.p.) (MHV + H and MHV + H + CQ). Infected untreated mice (MHV + PBS) received 100 µL of PBS by i.p. injection. Five days post-infection (dpi), the liver, lung, brain, heart, kidney, spleen, and pancreas were dissected for RT-qPCR analyzes and viral plaque assays. B (i) Body weight pre- (empty circles) and post- (filled circles) infection of MHV + PBS, MHV + H, MHV + CQ, and MHV + H + CQ mice. (ii) Total protein (g/L) levels measured in the blood of MHV + PBS, MHV + H, MHV + CQ, and MHV + H + CQ mice, pre- (empty circles) and post- (filled circles) infection (Upper panel). Liver macroscopic appearance (Lower panel). C Viral RNA abundance (-Ct), measured by RT-qPCR, in liver, lung, brain, heart, kidney, spleen, and pancreas samples from all of the MHV + PBS (n = 6), MHV + H (n = 6), MHV + CQ (n = 6) and MHV + H + CQ (n = 6) mice (i) mean ± S.E.M of each group (ii) and bar plot for each organ depicting statistical differences between groups (iii). Each dot represents the mean value of three technical replicates (i) or biological replicates (ii). Viral RNA abundance is shown as the mean ± SEM. BDL below detection limit. Statistical significance was set at p < 0.05. *p < 0.05, **p < 0.01, ***p < 0.001.
Fig. 7
Fig. 7. Blood biochemical profiles were improved by hemin and chloroquine combined treatment.
A Experimental design of murine Coronavirus infection. BALB/cJ mice were infected with 6000 PFU of MHV-A59 by intraperitoneal injection. Mice were treated with chloroquine (CQ) (four doses of 30 mg/kg, i.p.) (MHV + CQ) and/or hemin (a single dose of 10 mg/kg, i.p.) (MHV + H and MHV + H + CQ). Infected untreated mice (MHV + PBS) received 100 µL of PBS by i.p. injection. Blood samples were also taken pre- and post-infection for hematological parameters determination. Additionally, five days post-infection (dpi), blood fractionation was performed by centrifugation, and viral load and infectious particles were determined in plasma and red blood cell (RBC)-enriched fraction by RT-qPCR analyzes and viral plaque assays, respectively. B Hematological parameters assessment in MHV + PBS, MHV + H, MHV + CQ, and MHV + H + CQ mice. Absolut (i) and relative (to the MOCK group, dashed line) (iiiii) red blood cell (RBC) (1012/L), hematocrit (HTC) (%), and hemoglobin (g/L) levels pre- and post-infection. C (i) Viral load (log10(copy/mL)), measured by RT-qPCR, and viral titers (log10(PFU/mL), determined by plaque assays, in the plasma and RBC-enriched fractions from MHV + PBS, MHV + H, MHV + CQ, and MHV + H + CQ mice. Red, blue, green, and purple dots represent MHV + PBS (n = 6), MHV + H (n = 6), MHV + CQ (n = 6) and MHV + H (n = 6), respectively. Red dashed lines represent the mean value of control group (MHV + PBS). (ii) Table depicting the statistical significance between experimental groups. Unpaired student’s t-test was performed to determine statistical differences between conditions. Statistical significance was set at p < 0.05. * p < 0.05, **p < 0.01, ***p < 0.001.

References

    1. Raveendran AV, Jayadevan R, Sashidharan S. Long COVID: an overview. Diabetes Metab Syndr. 2021;15:869–75. - PMC - PubMed
    1. Davis HE, McCorkell L, Vogel JM, Topol EJ. Long COVID: major findings, mechanisms and recommendations. Nat Rev Microbiol. 2023;21:133–46. - PMC - PubMed
    1. Lopez-Leon S, Wegman-Ostrosky T, Ayuzo del Valle NC, Perelman C, Sepulveda R, Rebolledo PA. et al. Long-COVID in children and adolescents: a systematic review and meta-analyses. Sci Rep. 2022;12:9950. - PMC - PubMed
    1. Korompoki E, Gavriatopoulou M, Fotiou D, Ntanasis-Stathopoulos I, Dimopoulos MA, Terpos E. Late-onset hematological complications post COVID-19: an emerging medical problem for the hematologist. Am J Hematol. 2022;97:119–28. - PMC - PubMed
    1. Sahu KK, Borogovac A, Cerny J. COVID-19 related immune hemolysis and thrombocytopenia. J Med Virol. 2021;93:1164–70. - PMC - PubMed

MeSH terms