. 2024 Nov 29;15(1):10368.
doi: 10.1038/s41467-024-54620-4.

A vaccine platform targeting lung-resident memory CD4+ T-cells provides protection against heterosubtypic influenza infections in mice and ferrets

Affiliations

A vaccine platform targeting lung-resident memory CD4+ T-cells provides protection against heterosubtypic influenza infections in mice and ferrets

Kwang Hyun Ko et al. Nat Commun. .

Abstract

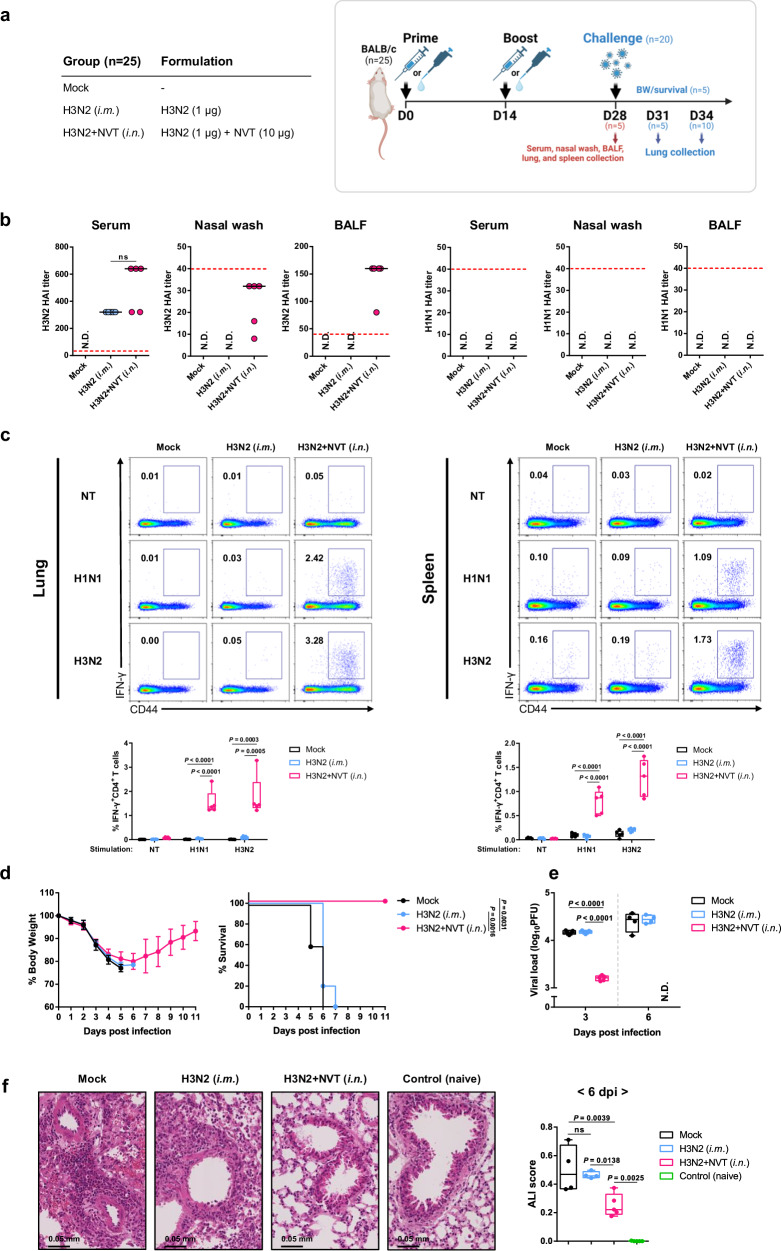
Lung tissue-resident memory T (TRM) cells induced by influenza vaccination are crucial for heterosubtypic immunity upon re-exposure to the influenza virus, enabling rapid and robust responses upon reactivation. To enhance the efficacy of influenza vaccines, we induce the generation of lung TRM cells following intranasal vaccination with a commercial influenza vaccine adjuvanted with NexaVant (NVT), a TLR3 agonist-based adjuvant. We demonstrate that intranasal immunization with the NVT-adjuvanted vaccine provides improved protection against influenza virus infections by inducing the generation of CD4+ TRM cells in the lungs in a type I interferon-dependent manner. These pulmonary CD4+ TRM cells provide potent mucosal immunity and cross-protection against heterosubtypic infections in both mouse and ferret models. This vaccine platform has the potential to significantly improve conventional intramuscular influenza vaccines by providing broader protection.


Conflict of interest statement

Competing interests: K.H.K., H.S.B., D.-H.K., and S.B.C. are employees of the NA Vaccine Institute Research and Development Center. J.H. and H.P. are employees of Il-Yang Pharmaceutical. The remaining authors declare no competing interests.

Figures

Fig. 1
Fig. 1. Intranasal administration of QIV in combination with NVT provides superior protection against homologous influenza virus challenge.
a Experimental design. BALB/c mice (n = 15 per group) were immunized i.m. with QIV or i.n. with QIV or QIV + NVT twice at two-week intervals. Two weeks after the last immunization, immune response analysis (n = 5 per group) (bd) and H1N1 virus (A/Korea/2785/2009) challenge (n = 10 per group) (e, f) were performed. Schematic image was created in BioRender. Han, S. (2024) BioRender.com/d59a368. b, c (b) QIV-specific total IgG, IgG1, and IgG2a in the serum and (c) QIV-specific IgA in the nasal wash and BALF were assessed via ELISA. The data are expressed as dot plots, with horizontal lines representing the medians. d After stimulating lung and spleen cells with QIV, the IFN-γ+CD4+ T-cell response was determined by flow cytometry. Box and whisker plots show the median (center), 25th and 75th percentiles (box), and lowest and highest values (whiskers). e, f The vaccinated mice were infected i.n. with (e) 100 LD50 (n = 5 per group) or (f) 5000 LD50 (n = 5 per group) of H1N1 virus, and body weight and survival were monitored daily. Weight-loss data are shown as mean value ± standard deviation (SD). Survival data are represented as Kaplan‒Meier survival curves, and the significant differences in survival rates were calculated by the log-rank test. b-f Statistical analyses were performed using one-way ANOVA with Tukey’s multiple comparisons test or two-sided Mann–Whitney U test. This study was performed independently at least three times, and one representative set is shown. BW body weight; N.D. not detected; ns, not significant; NT non-treated. Source data are provided as a Source Data file.
Fig. 2
Fig. 2. Intranasal immunization with NVT-adjuvanted H3N2 confers cross-protection against lethal heterosubtypic influenza virus challenge.
a Experimental design. BALB/c mice (n = 25 per group) were immunized i.m. with H3N2 or i.n. with H3N2 + NVT twice at two-week intervals. Two weeks after the last immunization, immune response analysis (n = 5 per group) (b, c) and H1N1 virus (A/Korea/2785/2009) challenge (n = 20 per group) (df) were performed. Schematic image was created in BioRender. Han, S. (2024) BioRender.com/b04n737. b HAI antibody titers against H3N2 or H1N1 in serum, nasal wash, and BALF were measured via HAI assay. An HAI antibody titer of 1:40 (red dotted line) was considered protective against influenza infection. The data are expressed as dot plots, with horizontal lines representing the medians. c After stimulating lung and spleen cells with H1N1 or H3N2, the IFN-γ+CD4+ T-cell response was determined by flow cytometry. df The vaccinated mice were infected i.n. with 4 LD50 of H1N1 virus. d Body weight and survival (n = 5 per group) were monitored daily. Weight-loss data are shown as mean value ± SD. Survival data are represented as Kaplan‒Meier survival curves, and the significant differences in survival rates were calculated by the log-rank test. e On days 3 and 6 after the challenge, lung viral loads were assessed using a plaque assay (n = 5 per group). f On day 6 after the challenge, lung tissues from mice (n = 5 per group) were collected, and histological sections of vaccinated and control (naïve) mice were stained with hematoxylin and eosin. Acute lung injury (ALI) scores of sectioned lungs. A score of zero indicates healthy lungs, whereas a score of one signifies severe acute lung injury. c, e, f Box and whisker plots show the median (center), 25th and 75th percentiles (box), and lowest and highest values (whiskers). bf Statistical analyses were performed using one-way ANOVA with Tukey’s multiple comparisons test or two-sided Mann–Whitney U test. This study was performed independently at least three times, and one representative set is shown. BW body weight, N.D. not detected, ns not significant, NT non-treated. Source data are provided as a Source Data file.
Fig. 3
Fig. 3. CD4+ T-cell responses play a critical role in protection against heterosubtypic virus infection.
a Experimental design. BALB/c mice were immunized i.m. with H3N2 (n = 8) or i.n. with H3N2 + NVT (n = 16) twice at two-week intervals. Two weeks after the last immunization, H3N2 + NVT-administered mice were treated with an isotype control (n = 8) or a GK1.5 (anti-CD4) monoclonal antibody (n = 8) three times for one week. Then, immune response analysis (n = 3 per group) (bd) and H1N1 virus (A/Korea/2785/2009) challenge (n = 5 per group) (e) were performed. Schematic image was created in BioRender. Han, S. (2024) BioRender.com/t11y924. b Depletion of CD4+ T-cells in the lung and spleen was confirmed using flow cytometry. c H3N2-specific IgA in nasal washes was assessed via ELISA. d HAI antibody titers against H3N2 or H1N1 in serum were measured by HAI assay. An HAI antibody titer of 1:40 (red dotted line) was considered protective against influenza infection. bd Data are expressed as dot plots, with horizontal lines representing the medians. e The mice were infected i.n. with 4 LD50 of H1N1 virus, and body weight and survival were monitored daily. Weight-loss data are shown as mean value ± SD. Survival data are represented as Kaplan‒Meier survival curves. bd Statistical analyses were performed using one-way ANOVA with Tukey’s multiple comparisons or two-sided Mann–Whitney U test. This study was performed once. BW, body weight; N.D., not detected; ns, not significant. Source data are provided as a Source Data file.
Fig. 4
Fig. 4. The CD4+ T-cell response in the lung, not in the spleen, plays a critical role in cross-protection against heterosubtypic influenza virus.
a Experimental design. BALB/c mice (n = 10 per group) were immunized twice i.m. with H3N2 or H3N2 + NVT, or i.n. with H3N2 + NVT at two-week intervals. Two weeks after the last immunization, immune response analysis (n = 5 per group) (b, c, e) and H1N1 virus (A/Korea/2785/2009) challenge (n = 5 per group) (d) were performed. Schematic image was created in BioRender. Han, S. (2024) BioRender.com/e21s192. b After stimulating lung and spleen cells with H1N1 or H3N2, the IFN-γ+CD4+ T-cell response was determined by flow cytometry. c HAI antibody titers against H3N2 or H1N1 in serum were measured by HAI assay. An HAI antibody titer of 1:40 (red dotted line) was considered protective against influenza infection. d Mice were i.n. infected with 4 LD50 of H1N1 virus, and body weight and survival were monitored daily. Weight-loss data are shown as mean value ± SD. Survival data are represented as Kaplan‒Meier survival curves, and the significant differences in survival rates were calculated by the log-rank test. e The proportion and number of CD4+ TRM cells (CD4+CD44+CD62L-CD69+) and CD8+ TRM cells (CD8+CD44+CD62L-CD69+) in the lungs were determined by flow cytometry. The gating strategy, frequency, and absolute number are shown. b, e Box and whisker plots show the median (center), 25th and 75th percentiles (box), and lowest and highest values (whiskers). b, c, e Statistical analyses were performed using one-way ANOVA with Tukey’s multiple comparisons test. This study was performed independently at least three times, and one representative set is shown. BW, body weight; N.D., not detected; ns, not significant; NT, non-treated. Source data are provided as a Source Data file.
Fig. 5
Fig. 5. Type I IFN signaling is essential for the induction of protective immunity by the NVT-adjuvanted intranasal influenza vaccine.
a Experimental design. WT (n = 9 per group) and IFNAR1−/− mice (n = 9 per group) were immunized i.n. with H3N2 + NVT twice at two-week intervals. Two weeks after the last immunization, immune response analysis (n = 4 per group) (be) and H1N1 virus (A/Korea/2785/2009) challenge (n = 5 per group) (f) were performed. Schematic image was created in BioRender. Han, S. (2024) BioRender.com/l89f720. b, c HAI antibody titers against H3N2 or H1N1 in (b) serum and (c) nasal washes were determined by HAI assay. An HAI antibody titer of 1:40 (red dotted line) was considered protective against influenza infection. b, c Data are expressed as dot plots, with horizontal lines representing the medians. d, e (d) The lung CD4+ TRM population and (e) CD4+ T-cell responses to H1N1 or H3N2 in the lung and spleen were determined by using flow cytometry. Box and whisker plots showing the median (center), 25th and 75th percentiles (box), and lowest and highest values (whiskers). f The vaccinated mice were infected i.n. with 4 LD50 of H1N1 virus, and body weight and survival were monitored daily. Weight-loss data are shown as mean value ± SD. Survival data are represented as Kaplan‒Meier survival curves, and the significant differences in survival rates were calculated by the log-rank test. bf Statistical analyses were performed using one-way ANOVA with Tukey’s multiple comparisons test or two-sided Mann–Whitney U test. This study was performed independently at least three times, and one representative set is shown. BW, body weight; N.D., not detected; ns, not significant; NT, non-treated. Source data are provided as a Source Data file.
Fig. 6
Fig. 6. Chemokines induced by NVT contribute to lung CD4+ TRM cell formation, but direct codelivery of antigens is essential.
a, b WT (n = 5) and IFNAR1−/− mice (n = 5) were immunized i.n. with NVT + H3N2. One day later, lung lysates and serum were collected. a Pooled lung lysates and serum samples were analyzed using a mouse cytokine kit. The signals were normalized to the pixel density of the indicated reference spots. b Concentrations of CCL2, CCL5, CXCL9, and CXCL10 in lung lysates and sera were measured via ELISA. c BALB/c Mice (n = 5 per group) were immunized i.n. with H3N2 or NVT. One day later, the levels of CCL2, CCL5, CXCL9, and CXCL10 in lung lysates and sera were assessed via ELISA. b, c Data are expressed as dot plots, with horizontal lines representing the medians. The two-sided Mann–Whitney U test was used for statistical analysis of differences between two groups. d, e BALB/c mice were immunized i.m. with H3N2 (n = 20), H3N2 + NVT (n = 10), or i.n. with H3N2 + NVT (n = 10) twice at two-week intervals. Two weeks later, mice injected i.m. with H3N2 (n = 10) or H3N2 + NVT (n = 10) were boosted i.n. with NVT. d On day 42, the proportion of lung CD4+ TRM cells from vaccinated mice (n = 5 per group) was determined via flow cytometry. e The other vaccinated mice (n = 5 per group) were infected i.n. with 4 LD50 of H1N1 virus, and survival was monitored daily. Survival data are represented as Kaplan‒Meier survival curves, and the significant differences in survival rates were calculated by the log-rank test. f BALB/c mice were immunized i.n. with H3N2 + NVT (n = 15) or i.m. with H3N2 (n = 20). Two weeks later, the mice were immunized i.m. with H3N2 or i.n. with H3N2 + NVT, H3N2, or NVT, and the proportion of lung CD4+ TRM cells was determined via flow cytometry on day 42. d, f Box and whisker plots showing the median (center), 25th and 75th percentiles (box), and lowest and highest values (whiskers). Statistical analyses were performed using one-way ANOVA with the Tukey’s multiple comparisons test. This study was performed once. ns, not significant. Source data are provided as a Source Data file.
Fig. 7
Fig. 7. The influenza NP is a conserved CD4 epitope source for cross-protection.
a Experimental design. BALB/c mice (n = 9 per group) were immunized i.n. with NVT-adjuvanted recombinant H3N2 HA (H3N2 rHA), recombinant H3N2 NP (H3N2 rNP), or H3N2 (whole vaccine) twice at two-week intervals. Two weeks after the last immunization, immune response analysis (n = 4 per group) (be) and H1N1 virus (A/Korea/2785/2009) challenge (n = 5 per group) (e) were performed. Schematic image was created in BioRender. Han, S. (2024) BioRender.com/l62g951. b, c (b) The HAI titer and (c) PRNT50 titer against H1N1 virus in serum were measured. d Lung CD4+ TRM cells were evaluated by flow cytometry. e After stimulating the lung cells with H1N1, H1N1 rHA, H1N1 rNP, H3N2, H3N2 rHA, or H3N2 rNP, IFN-γ+CD4+ T-cell response was determined via flow cytometry. d, e Box and whisker plots showing the median (center), 25th and 75th percentiles (box), and lowest and highest values (whiskers). f Mice were infected i.n. with 4 LD50 of H1N1 virus, and body weight and survival were monitored daily. Weight-loss data are shown as mean value ± SD. Survival data are represented as Kaplan‒Meier survival curves. This study was performed once. BW body weight, N.D. not detected, NT non-treated. Source data are provided as a Source Data file.
Fig. 8
Fig. 8. The principle of cross-protection was verified between the various subtypes.
a Mice (n = 5 per group) were immunized i.m. with BV or BY, or i.n. with BY + NVT twice at two-week intervals. Two weeks after the last vaccination, the mice were i.n. challenged with BV virus (B/Shandong/7/97). Body weight and survival were monitored daily. b Mice (n = 5 per group) were immunized i.m. with H3N2 or i.n. with H3N2 + NVT twice at two-week intervals. Two weeks after the last vaccination, the mice were i.n. challenged with canine H3N2 virus (A/canine/VC378/2012). Body weight and survival were monitored daily. c Mice (n = 5 per group) were immunized i.m. with QIV or i.n. with QIV + NVT twice at two-week intervals. Two weeks after the last vaccination, the mice were i.n. challenged with pandemic H1N1 virus (A/Puerto Rico/8/34). Body weight and survival were monitored daily. ac Weight-loss data are shown as mean value ± SD. Survival data are represented as Kaplan‒Meier survival curves, and the significant differences in survival rates were calculated by the log-rank test. d Mice (n = 20 per group) were immunized i.m. with 2020-2021 season QIV, or i.n. with QIV + NVT twice at two-week intervals. Two weeks after the last immunization, pooled sera and pooled lung cells were used to measure the serum HAI titer and lung CD4+ T-cell response to each indicated seasonal influenza vaccine strain. The data are expressed as dot plots, with horizontal lines representing the medians. These experiments were performed once. ns, not significant. Source data are provided as a Source Data file.
Fig. 9
Fig. 9. NVT-adjuvanted intranasal vaccine contributes to cross-protection in the ferret model.
Ferrets (n = 6 per group) were vaccinated i.m. with H3N2 or i.n. with H3N2 + NVT twice at two-week intervals. Two weeks after the last immunization, immune response analysis (n = 3 per group) (a, b) and H1N1 virus (A/Korea/2785/2009) challenge (n = 3 per group) (c) were performed. a HAI antibody titers against H3N2 or H1N1 in serum were measured by HAI assay. An HAI antibody titer of 1:40 (red dotted line) was considered protective against influenza infection. b Lung and spleen cells were stimulated with H1N1 or H3N2 for 3 days, and the production of IFN-γ in the culture supernatant was measured using ELISA. a, b Data are expressed as dot plots, with horizontal lines representing the medians. c The vaccinated ferrets were infected i.n. with 1 × 107 PFU of H1N1 virus. Nasal wash samples were collected on days 0, 1, 3, and 5 post-challenge, and viral titers were determined using a plaque assay. Data are shown as mean value ± SD. ac Statistical analyses were performed using one-way ANOVA with Tukey’s multiple comparisons test or two-sided Mann–Whitney U test. The ferret study was performed independently three times, and one representative set is shown. N.D., not detected; ns, not significant. Source data are provided as a Source Data file.

References

    1. Nypaver, C., Dehlinger, C. & Carter, C. Influenza and Influenza Vaccine: A Review. J. Midwifery Women’s Health66, 45–53 (2021). - PMC - PubMed
    1. Wei, C. J. et al. Next-generation influenza vaccines: opportunities and challenges. Nat. Rev. Drug Discov.19, 239–252 (2020). - PMC - PubMed
    1. Soema, P. C., Kompier, R., Amorij, J. P. & Kersten, G. F. Current and next generation influenza vaccines: Formulation and production strategies. Eur. J. Pharm. Biopharm.94, 251–263 (2015). - PubMed
    1. Gupta, D. & Mohan, S. Influenza vaccine: a review on current scenario and future prospects. J. Genet Eng. Biotechnol.21, 154 (2023). - PMC - PubMed
    1. Houser, K. & Subbarao, K. Influenza vaccines: challenges and solutions. Cell Host Microbe17, 295–300 (2015). - PMC - PubMed

Publication types

MeSH terms