. 2024 Nov 28;15(1):10349.
doi: 10.1038/s41467-024-54619-x.

Microglia regulate motor neuron plasticity via reciprocal fractalkine and adenosine signaling

Affiliations

Microglia regulate motor neuron plasticity via reciprocal fractalkine and adenosine signaling

Alexandria B Marciante et al. Nat Commun. .

Abstract

We report an important role for microglia in regulating neuroplasticity within phrenic motor neurons. Brief episodes of low oxygen (acute intermittent hypoxia; AIH) elicit a form of respiratory motor plasticity known as phrenic long-term facilitation (pLTF) that is regulated by the balance of competing serotonin vs adenosine-initiated cellular mechanisms. Serotonin arises from brainstem raphe neurons, but the source of adenosine is unknown. We tested if hypoxic episodes initiate phrenic motor neuron to microglia fractalkine signaling that evokes extracellular adenosine formation using a well-defined neurophysiology preparation in male rats. With moderate AIH, phrenic motor neuron adenosine 2A receptor activation undermines serotonin-dominant pLTF whereas severe AIH induces pLTF by the adenosine-dependent mechanism. Consequently, phrenic motor neuron fractalkine knockdown, microglial fractalkine receptor inhibition, and microglial ablation enhance moderate AIH, but suppress severe AIH-induced pLTF. We conclude, microglia play important roles in healthy spinal cords, regulating plasticity in motor neurons responsible for breathing.


Conflict of interest statement

Competing interests: The authors declare no competing interests.

Figures

Fig. 1
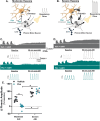
Fig. 1. Fkn increases extracellular adenosine levels in the cervical spinal cord and elicits adenosine-dependent phrenic motor facilitation.
A Schematic of experimental setup with intrathecal drug delivery and placement of adenosine (ADO) and inosine (INO) micro-biosensors. B Intrathecal fractalkine (Fkn; 100 ng; 12 μL) delivery evoked a slow increase in extracellular adenosine concentration over 30 min (n = 3 independent recordings from 3 rats; Linear Regression ANOVA: *p < 0.001; r = 0.993, r2 = 0.986, Adjusted r2 = 0.986). Concurrently, phrenic nerve activity was recorded in urethane anesthetized rats maintained at baseline conditions during and after intrathecal Fkn injection (90 min post-delivery). Ventilator volumes were set for each rat based on body mass (0.007 ml * body mass, g; 72–74 breaths per minute). Inspired CO2 or ventilator frequency was adjusted to maintain end-tidal PCO2 between 38 and 41 mmHg. Blood gas measurements were taken 2–3 times during the initial baseline, and at 30, 60, and 90-min post-drug (Supplementary Table 1). C Schematic of inter-cellular signaling highlighting where receptors/enzymes were blocked/inhibited in DH. Representative compressed neurograms of integrated phrenic nerve activity are shown for rats that received (D) vehicle (VEH; time controls; n = 7 rats, each rat with 1 independent recording), E VEH + Fkn (n = 6 rats, each rat with 1 independent recording), (F) CX3CR1 inhibitor, AZD8797 + Fkn (n = 7 rats, each with 1 independent recording), G ATPase inhibitor, ARL67156 + Fkn (n = 7 rats, each with 1 independent recording), and H A2A Receptor inhibitor, MSX-3 + Fkn (n = 7 rats, each with 1 independent recording). I Phrenic burst amplitude (percent change from baseline; % baseline) was significantly increased 90 min post-Fkn administration (VEH + Fkn); however, CX3CR1, ATPase and A2A receptor inhibition (schematized in C) attenuated or prevented phrenic motor facilitation (F(4,29) = 21.378, p < 0.001; one-way ANOVA). *p < 0.001, significant differences vs all groups; Tukey post-hoc Test. Bars show mean ± SEM. Source data are provided as a Source Data file. Figures created in BioRender. Marciante, A. (2024) https://BioRender.com/e55f542.
Fig. 2
Fig. 2. Severe (vs moderate) hypoxic episodes evoke greater spinal adenosine accumulation.
A Adenosine/inosine probes were placed between ventral C3/C4 to measure changes in adenosine accumulation during hypoxia. B Average traces of extracellular adenosine concentration (µM) during 5 min of moderate (PaO2 = 42.7 ± 2.0 mmHg) or severe (PaO2 = 27.2 ± 0.8 mmHg) hypoxia (n = 5 independent recordings per group, collected in 3 rats). Measurements of technical replicates allowed appropriate ‘washout’ time between subsequent hypoxic exposures for extracellular adenosine to return to baseline levels, consistent with published data from our laboratory. Measurements between biological and within technical replicates did not differentiate more than one standard deviation from each other (see Source Data). Greater adenosine accumulation was observed in severe hypoxic episodes when expressed as C peak adenosine level ([ADO]peak; t(8) = −5.299, p < 0.001; unpaired t-test, two-sided) or D total area under the curve ([ADO]AUC; t(8) = −4.218, p = 0.003; unpaired t-test, two-sided). E PaO2 strongly correlates with measured extracellular adenosine levels (F(1,14) = 206.099, p < 0.0001; nonlinear regression ANOVA; r = 0.9677, r2 = 0.9364, adjusted r2 = 0.9318; nonlinear regression). Adjustments were made for multiple comparisons. Bars are means ± SEM. Source data are provided as a Source Data file. Figures created in BioRender. Marciante, A. (2024) https://BioRender.com/e55f542.
Fig. 3
Fig. 3. Intrathecal fractalkine differentially regulates moderate (serotonin-dominant) vs severe (adenosine-dominant) AIH-induced pLTF.
Schematic of hypothesized mechanisms for intrathecal and hypoxia-evoked fractalkine (Fkn) release on moderate (A: serotonin-driven Q pathway) vs severe AIH-induced pLTF (B: adenosine-driven S pathway). Phrenic nerve activity was recorded in urethane anesthetized rats during baseline, during intrathecal drug administration, and for 90 min post-treatment while baseline conditions were maintained. Inspired CO2 and/or ventilator frequency was adjusted to maintain end-tidal PCO2 between 38 and 41 mmHg. Blood gas measurements were taken 2-3 times during the initial baseline, during the last minute of the first hypoxic episode, and at 30, 60, and 90 min post-AIH (Supplementary Tables 1 and 2). Raw integrated phrenic nerve amplitude at baseline and during maximal chemoreceptor stimulation (10% O2, 7% CO2, balance N2) delivered at the end of each experiment are included in Supplementary Table 3 to assess recording quality. C, D Representative compressed neurograms with corresponding scale bars of integrated phrenic nerve activity from rats that received vehicle (VEH; top row) or fractalkine (Fkn; bottom row) ~30 min prior to moderate (C; VEH: n = 7 rats, each with 1 independent recording; Fkn: n = 8 independent recordings from 8 rats) or severe (D; VEH: n = 7 rats, each with 1 independent recording; Fkn: n = 5 independent recordings from 5 rats) AIH. Immediately below each neurogram are individual, integrated () phrenic nerve bursts taken during baseline and 90 min post-AIH. One-minute averages of phrenic nerve burst amplitude were measured at 90 min post-AIH, and are presented as percent change from the pre-AIH baseline value (E); there was a statistically significant interaction between drug (VEH vs Fkn) and AIH protocol (moderate vs severe) on pLTF (F(1,23) = 22.316, p < 0.001; two-way ANOVA). *p < 0.001; Tukey post-hoc Test. Bars are means ± SEM. Source data are provided as a Source Data file. Figures created in BioRender. Marciante, A. (2024) https://BioRender.com/e55f542.
Fig. 4
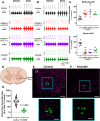
Fig. 4. Microglia differentially regulate moderate (serotonin-driven) vs severe (adenosine-driven) AIH-induced pLTF.
A, B Representative individual, integrated () and raw phrenic (Phr) nerve bursts during baseline and 90 min post-AIH from a vehicle (VEH) control (top row), spinal CX3CR1-inhibited (CX3CR1i) rat using AZD8797 or JMS-17-2, and PLX3397-treated rat (bottom row) prior to moderate (mAIH; A) or severe AIH (sAIH; B). One-minute averages of phrenic nerve burst amplitude were measured 90 min post-AIH and are presented as percent change from baseline (C). There was a statistically significant effect of the drug (VEH vs AZD8797 or JMS-17-2 or PLX3397) on pLTF following moderate AIH (top; n = 4 rats, each with 1 independent recording per group (PLX3397 and JMS-17-2); or 7 rats, each with 1 independent recording per group (VEH and AZD8797); F(3,18) = 9.724, p < 0.001; one-way ANOVA) or severe AIH (bottom; n = 5 rats, each with 1 independent recording (JMS-17-2) or 6 rats, each with 1 independent recording (PLX3397); or 7 rats, each with 1 independent recording per group (VEH and AZD8797); F(3, 21) = 49.34, p < 0.001; one-way ANOVA); *p < 0.050, significant differences (vs VEH controls; moderate: AZD9797, p = 0.011; JMS-17-2, p = 0.002; PLX3397, p = 0.041; severe: all groups p < 0.0001; Tukey post-hoc Test). D Schematic outlining region of the ventral horn where microglia were counted after VEH (spinal tissue from n = 5 rats per group with at least 10 sections per rat) or PLEX3397 (spinal tissue from n = 6 rats per group with at least 10 sections per rat) treatment. Representative confocal microscope images from VEH control (E) and PLX3397-treated rats (F) stained for Iba-1 positive microglia (magenta) and phrenic motor neurons (CtB; green). Scale bar (left; 10x magnification): 150 µm; scale bar (right; 40x magnification): 50 µm. G Ventral horn Iba-1 positive microglia were counted using a custom code (see “Code Availability” section); Iba-1 positive microglia counts were significantly reduced in spinal cords of PLX3397-treated rats (spinal tissue from n = 6 rats per group with at least 10 sections per rat) versus controls that did not receive PLX3397 (spinal tissue from n = 5 rats per group with at least 10 sections per rat; t(9) = 8.347, p = 0.00002; unpaired t-test, two-sided). Bars are means ± SEM. Source data are provided as a Source Data file. Figures created in BioRender. Marciante, A. (2024) https://BioRender.com/e55f542.
Fig. 5
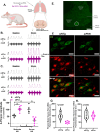
Fig. 5. Phrenic motor neuron fractalkine undermines moderate (serotonin-dominant) AIH-induced pLTF but is required for severe (adenosine-dominant) AIH-induced pLTF.
A Schematic depicting intrapleural injections for retrograde siRNA transport (nontargeting controls, siNTg; rat CX3CL1/fractalkine, siFkn) and CtB to phrenic motor neurons. Representative individual, integrated () and raw phrenic (Phr) nerve bursts taken during baseline and 90 min post-AIH from siNTg- (top row) and siFkn-injected rats (bottom row) prior to moderate (mAIH; B) or severe AIH (sAIH; C). One-minute averages of phrenic nerve amplitude were measured 90 min post-AIH, and are presented as percent change from baseline (D); there was a statistically significant interaction between siRNA (siNTg vs siFkn) and AIH protocol (moderate vs severe) on pLTF (siNTg: n = 4 rats each with 1 independent recording per group; siFkn: n = 7 rats, each with 1 independent recording per group; F(1,18) = 45.431, p < 0.001; two-way ANOVA). *p < 0.01 (siNTg vs siFkn: moderate, p = 0.002; severe, p < 0.001; mAIH vs sAIH: siNTg, p = 0.006; siFkn, p < 0.001; Tukey post-hoc Test). E Representative confocal microscope image of cervical ventral horn; phrenic motor nucleus circled; phrenic motor neurons identified with CtB (green); scale bar (10x magnification): 150 µm; spinal tissue from n = 10 rats. F Representative confocal microscope images from siNTg (left) and siFkn (right)-injected groups stained for CtB (green) and Fkn mRNA (red); scale bar (40x magnification): 20 µm; spinal tissue from n = 5 rats per group. G Fkn mRNA fluorescence intensity was significantly reduced in siFkn vs siNTg phrenic motor neurons (spinal tissue from n = 5 rats per group, at least 10 sections per rat; t(8) = 4.812, p = 0.001; unpaired t-test, two-sided). H Fractalkine mRNA fluorescent intensity in non-phrenic motor neurons was similar between siNTg and siFkn groups (t(8) = 0.542, p = 0.602; unpaired t-test, two-sided). Bars are means ± SEM. Source data are provided as a Source Data file. Figures created in BioRender. Marciante, A. (2024) https://BioRender.com/e55f542.
Fig. 6
Fig. 6. Intercellular model of reciprocal phrenic motor neuron Fkn to microglial CX3CR1 interactions during moderate and severe AIH-induced phrenic motor plasticity.
Hypoxia triggers phrenic motor neuron Fkn signaling in a hypoxia dose-dependent manner. Fkn binds to its receptor, CX3CR1, on nearby microglia, triggering microglia-dependent formation and accumulation of extracellular adenosine (ADO). ADO activates phrenic motor neuron adenosine 2A (A2A) receptors, constraining the serotonin-dominant (Q) pathway to pLTF during moderate hypoxia (left). In contrast, severe hypoxia, and greater extracellular adenosine accumulation, shifts the serotonin/adenosine balance sufficiently to drive the adenosine-dominant S pathway to pLTF (right). Figures created in BioRender. Marciante, A. (2024) https://BioRender.com/e55f542.

Update of

References

    1. Imura, Y. et al. Microglia release ATP by exocytosis. Glia61, 1320–1330 (2013). - PubMed
    1. Lauro, C. et al. Activity of adenosine receptors type 1 Is required for CX3CL1-mediated neuroprotection and neuromodulation in hippocampal neurons. J. Immunol.180, 7590–7596 (2008). - PubMed
    1. Piccinin, S. et al. CX3CL1-induced modulation at CA1 synapses reveals multiple mechanisms of EPSC modulation involving adenosine receptor subtypes. J. Neuroimmunol.224, 85–92 (2010). - PubMed
    1. Camacho-Hernandez, N. P. & Pena-Ortega, F. Fractalkine/CX3CR1-dependent modulation of synaptic and network plasticity in health and disease. Neural Plast.2023, 4637073 (2023). - PMC - PubMed
    1. Sheridan, G. K. & Murphy, K. J. Neuron-glia crosstalk in health and disease: fractalkine and CX3CR1 take centre stage. Open Biol.3, 130181 (2013). - PMC - PubMed

Publication types

LinkOut - more resources