. 2024 Nov 28;15(1):10316.
doi: 10.1038/s41467-024-54734-9.

Machine learning-enhanced immunopeptidomics applied to T-cell epitope discovery for COVID-19 vaccines

Affiliations

Machine learning-enhanced immunopeptidomics applied to T-cell epitope discovery for COVID-19 vaccines

Kevin A Kovalchik et al. Nat Commun. .

Abstract

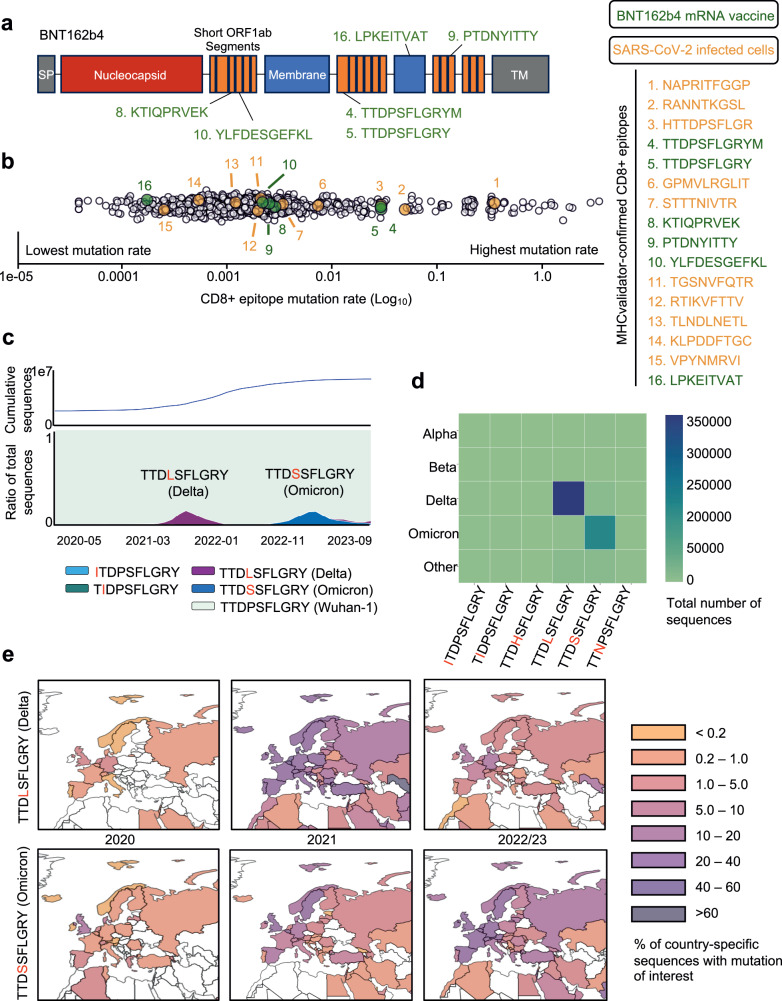
Next-generation T-cell-directed vaccines for COVID-19 focus on establishing lasting T-cell immunity against current and emerging SARS-CoV-2 variants. Precise identification of conserved T-cell epitopes is critical for designing effective vaccines. Here we introduce a comprehensive computational framework incorporating a machine learning algorithm-MHCvalidator-to enhance mass spectrometry-based immunopeptidomics sensitivity. MHCvalidator identifies unique T-cell epitopes presented by the B7 supertype, including an epitope from a + 1-frameshift in a truncated Spike antigen, supported by ribosome profiling. Analysis of 100,512 COVID-19 patient proteomes shows Spike antigen truncation in 0.85% of cases, revealing frameshifted viral antigens at the population level. Our EpiTrack pipeline tracks global mutations of MHCvalidator-identified CD8 + T-cell epitopes from the BNT162b4 vaccine. While most vaccine epitopes remain globally conserved, an immunodominant A*01-associated epitope mutates in Delta and Omicron variants. This work highlights SARS-CoV-2 antigenic features and emphasizes the importance of continuous adaptation in T-cell vaccine development.


Conflict of interest statement

Competing interests: E.C. and I.S. are co-founders of Neomabs Biotechnologies Inc. PT is a co-founder of Epitopea. A.S. is a consultant for Alcimed, Gritstone, Darwin Health, EmerVax, Gilead Sciences, Guggenheim Securities, Link University, RiverVest Venture Partners, and Arcturus. La Jolla Institute for Immunology has filed for patent protection for various aspects of T cell epitope and vaccine design work. All other authors declare no competing interests. Inclusion & Ethics Statement: This research prioritizes inclusivity by engaging diverse populations, particularly underrepresented groups. All participants provided informed consent, and their confidentiality was safeguarded in accordance with ethical guidelines. The contributions of all team members were acknowledged, and potential biases were actively addressed. We aim to conduct research that advances knowledge while respecting the rights and dignity of all individuals involved.

Figures

Fig. 1
Fig. 1. Schematic of the computational framework and analysis platform for informing next-generation T-cell vaccine design.
(1) MS-based immunopeptidomics for data acquisition, (2) MHCvalidator for HLA-I-specific PSMs confidence assessment and optimal identification of both canonical and non-canonical HLA-I viral peptides, (3) population-scale analysis of SARS-CoV-2 proteome diversity using intra-host databases, (4) T-cell epitope immunogenicity assessment, (5) EpiTrack for geo-temporal analysis of epitope conservation across variants, (6) selection of immunogenic and stable epitopes to inform optimal T-cell vaccine design. T-cell epitopes encoded by the BNT162b4 mRNA-based vaccine were analyzed in this study. Created in BioRender. Hamelin, D. (2024) BioRender.com/l76m979.
Fig. 2
Fig. 2. Architecture of MHCvalidator for HLA-I-specific PSMs confidence assessment.
a Schematic illustrating the main components, workflow and possible configurations of MHCvalidator. The components governing the configurations of MHCvalidator are NN-validator, APP and PE (orange). NN-validator represents the core component for PSMs confidence assessment. It accepts input files (PIN, csv/tsv) and processes training features via a multi-layer perceptron (MLP); APP provides antigen processing and presentation prediction scores via MHCflurry and NetMHCpan; PE provides encoded peptide sequences via a convolutional neural network (CNN). b Example distributions of target-decoy PSMs after integration of various prediction scores generated by MHCflurry and NetMHCpan. c Cartoon illustrating the sequence encoding process and the learned filters for PSM rescoring based on sequence composition.
Fig. 3
Fig. 3. Comparative analysis between MHCvalidator and Percolator for HLA-I-specific PSMs confidence assessment.
The analyses were performed using immunopeptidomic MS data generated from JY cells. a Number of HLA-I-specific PSMs identified below a given FDRs by Percolator (dotted line) and four configurations of MHCvalidator (NN-validator only: blue, NN-validator and PE: green, NN-validator and APP: orange, NN-validator, PE and APP: red). b Venn diagram showing the number of high-confidence HLA-I peptides validated by MHCvalidator and Percolator. c Representative motifs extracted using the MixMHCp 2.1 tool from high-confidence peptides that were identified by both Percolator and MHCvalidator (upper motifs), and uniquely by MHCvalidator (lower motifs) in (b). d Mirror images of a representative MS/MS spectra showing alignments of fragment ions generated from Prosit prediction (bottom) vs native/endogenous peptide uniquely identified by MHCvalidator (top). Different values were generated for each peptide tested (right). Distribution of delta retention time (e), spectral angle (f), Person correlation (g) and Spearman correlation (h) for peptides uniquely identified with MHCvalidator versus those identified by both Percolator and MHCvalidator. Source data are provided as a Source Data file.
Fig. 4
Fig. 4. Sensitivity and specificity of MHCvalidator.
a Histogram illustrating the number of HLA-I-specific peptides that were deemed of high-confidence by MHCvalidator and Percolator (y-axis) following twofold serial dilutions of HLA-I peptides isolated from JY cells (x-axis). Fold-increase of peptides identified by MHCvalidator over that of Percolator is indicated for each dilution. The benchmarking reference used for comparisons corresponds to the peptides that were identified by Percolator in the undiluted sample (–). Legend: Peptides identified by Percolator (blue) and MHCvalidator (red) found in the benchmarking reference; high-confidence peptides not found in the benchmarking reference by Percolator (pale blue) and MHCvalidator (pale red). Distribution of XCorr values (b) and peptide length (c) for PSMs found uniquely with MHCvalidator versus those found with Percolator from the most diluted JY sample (16x). We performed a standard independent 2-sample t-test that assumes equal population variances for these instances. Box plot showing the number of HLA-I-specific PSMs “deemed high-confidence” that were found in a yeast proteome (d) or human proteome digested with Lys-C (e) using Percolator and the four configurations of MHCvalidator (NN-validator only, NN-validator and PE, NN-validator and APP, as well as NN-validator with PE and APP). Boxplots/error bars are based on 1550 samples derived from the monoallelic dataset (d). The LysC digestion analysis is based on a subset of these data, 145 samples in total that were randomly selected from the complete monoallelic dataset (e). Boxplots are given in Inter Quartile Ranges (IQRs) where the box extends from the first quartile (Q1) to the third quartile (Q3) of the data, with a line at the median. The whiskers extend from the box to the farthest data point lying within 1.5x the inter-quartile range (IQR) from the box. Flier points are those past the end of the whiskers. Source data are provided as a Source Data file.
Fig. 5
Fig. 5. Analysis of SARS-CoV-2 HLA-I peptides discovered by MHCvalidator.
a Venn diagram showing the number of high-confidence SARS-CoV-2 HLA-I peptides identified by the original method described by Nagler et al., and by MHCvalidator’s optimal configuration (NN-validator+PE + APP). Overlapping peptides are shown. Peptides selected for immunogenicity experiments are also indicated. b Table showing the list of SARS-CoV-2-derived peptides identified by MHCvalidator. Source protein, NetMHCpan/HLAthena prediction score and HLA allele assignment are indicated in the table. A reference number is shown for peptides that have already been detected by MS in previous studies; if not detected before by MS, ‘New’ is indicated. ND: not determined. c Histogram showing the proportion of confirmed assigned peptides (y-axis) for their respective HLA-A or -B allele (x-axis). HLA assignment was predicted in (b), and confirmed by in vitro HLA binding assay. Number of peptides (assigned/total) per allele is shown on top of each bar. d Heatmap illustrating the measured binding affinity (IC50 nM) across different HLA-A and -B alleles for all assigned peptides in (b). e Mirror spectral image showing alignments of fragment ions in MS/MS spectra of synthetic vs native MHCvalidated-peptides. Two representative peptides tested for immunogenicity are shown along with the Pearson correlation coefficient between the two MS/MS spectra. f Peptides were classified into five categories. Source data are provided as a Source Data file.
Fig. 6
Fig. 6. Generation of a B7-associated SARS-CoV-2 peptide encoded by a junction-driven altered reading frame in the Spike antigen.
a Amino acid sequence in the Wuhan-1 (wild-type) and the truncated (deletion) Spike proteins. The uniquely generated peptide sequence due to the deletion is highlighted in brown. The LPYPQILLL peptide is emphasized by being bolded and circled. Created in BioRender. Hamelin, D. (2024) BioRender.com/k07e042. b The deletion (or leader-independent junction) from position 5’−23594 to 23624-3’ at the mRNA level, and the resulting +1 frameshift at the amino acid level is illustrated. Measured (non-italic) or predicted (italic) HLA binding affinity of the junction-dependent peptide LPYPQILLL (orange) is indicated for several HLA-B alleles, which all belong to the B7 supertype family. c Histogram illustrating the number of patients from the intra-host database showing a deletion/junction-driven +1 or +2 frameshift, or no frameshift (in-frame), in more than 100 reads. Deletions were analyzed between position 5’−23,623 and 23,693-3’. d Table and violin plot indicating the lengths of the deleted nucleic acid sequences (average, max and min) leading to in-frame, +1 or +2 frameshift. Source data are provided as a Source Data file.
Fig. 7
Fig. 7. Immunogenicity of SARS-CoV-2 HLA-I peptides discovered by MHCvalidator.
a Graph showing IFNγ secreting cells per million (y-axis) in response to the peptides identified by MS and MHCvalidator (x-axis). Data were generated by ELISpot for the indicated HLA types. N: number of HLA-matched PBMCs/individuals tested. The immunodominant peptide YLQPRTFLL is indicated as positive control (+Ctrl); ratio of individuals responding to it is indicated (red). b Representative well image of ELISpot assay. c Pie chart showing the fraction of MHCvalidator-discovered peptides tested for immunogenicity by ELISpot. Tables showing peptide sequences, rate of HLA-matched individuals responding to the corresponding peptide, and immune epitope database (IEDB) identification number (ID). Novel immunogenic peptides (orange) and previously reported immunogenic peptides (blue). d Graph showing correlation between predicted HLA binding affinity (y-axis) and response frequency by ELISpot (x-axis). The A*02:01- and A*68:01-associated peptide RTIKVFTTV, shown to be immunogenic by ELISpot and DNA-barcoded pMHC multimers is indicated. e Peptide-specific T-cell responses identified using DNA-barcoded pMHC multimers in four patients in the acute phase of SARS-CoV-2 infection. Confirmed response are colored and the size of the colored dots is according to the estimated frequency. Two patients with RTIKVFTTV and YLQPRTFLL are indicated. Source data are provided as a Source Data file.
Fig. 8
Fig. 8. Querying the evolutionary dynamics of MHCvalidator-identified CD8+ epitopes using EpiTrack.
a Schematic of the BNT162b4 mRNA vaccine. b Comprehensive (GISAID, 2020-2023) mutation rate of CD8+ epitopes identified from SARS-CoV-2-infected cells (Orange); BNT162b4 mRNA vaccine (Green); and a control consisting of 9-mers spanning the complete SARS-CoV-2 proteome (White). For all epitopes shown, the rate of mutation was expressed as the number of alternative epitopes found across the GISAID database (with a minimum of 10 GISAID sequences per alternative epitope) divided by the total number of GISAID sequences for which the epitope had sequencing coverage, presented in log10. c (Bottom) Proportion of GISAID sequences over time (2020-2023) for which the TTDPSFLGRY epitope (BNT162b4 mRNA vaccine, MHC-Validator-identified) was unmutated (Cyan) or mutated (purple, dark blue, light blue and green, in order of descending prevalence). Only top alternative epitopes (found in >1000 GISAID sequences) shown here. (Top) cumulative count of GISAID sequences over time. d Variant of Concern (VOC) associated with top alternative epitopes. The color scale corresponds to the number of GISAID sequences for which an alternative epitope is associated with a VOC. e Geographic map of the prevalence of top TTDPSFLGRY alternative epitopes (top: TTDP/LSFLGRY, Delta; bottom: TTDP/SSFLGRY, Omicron), with a focus on European countries. The color scale represents the proportion of GISAID sequences generated by each country featuring the alternative epitope in question, thus normalizing for country-specific sequencing bias. Source data are provided as a Source Data file.

References

    1. Le, T. T. et al. The COVID-19 vaccine development landscape. Nat. Rev. Drug Discov.19, 305–306 (2020). - PubMed
    1. Watson, O. J. et al. Global impact of the first year of COVID-19 vaccination: A mathematical modelling study. Lancet Infect. Dis.22, 1293–1302 (2022). - PMC - PubMed
    1. Cao, Y. et al. Omicron escapes the majority of existing SARS-CoV-2 neutralizing antibodies. Nature602, 657–663 (2022). - PMC - PubMed
    1. Wang, Q. et al. Alarming antibody evasion properties of rising SARS-CoV-2 BQ and XBB subvariants. Cell186, 279–286.e8 (2023). - PMC - PubMed
    1. Jian, F. et al. Further humoral immunity evasion of emerging SARS-CoV-2 BA.4 and BA.5 subvariants. Lancet Infect. Dis.22, 1535–1537 (2022). - PMC - PubMed

Publication types

MeSH terms

Substances

Supplementary concepts