. 2024 Nov 28;14(1):29552.
doi: 10.1038/s41598-024-80570-4.

A DNA methylation signature identified in the buccal mucosa reflecting active tuberculosis is changing during tuberculosis treatment

Affiliations

A DNA methylation signature identified in the buccal mucosa reflecting active tuberculosis is changing during tuberculosis treatment

Isabelle Öhrnberg et al. Sci Rep. .

Abstract

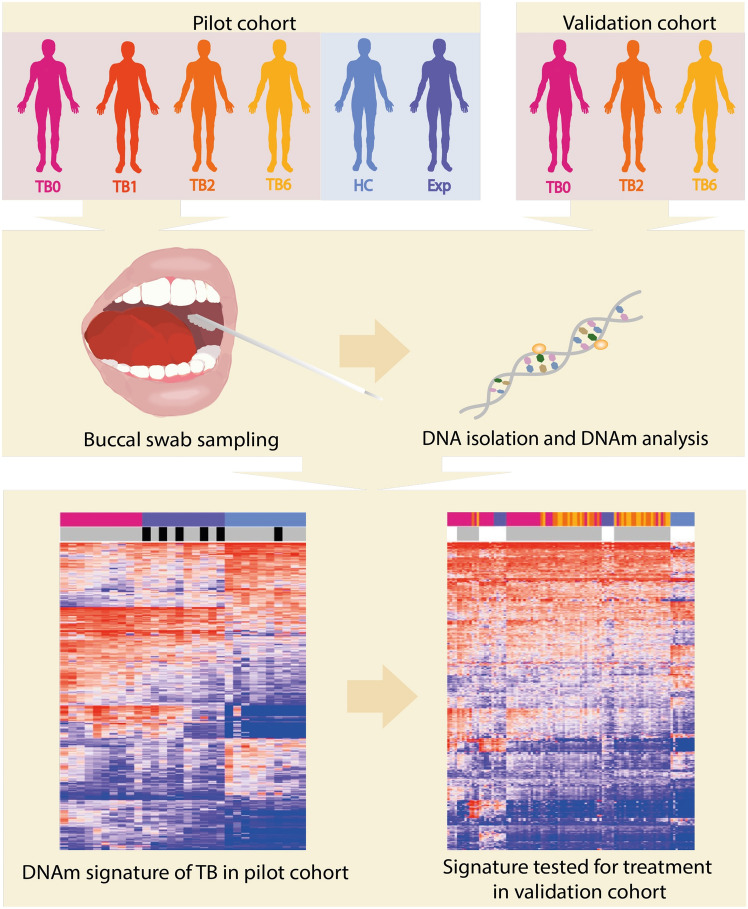
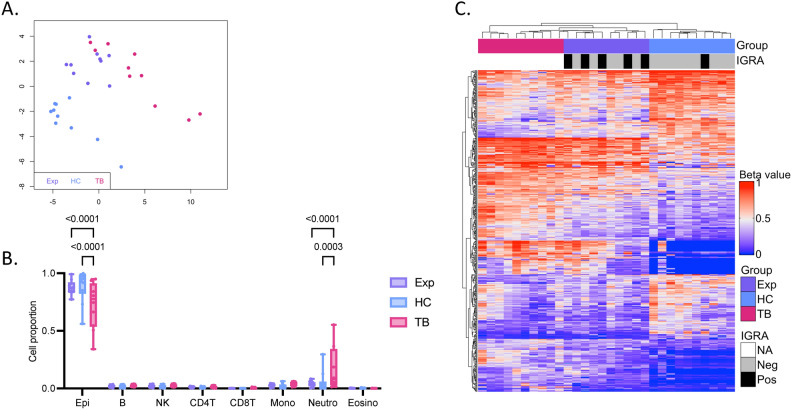
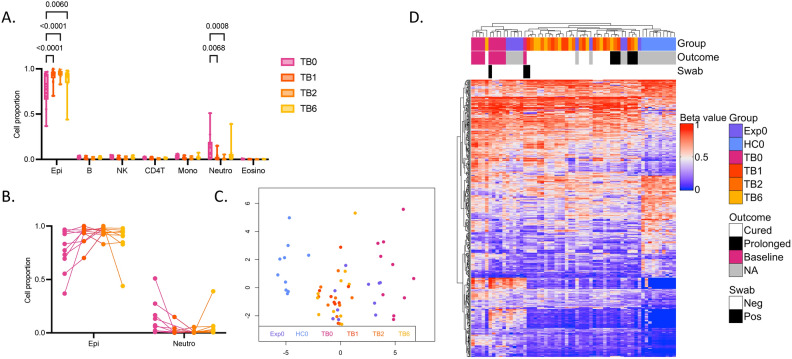
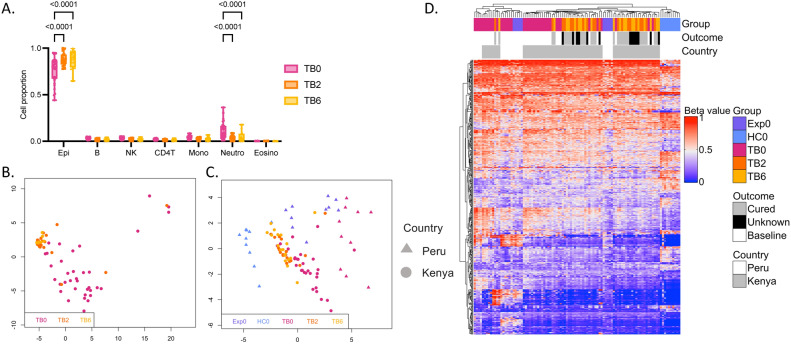
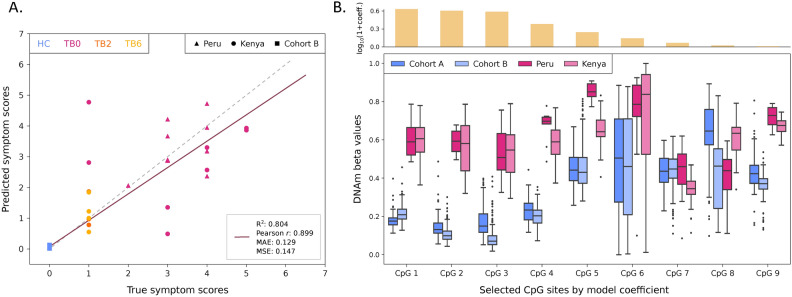
Tuberculosis (TB) poses a significant global health threat, with high mortality rates if left untreated. Current sputum-based TB treatment monitoring methods face numerous challenges, particularly in relation to sample collection and analysis. This pilot study explores the potential of TB status assessment using DNA methylation (DNAm) signatures, which are gaining recognition as diagnostic and predictive tools for various diseases. We collected buccal swab samples from pulmonary TB patients at the commencement of TB treatment (n = 10), and at one, two, and six-month follow-up intervals. We also collected samples from healthy controls (n = 10) and individuals exposed to TB (n = 10). DNAm patterns were mapped using the Illumina Infinium Methylation EPIC 850 K platform. A DNAm profile distinct from controls was discovered in the oral mucosa of TB patients at the start of treatment, and this profile changed throughout the course of TB treatment. These findings were corroborated in a separate validation cohort of TB patients (n = 41), monitored at two and six months into their TB treatment. We developed a machine learning model to predict symptom scores using the identified DNAm TB profile. The model was trained and evaluated on the pilot, validation, and two additional independent cohorts, achieving an R2 of 0.80, Pearson correlation of 0.90, and mean absolute error of 0.13. While validation is needed in larger cohorts, the result opens the possibility of employing DNAm-based diagnostic and prognostic tools for TB in future clinical practice.

Keywords: Biosignatures; Buccal mucosa; DNA methylation; Oral swabs; Treatment monitoring; Tuberculosis.


Conflict of interest statement

Declarations. Competing interests: The authors declare no competing interests.

Figures

Fig. 1
Fig. 1
Overview of the study. Buccal swab samples were collected from TB patients at treatment start (TB0), at 1 month (TB1), 2 months (TB2), 6 months (TB6) of treatment and healthy controls (HC) and TB exposed (Exp) in a pilot cohort. DNA was isolated from the swab samples and DNA methylation (DNAm) analysis performed. Via computational analyses, a DNAm signature of TB was identified that was later tested for patients undergoing TB treatment in a validation cohort. TB, tuberculosis; TB0, TB patients at baseline; TB1, TB patients 1 month into treatment; TB2, TB patients 2 months into treatment; TB6, TB patients 6 months into treatment; HC, healthy controls; Exp, exposed; DNAm, DNA methylation.
Fig. 2
Fig. 2
DNAm changes in the buccal mucosa of TB patients, TB exposed and healthy controls in pilot cohort. (A) A MDS plot of the 1,000 most variable CpG sites in the dataset (745,151 CpG sites) showing TB patients (TB) in pink, TB exposed (Exp) in purple and healthy controls (HC) in blue. (B) Cell proportions estimated using HepiDISH showing proportions of immune cells and epithelial cells in the groups. Significant difference in epithelial cells between TB and HC and Exp (p < 0.0001 and < 0.0001) and in neutrophils between TB and HC and Exp (p = 0.0003 and < 0.0001) (2-way ANOVA Tukey´s multiple comparisons test). (C) A heatmap of 468 DMCs (MMD ≥ 0.2, p.adj < 0.05) between TB and HC. Positive interferon-gamma release assay (IGRA) results for Exp and HC shown in black, and negative results shown in grey. DNAm, DNA methylation; TB, TB patients; Exp, tuberculosis exposed; HC, healthy controls; MDS, multidimensional scaling; DMCs, differentially methylated CpG sites; MMD, mean methylation difference; p.ajd, adjusted p-value; IGRA, interferon-gamma release assay.
Fig. 3
Fig. 3
CpG sites differentially methylated between TB patients and healthy controls are altered during TB treatment. (A) Cell proportions estimated using HepiDISH showing proportions of immune cells and epithelial cells in the groups. Significant difference in epithelial cells between TB patients at baseline (TB0) and after one (TB1), two (TB2) and six (TB6) months of TB treatment (p < 0.0001, < 0.0001 and 0.006, respectively) and in neutrophils between TB0 and TB1 and TB2 (p = 0.0068 and 0.008, respectively) (2-way ANOVA Tukey´s multiple comparisons test). (B) Cell proportions of epithelial cells and neutrophils over time for each patient. (C) A MDS of 468 DMCs (MMD ≥ 0.2, p.adj < 0.05) identified between TB0 and healthy controls (HC0). The MDS is showing the TB patients followed during treatment TB1, TB2 and TB6 and TB exposed individuals (Exp0). (D) A heatmap of the 468 DMCs indicating treatment outcome (Outcome) and GeneXpert positivity in the buccal swabs (Swab) for TB patients in all timepoints. TB, TB tuberculosis; MDS, multidimensional scaling; DMCs, differentially methylated CpG sites; MMD, mean methylation difference; p.adj, adjusted p-value.
Fig. 4
Fig. 4
Validation of longitudinal DNAm changes in the buccal mucosa during TB treatment in an independent cohort. (A) Cell proportions estimated using HepiDISH showing proportions of immune cells and epithelial cells in the different timepoints. Significant difference in epithelial cells between TB patients at baseline (TB0) and after 2 (TB2) and 6 (TB6) months of treatment (p < 0.0001 and < 0.0001, respectively) and in neutrophils between baseline and two and six months of treatment (p < 0.0001 and < 0.0001, respectively) (2-way ANOVA Tukey´s multiple comparisons test). (B) A MDS plot of the 1,000 most variable CpG sites in the dataset of the validation cohort (744,330 CpG sites) showing TB0 in pink, TB2 in orange and TB6 in yellow. (C) MDS plot of 468 DMCs (mean methylation difference (MMD) ≥ 0.2, p.adj < 0.05) identified between active TB patients at baseline (TB0) and healthy controls (HC0) in the pilot cohort. The MDS is showing all baseline samples from the pilot cohort (Peru, triangle) and the TB patients from the validation cohort (Kenya, circle) followed during treatment after two and six months (TB2 and TB6). (D) A heatmap of the 468 DMCs indicating group, treatment outcome and country by colour in top bar (Peru in white and Kenya in grey).
Fig. 5
Fig. 5
Performance evaluation of the symptom score predictive model and methylation beta values of the selected CpG sites. (A) Scatter plot of the predicted vs. true symptom scores of test set samples from the Kenyan cohort, baseline TB patients from the Peruvian cohort, and healthy individuals from the external validation cohort B (n = 276) obtained from the elastic net model trained with optimal hyperparameters. The regression line (purple, solid) shows the best fit to the data, while the identity line (grey, dashed) represents the perfect match between predicted and true values. Performance is evaluated using R-squared (R2), Pearson correlation, mean absolute error (MAE), and mean squared error (MSE). (B) Box plots of the DNA methylation beta values of the nine CpG sites with non-zero coefficients on the final model for the healthy external validation cohorts A and B, and the baseline TB patients from the Kenyan and Peruvian cohorts (n = 96, 250, 36, 10, respectively). The top bar plot indicates the log10 of (1 + coefficient) of each selected CpG site, representing their contribution to the model’s predictions.

Similar articles

References

    1. Geneva: World Health Organization. Global Tuberculosis Report 2023. January (World Health Organization (WHO), 2023).
    1. Tiemersma, E. W., van der Werf, M. J., Borgdorff, M. W., Williams, B. G. & Nagelkerke, N. J. D. Natural history of tuberculosis: Duration and fatality of untreated pulmonary tuberculosis in HIV negative patients: A systematic review. PLoS ONE6 (2011). - PMC - PubMed
    1. World Health Organization. WHO consolidated guidelines on tuberculosis. WHO Press (2022).
    1. World Health Organization. Definitions and reporting framework for tuberculosis - 2013 revision (updated Dec 2014 and Jan 2020) (WHO/ HTM/TB/2013.2). Euro surveillance : bulletin Européen sur les maladies transmissibles = European communicable disease bulletin (2020). - PubMed
    1. Oberhelman, R. A. et al. A Controlled study of tuberculosis diagnosis in HIV-infected and uninfected children in Peru. 10.1371/journal.pone.0120915. - PMC - PubMed

Substances