

Exploratory analysis of metabolic changes using mass spectrometry data and graph embeddings
- PMID: 39609505
- PMCID: PMC11604959
- DOI: 10.1038/s41598-024-80955-5
Exploratory analysis of metabolic changes using mass spectrometry data and graph embeddings
Abstract
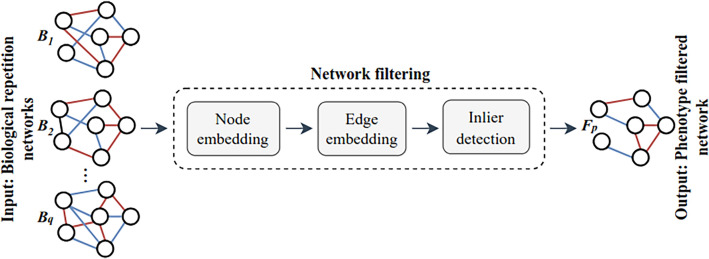
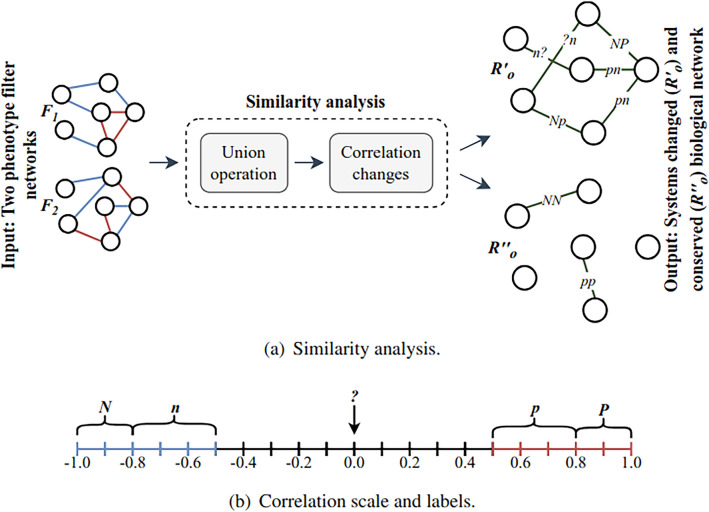
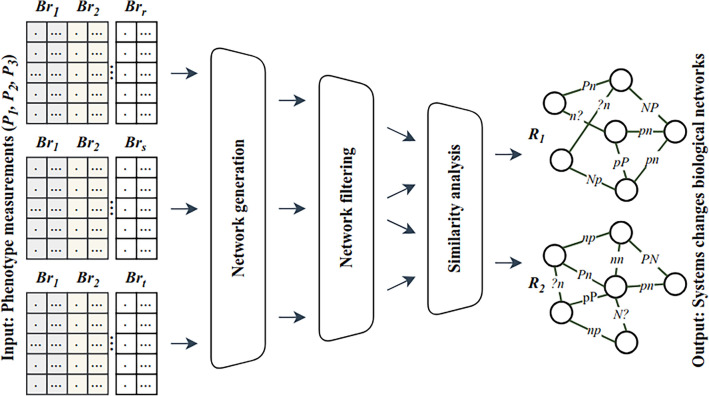
Mass spectrometry (MS)-based metabolomics analysis is a powerful tool, but it comes with its own set of challenges. The MS workflow involves multiple steps before its interpretation in what is denominate data mining. Data mining consists of a two-step process. First, the MS data is ordered, arranged, and presented for filtering before being analyzed. Second, the filtered and reduced data are analyzed using statistics to remove further variability. This holds true particularly for MS-based untargeted metabolomics studies, which focused on understanding fold changes in metabolic networks. Since the task of filtering and identifying changes from a large dataset is challenging, automated techniques for mining untargeted MS-based metabolomic data are needed. The traditional statistics-based approach tends to overfilter raw data, which may result in the removal of relevant data and lead to the identification of fewer metabolomic changes. This limitation of the traditional approach underscores the need for a new method. In this work, we present a novel deep learning approach using node embeddings (powered by GNNs), edge embeddings, and anomaly detection algorithm to analyze the data generated by mass spectrometry (MS)-based metabolomics called GEMNA (Graph Embedding-based Metabolomics Network Analysis), for example for an untargeted volatile study on Mentos candy, the data clusters produced by GEMNA were better than the ones used traditional tools, i.e., GEMNA has [Formula: see text], vs. the traditional approach has [Formula: see text].
Keywords: Graph embeddings; Graph neural networks; Mass spectrometry; Metabolomic networks.
© 2024. The Author(s).
Conflict of interest statement
Declarations. Competing interests: The authors declare no competing interests.
Figures

References
MeSH terms
Grants and funding
- No. 174-2020-FONDECYT "Doctoral Programs in Peruvian Universities"/Consejo Nacional de Ciencia, Tecnología e Innovación Tecnológica (CONCYTEC), and Fondo Nacional de Desarrollo Científico, Tecnológico y de Innovación Tecnológica (FONDECYT)
- "The Max Planck Partner Group" (Max Planck Institute for Chemical Ecology-Jena)/Max-Planck-Gesellschaft
- "The Max Planck Partner Group" (Max Planck Institute for Chemical Ecology-Jena)/Max-Planck-Gesellschaft
- Nº PE501086715-2024- PROCIENCIA)/CONCYTEC-Prociencia convocatoria E041-2024-01
LinkOut - more resources
Full Text Sources
