. 2024 Nov 28;14(1):29561.
doi: 10.1038/s41598-024-80133-7.

Regulation of antimicrobial peptides in Hermetia illucens in response to fungal exposure

Affiliations

Regulation of antimicrobial peptides in Hermetia illucens in response to fungal exposure

Neta Herman et al. Sci Rep. .

Abstract

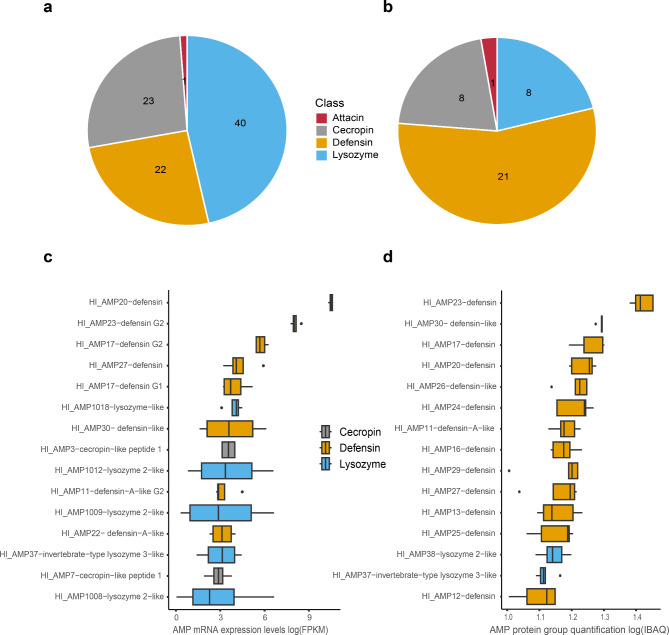
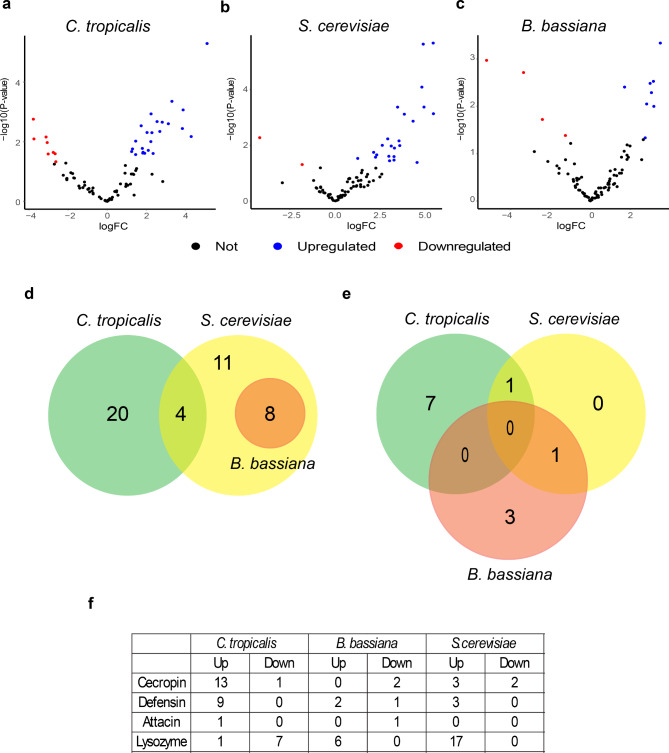
The black soldier fly (Hermetia illucens) is important for antimicrobial peptide (AMP) research due to its exposure to diverse microorganisms. However, the impact of different fungi on AMP abundance in H. illucens remains unexplored. We studied the induction of AMP expression under basal conditions and with three fungi: non-pathogenic Candida tropicalis, Saccharomyces cerevisiae, and pathogenic Beauveria bassiana, using RNA-sequencing and liquid chromatography with tandem mass spectrometry. Under naive conditions, most AMPs belonged to the lysozyme, cecropin, and defensin classes, with defensins most abundant. We demonstrate that dietary supplementation with fungi is sufficient to induce AMP expression in H. illucens. However, exposure to C. tropicalis and B. bassiana also caused downregulation of certain AMPs, suggesting that these fungi may suppress or modulate the host immune response to aid in their survival and colonization. Evidently, S. cerevisiae and B. bassiana trigger similar AMP pathways, whereas C. tropicalis elicits a distinct reaction with upregulation of defensins and cecropins. Lysozymes were upregulated by S. cerevisiae and B. bassiana, but downregulated by C. tropicalis, potentially facilitating fungal survival in the larval gut. Understanding these mechanisms opens possibilities for leveraging AMPs to combat C. tropicalis, which is implicated in human diseases.

Keywords: Beauveria bassiana; Candida tropicalis; Black soldier fly; Defensin; Lysozyme; RNA-seq.


Conflict of interest statement

Declarations. Competing interests: The authors declare no competing interests.

Figures

Fig. 1
Fig. 1
Quantification of AMPs in H. illucens larvae under naive conditions. (a) Distribution of AMP genes, identified by RNA-seq in fat body of H. illucens under naive conditions, among different classes: lysozymes, cecropins, defensins, and attacins. (b) Distribution of AMP protein groups identified by LC–MS/MS in H. illucens hemolymph under naive conditions among different classes: lysozymes, cecropins, defensins, and attacins. (c) Expression levels of the 15 highest expressed AMP genes identified by RNA-seq analysis. The box plot displays their distribution across four biological replicates, measured in FPKM (Fragments Per Kilobase of transcript per Million mapped reads). Genes labeled with the same AMP number followed by “Gn” (gene) indicate AMP genes that were identified as distinct entities in the RNA-seq data but grouped together in the LC–MS/MS analysis due to high similarity of their protein sequences. Genes numbered 1,000 or higher were detected in the RNA-seq analysis but not in the LC–MS/MS data. (d) Quantification of the 15 most abundant AMP protein groups identified by LC–MS/MS. The box plot illustrates their distribution across five biological replicates, measured in log IBAQ (Intensity-Based Absolute Quantification), which estimates the relative protein abundance within the sample. *(c-d) In every box, the central band corresponds to the median value. The boxes depict the interquartile range of values (25th to 75th percentiles) of values, while the whiskers indicate the minimum and maximum values falling within 1.5 times the interquartile range. Observations beyond this whisker range are represented by dots.
Fig. 2
Fig. 2
The AMP mRNA expression response in H. illucens to feeding on pathogenic and non-pathogenic fungi. (a-c) Volcano plots depicting the P-values (-log10 scale) as a function of the gene expression fold change (log2 scale) for the comparison of (a) C. tropicalis, (b) S. cerevisiae, and (c) B. bassiana relative to the control. Each dot represents one AMP-expressed gene identified by RNA-seq. Black dots represent AMP genes that did not meet the cut-off criteria of P-value < 0.05 and absolute fold-change > 1.5 compared to the control. Blue dots indicate upregulated AMP genes (P-value < 0.05 and fold-change > 1.5), while red dots represent downregulated AMP genes (P-value < 0.05 and fold-change < −1.5). (d-e) Venn diagram showing the overlap between AMP genes (d) upregulated or (e) downregulated in C. tropicalis, S. cerevisiae, and B. bassiana relative to the control. (f) Categorization of upregulated and downregulated genes into different AMP classes: defensin, lysozyme, cecropin, and attacin.
Fig. 3
Fig. 3
Fungal effect on AMP mRNA expression and protein levels across different AMP classes. (a) Heatmap and one-dimensional (column) hierarchical clustering based on the mRNA expression of all identified AMP genes across different fungal treatments: B. bassiana, S. cerevisiae, C. tropicalis, and a control group (no fungi added). The average expression levels (log2 FPKM) from four biological replicates are displayed as colors ranging from red (low expression) to blue (high expression) as indicated in the color key. Genes are ordered by AMP class: cecropin, defensin, lysozyme, and attacin. Genes that are significantly differentially expressed (FDR < 0.1) are marked with asterisks, with the specific treatment showing the difference indicated next to the gene. Treatments are abbreviated as follows: B. bassiana (B.b), S. cerevisiae (S.c), C. tropicalis (C.t), and control (con). A blue upward arrow denotes upregulated genes, while a red downward arrow denotes downregulated genes. (b) Heatmap and one-dimensional (column) hierarchical clustering based on the protein quantification of all identified AMP protein groups across different fungal treatments: B. bassiana, S. cerevisiae, C. tropicalis, and a control group (no fungi added). The average quantification levels (log2 normalized LFQ) from four biological replicates are displayed as colors ranging from red (low abundance) to blue (high abundance) as indicated in the color key. Protein groups are ordered by AMP class: attacin, cecropin, defensin and lysozyme. Protein groups that changed significantly relative to the control (ANOVA adjusted P-value < 0.1) are marked with asterisks, with the specific treatment showing the change indicated next to the protein. Treatments are abbreviated as follows: B. bassiana (B.b), S. cerevisiae (S.c), C. tropicalis (C.t), and control (con). A blue upward arrow denotes increased quantification, while a red downward arrow denotes decreased quantification.

Similar articles

Cited by

References

    1. Moretta, A. et al. Antimicrobial peptides: A new hope in biomedical and pharmaceutical Fields. Front. Cell. Infect. Microbiol.1110.3389/fcimb.2021.668632 (2021). - PMC - PubMed
    1. Hancock, R. E. W. & Sahl, H. G. Antimicrobial and host-defense peptides as new anti-infective therapeutic strategies. Nat. Biotechnol.21, 1551–1557. 10.1038/nbt1267 (2006). - PubMed
    1. Huan, Y., Kong, Q., Mou, H. & Yi, H. Antimicrobial peptides: Classification, design, application and research progress in multiple fields. Front. Microbiol.11, 1–21 10.3389/fmicb.2020.582779 (2020). - PMC - PubMed
    1. Zasloff, M. Antimicrobial peptides of multicellular organisms. Nature415, 389–395. 10.1038/415389a (2002). - PubMed
    1. Hancock, R. E. W. & Lehrer, R. Cationic peptides: A new source of antibiotics. Trends in Biotechnol.16, 82–88. 10.1016/S0167-7799(97)01156-6 (1998). - PubMed

MeSH terms