

Abnormal topological structure of structural covariance networks based on fractal dimension in noise induced hearing loss
- PMID: 39609512
- PMCID: PMC11605099
- DOI: 10.1038/s41598-024-80731-5
Abnormal topological structure of structural covariance networks based on fractal dimension in noise induced hearing loss
Abstract
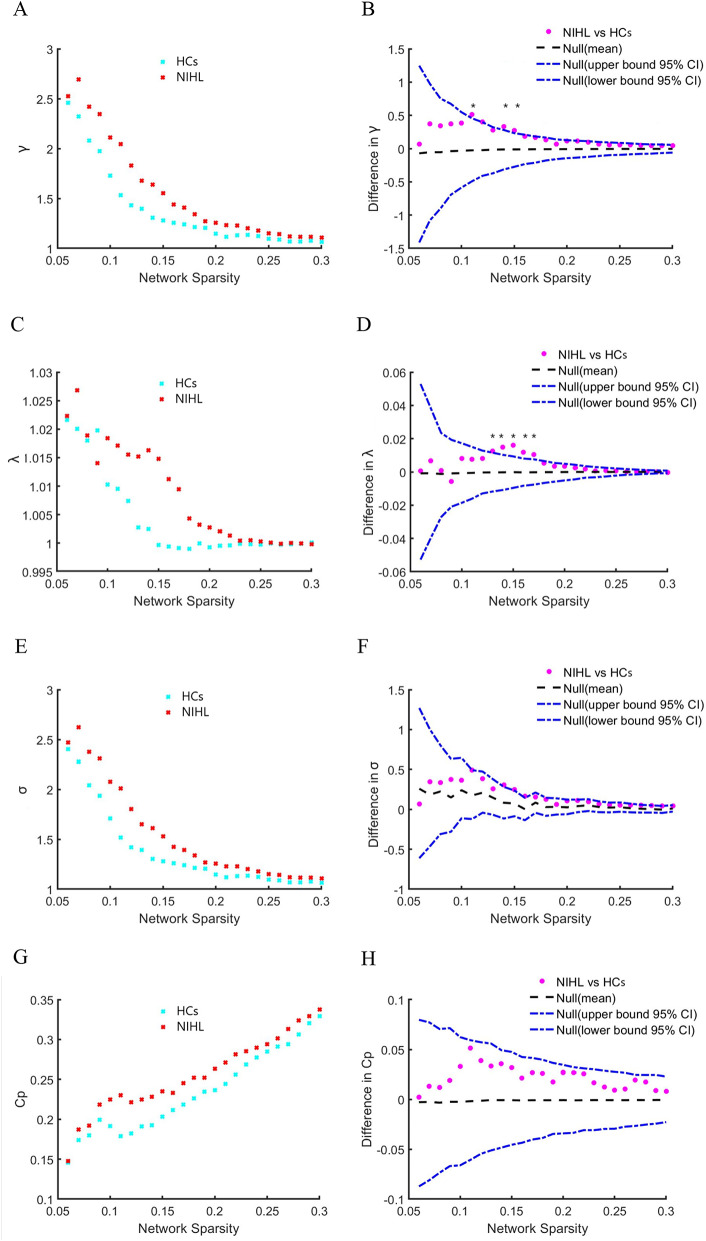
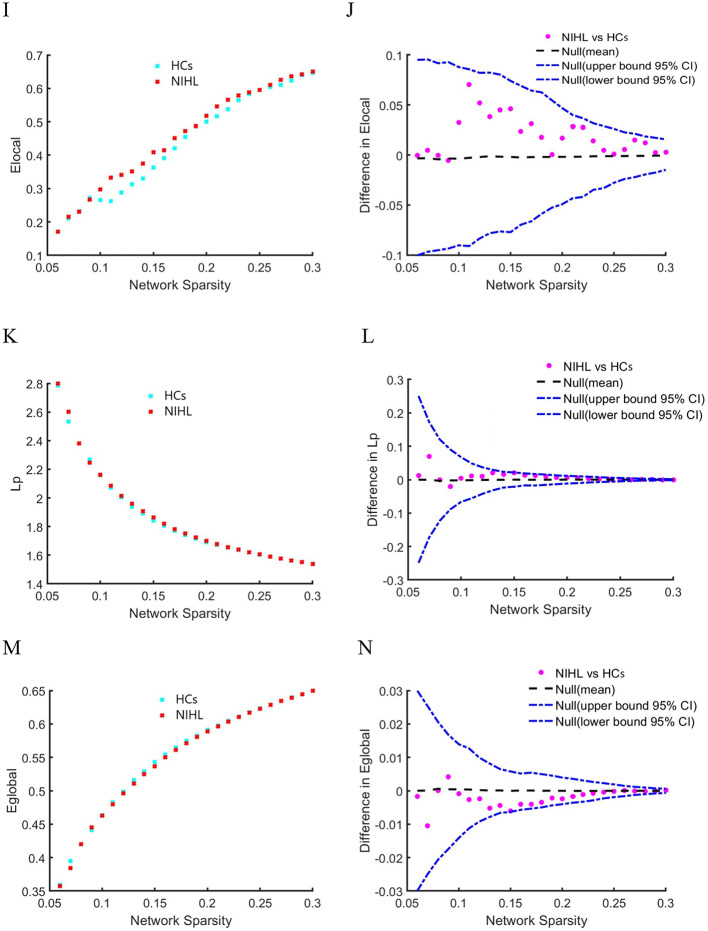
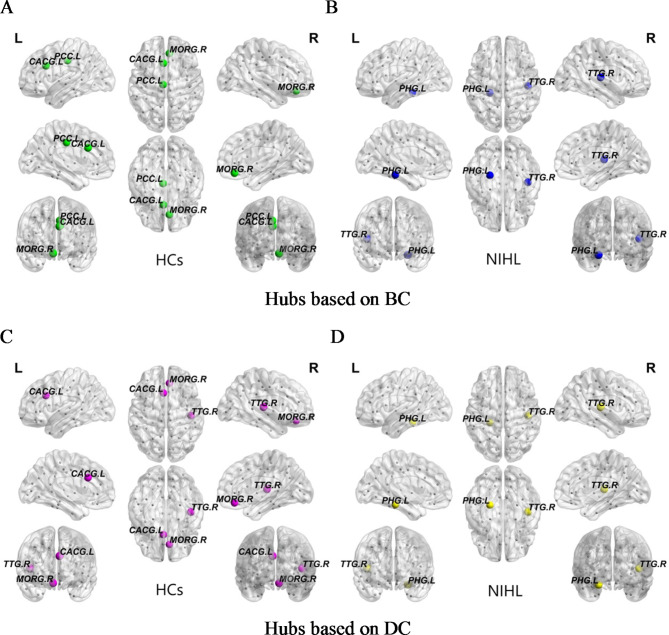
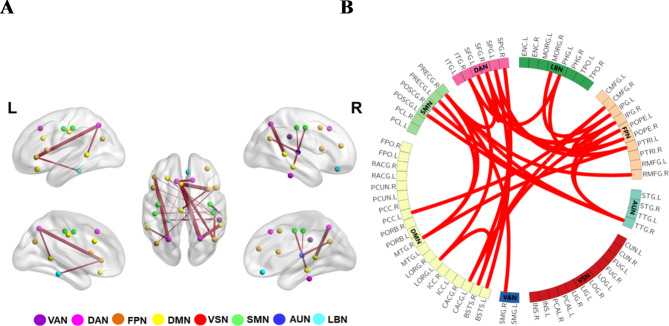
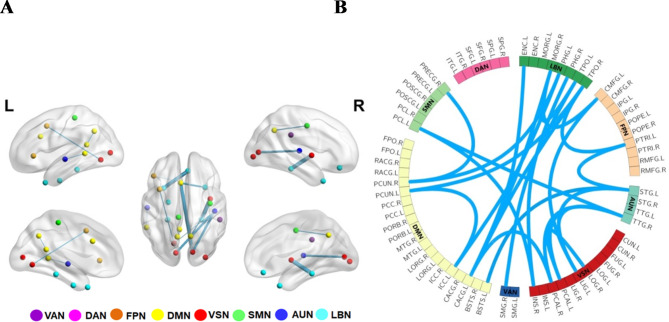
The topological attributes of structural covariance networks (SCNs) based on fractal dimension (FD) and changes in brain network connectivity were investigated using graph theory and network-based statistics (NBS) in patients with noise-induced hearing loss (NIHL). High-resolution 3D T1 images of 40 patients with NIHL and 38 healthy controls (HCs) were analyzed. FD-based Pearson correlation coefficients were calculated and converted to Fisher's Z to construct the SCNs. Topological attributes and network hubs were calculated using the graph theory. Topological measures between groups were compared using nonparametric permutation tests. Abnormal connection networks were identified using NBS analysis. The NIHL group showed a significantly increased normalized clustering coefficient, normalized characteristic path length, and decreased nodal efficiency of the right medial orbitofrontal gyrus. Additionally, the network hubs based on betweenness centrality and degree centrality were both the right transverse temporal gyrus and left parahippocampal gyrus in the NIHL group. The NBS analysis revealed two subnetworks with abnormal connections. The subnetwork with enhanced connections was mainly distributed in the default mode, frontoparietal, dorsal attention, and somatomotor networks, whereas the subnetwork with reduced connections was mainly distributed in the limbic, visual, default mode, and auditory networks. These findings demonstrate the abnormal topological structure of FD-based SCNs in patients with NIHL, which may contribute to understand the complex mechanisms of brain damage at the network level, providing a new theoretical basis for neuropathological mechanisms.
Keywords: Fractal dimension; Graph theory analysis; Network-based statistical analysis; Noise-induced hearing loss; Structural covariance network.
© 2024. The Author(s).
Conflict of interest statement
Declarations. Competing interests: The authors declare no competing interests. Ethical statement: The study protocol was approved by the Hospital Ethics Committee (Yanshanlun 2023014). Written informed consent was obtained from each subject. All methods were performed in accordance with the relevant guidelines and regulations.
Figures
Similar articles
-
Altered gray matter structural covariance networks in postpartum depression: a graph theoretical analysis.J Affect Disord. 2021 Oct 1;293:159-167. doi: 10.1016/j.jad.2021.05.018. Epub 2021 Jun 12. J Affect Disord. 2021. PMID: 34192630
-
The Default Mode Network and Visual Network Functional Connectivity Changes in Noise-Induced Hearing Loss Patients: A Resting-State fMRI Study.Brain Behav. 2025 Apr;15(4):e70465. doi: 10.1002/brb3.70465. Brain Behav. 2025. PMID: 40170553 Free PMC article.
-
Altered cortical thickness and structural covariance networks in chronic low back pain.Brain Res Bull. 2024 Jun 15;212:110968. doi: 10.1016/j.brainresbull.2024.110968. Epub 2024 Apr 27. Brain Res Bull. 2024. PMID: 38679110
-
Network integration and segregation changes in schizophrenia: impact of electroconvulsive therapy.BMC Psychiatry. 2024 Nov 30;24(1):862. doi: 10.1186/s12888-024-06331-9. BMC Psychiatry. 2024. PMID: 39616308 Free PMC article.
-
Neural correlates of anhedonia in young adults with subthreshold depression: A graph theory approach for cortical-subcortical structural covariance.J Affect Disord. 2024 Dec 1;366:234-243. doi: 10.1016/j.jad.2024.08.192. Epub 2024 Aug 30. J Affect Disord. 2024. PMID: 39216643
Cited by
-
Disrupted Cross-Scale Network Associated With Cognitive-Emotional Disorders in Sudden Sensorineural Hearing Loss.CNS Neurosci Ther. 2025 Jan;31(1):e70234. doi: 10.1111/cns.70234. CNS Neurosci Ther. 2025. PMID: 39868748 Free PMC article.
References
-
- Ding, T., Yan, A. & Liu, K. What is noise-induced hearing loss? Br. J. Hosp. Med.80 (9), 525–529. 10.12968/hmed.2019.80.9.525 (2019). - PubMed
-
- Basner, M. Auditory and non-auditory effects of noise on health: an ICBEN perspective. J. Acoust. Soc. Am.137 (4), 2246–2246. 10.1121/1.4920192 (2015).
MeSH terms
LinkOut - more resources
Full Text Sources
Research Materials
Miscellaneous
