. 2024 Nov 28;14(1):29609.
doi: 10.1038/s41598-024-80636-3.

Adjuvants to the S1-subunit of the SARS-CoV-2 spike protein vaccine improve antibody and T cell responses and surrogate neutralization in mice

Affiliations

Adjuvants to the S1-subunit of the SARS-CoV-2 spike protein vaccine improve antibody and T cell responses and surrogate neutralization in mice

William Becker et al. Sci Rep. .

Abstract

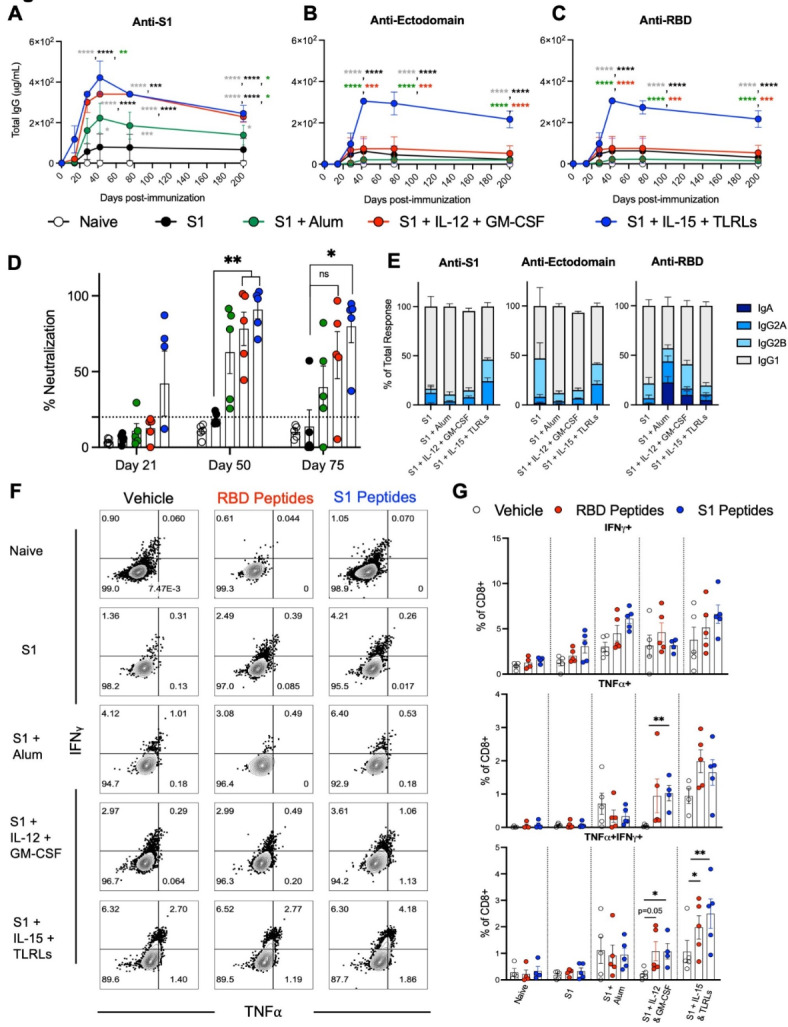
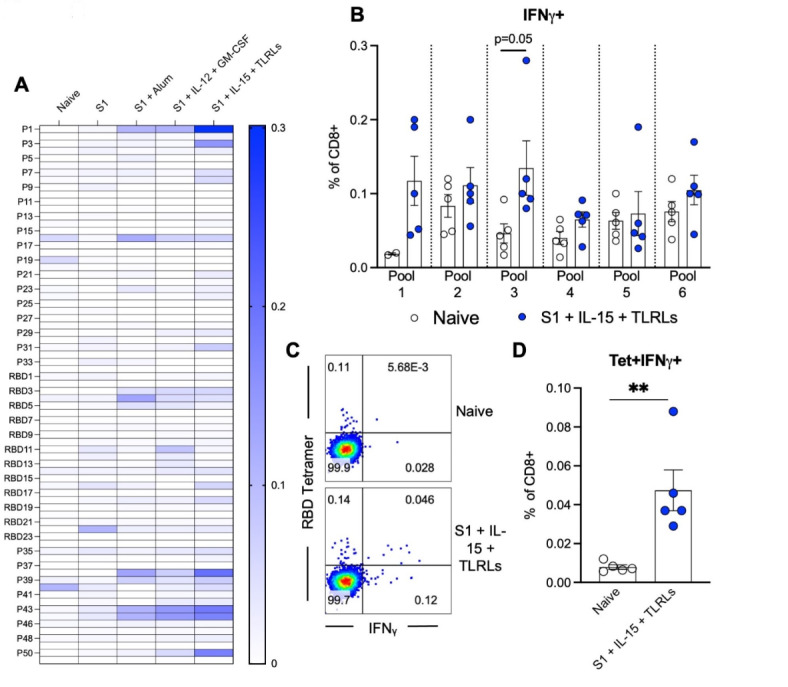
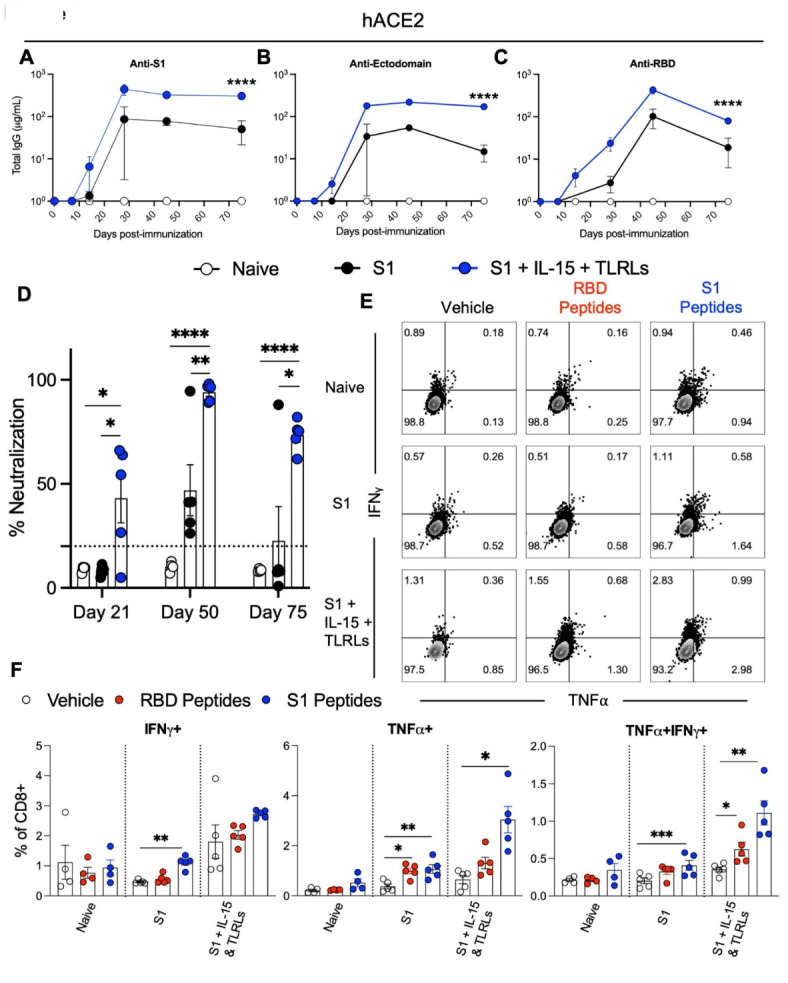
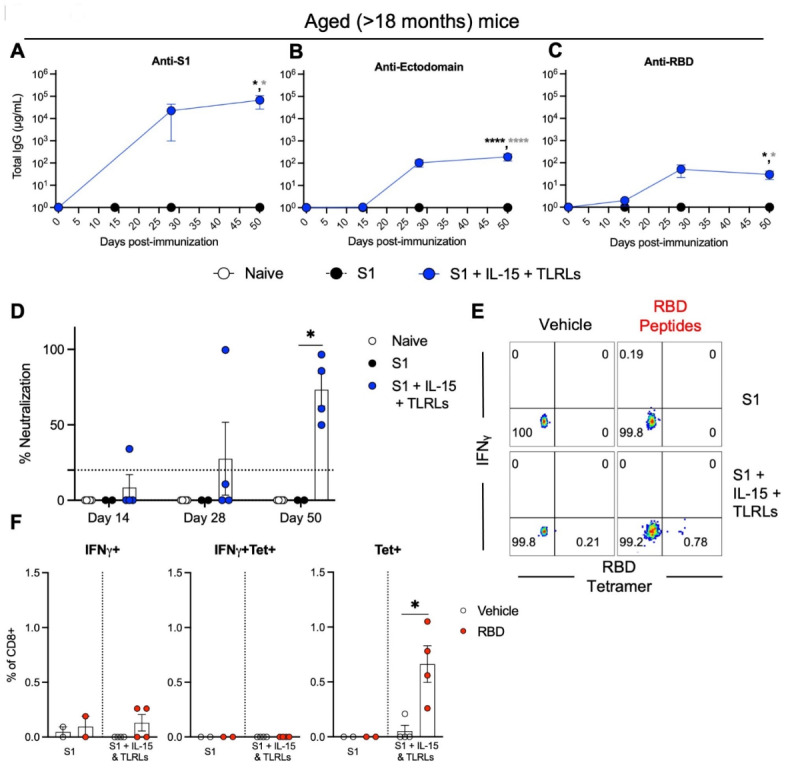
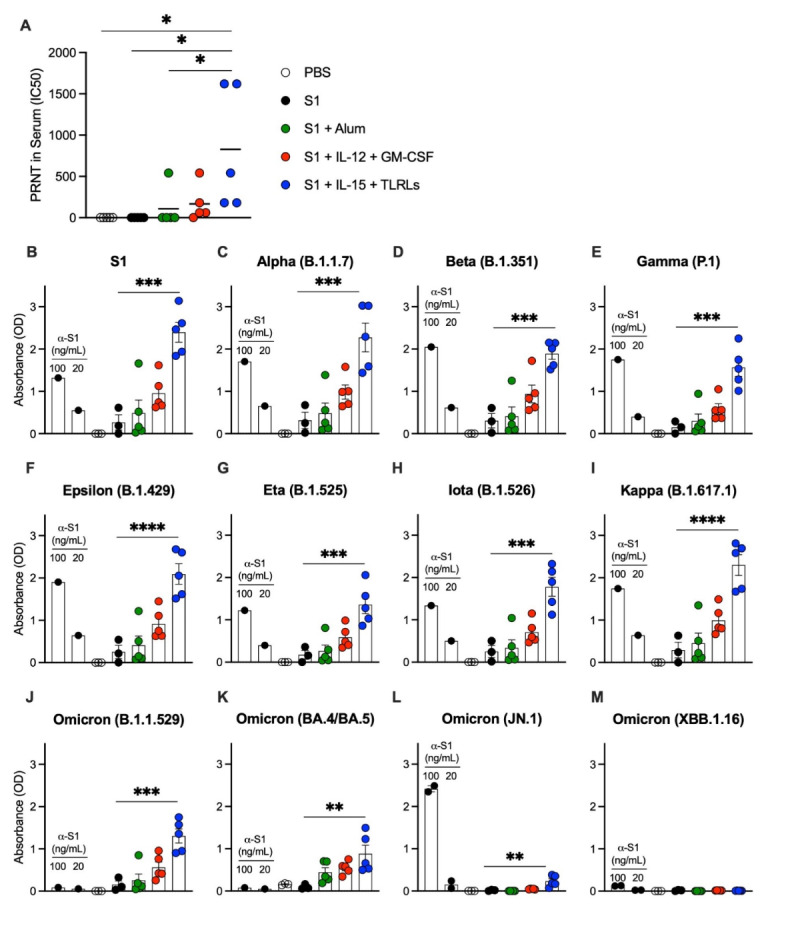
Various public health measures have contained outbreaks of SARS-CoV-2, but concerns remain over the possibility of future surges. Improvements in broadening the vaccine response can stifle new and nascent infections. In this study, we tested the effects of different adjuvant combinations on the immunization of mice with the receptor-binding domain (RBD)-containing the S1-subunit of the spike protein (S1 protein) from SARS-CoV-2 to induce a robust humoral and cellular immune response. We showed that subcutaneous immunization of S1 protein co-delivered with IL-15 and TLR-ligands (MALP-2, poly I: C, and CpG) or with IL-12 and GM-CSF in DOTAP, or Alum induced significantly high titers of durable antibodies, predominantly IgG1, IgG2a, and IgG2b, that could bind to RBD, S1-subunit, and the full-length ectodomain of SARS-CoV-2 spike protein in sera compared to the immunization with S1 protein alone in both B6 wild-type (WT) and the K18-hACE2 transgenic mice. In addition, immunization with S1 protein co-delivered with IL-15 and TLR-ligands induced antibody responses against S1 protein in aged mice, and sera from younger mice reduced plaque formation of live SARS-CoV-2, and had effective binding to S1 protein from ten different variants of SARS-CoV-2, including Omicron (B.1.1.529), and greater neutralization activity as early as day 21 post-immunization measured by inhibition of RBD binding to hACE2 than sera from mice immunized with S1 protein alone or co-delivered with Alum. We also identified antibody-binding epitopes using 18-mer peptides with 9-residue overlaps from the S1 protein. CD8+ T-cell responses specific to RBD and S1 protein peptide pools were observed up to day 200 post-immunization by tetramer staining. These data show the efficacy of specific immunologically targeted adjuvants for increasing S1 protein immunogenicity in mice and can contribute to more effective vaccines.

Keywords: Adjuvants; Aging; SARS-CoV-2; Vaccine; Variants.


Conflict of interest statement

Declarations. Competing interests: The authors declare no competing interests.

Figures

Fig. 1
Fig. 1
Cytokine and TLR-ligand adjuvant combination enhances the humoral and T cell immune response of S1 protein immunization. Immunization schedule: B6 (WT) mice were immunized with priming on day 0 and two booster doses, at two-week intervals. Mice were immunized with S1 protein alone (black) or co-delivered with Alum (green), IL-12 and GM-CSF (red), or IL-15 and TLR-Ls (blue) in DOTAP. Serum samples were collected at days 14, 28, 42, 75, and 200 post-immunization. Spleen cells were collected at day 200 post-immunization. Humoral immune responses were assessed following immunization by analysis of total serum IgG responses to (A) S1, (B) ectodomain, or (C) RBD of SARS-CoV-2 spike protein over time evaluated by ELISA. (D) Serum antibody neutralization potencies at days 21, 50, and 75 are presented as SNI% in 1:30 dilutions of sera against RBD-hACE2 binding. The dashed horizontal line corresponds to the lower limit of detection (LLOD = 20%) of the assay used. The data are represented as the mean ± SEM and represent at least two independent experiments. p values are shown for entirety of study using one (D) or two-way ANOVA (A-C) test with post hoc Tukey’s multiple comparisons; *, p < 0.05; **, p < 0.01; ***, p < 0.001; ****, p < 0.0001. (E) Day 45 post-immunization serum samples were subjected to ELISAs for S1, RBD, or ectodomain of spike protein reactivity and antibody isotypes were assessed and normalized to total antibody response. (F and G) Cellular immune responses were assessed at day 200 post-immunization by stimulating spleen cells ex vivo with either vehicle control or overlapping peptide pools comprising the RBD or S1 proteins, all peptides at 0.1 µg/ml, for 6 h and then assessed by flow cytometry for intracellular production of IFNγ and TNFα. (F) Representative flow cytometry contour plots and (G) graphed values of individual mice. *, p < 0.05; **, p < 0.01; ***, p < 0.001; ****, p < 0.0001 determined using a paired two-tailed Student’s t-test.
Fig. 2
Fig. 2
Enhancement of humoral and cellular response to S1 protein immunization by adjuvants is specific. B6 (WT) mice were immunized with priming on day 0 and two booster doses, each at two-week intervals. Mice were immunized with S1 protein alone, or co-delivered with Alum, IL-12 and GM-CSF, or IL-15 and TLR-Ls in DOTAP. Serum samples were collected at day 45 post-immunization and subjected to ELISAs for individual peptides from S1 and RBD proteins, with responses shown as a heat map (A). Spleen cells collected at day 200 post-immunization were stimulated ex vivo with pooled groups of peptides from S1 and RBD proteins for 6 h before staining for intracellular production of IFNγ by total CD8+ T cells (B) was assessed. (C) Representative flow cytometry dot plot of RBD-tetramer+ and IFNγ+ CD8+ T cells deriving from spleens of naïve mice or mice immunized with S1 protein co-delivered with IL-15 and TLR-Ls and ex vivo exposed to pool 3 for 6 h. (D) Graphed individual values. The data are represented as the mean ± SEM and represent 2 independent experiments. *, p < 0.05; **, p < 0.01; ***, p < 0.001; ****, p < 0.0001 determined using an unpaired two-tailed Student’s t-test.
Fig. 3
Fig. 3
Immune response to adjuvanted S1 protein vaccine in hACE2 mice. K18-hACE2 [B6.Cg-Tg(K18-ACE2)2Prlmn/J] transgenic mice were immunized with S1 protein alone or S1 protein co-delivered with IL-15 and TLRLs. Serum samples were collected at days 14, 28, 45, and 75 post-immunization, and spleen cells were collected at day 200 post-immunization. Humoral immune responses were assessed following immunization by analysis of total serum IgG responses to (A) S1, (B) ectodomain, or (C) RBD of SARS-CoV-2 spike protein over time evaluated by ELISA. (D) Serum antibody neutralization potencies at days 21, 50, and 75 are presented as SNI% in 1:30 dilutions of sera against RBD-hACE2 binding. The dashed horizontal line corresponds to the lower limit of detection (LLOD = 20%) of the assay used. The data are represented as the mean ± SEM and represent at least two independent experiments. p values are shown for entirety of study using one (D) or two-way ANOVA (A-C) test with post hoc Tukey’s multiple comparisons; *, p < 0.05; **, p < 0.01; ***, p < 0.001; ****, p < 0.0001. Cellular immune responses were assessed at day 75 post-immunization by stimulating spleen cells ex vivo with either vehicle control or overlapping peptide pools comprising the RBD or S1 proteins, all peptides at 0.1 µg/ml, for 6 h and then assessed by flow cytometry for intracellular production of IFNγ and TNFα in CD8+ T cells. (E) Representative flow cytometry contour plots and (F) graphed values of individual mice. *, p < 0.05; **, p < 0.01; ***, p < 0.001; ****, p < 0.0001 determined using a paired two-tailed Student’s t-test.
Fig. 4
Fig. 4
Adjuvanted S1 protein vaccine efficacy in aged mice. Aged (> 18 months old) B6 (WT) mice were immunized with S1 protein alone or S1 protein co-delivered IL-15 with TLR-Ls. Humoral immune responses were assessed following immunization by analysis of total serum IgG responses to (A) S1, (B) ectodomain, or (C) RBD of SARS-CoV-2 spike protein over time evaluated by ELISA. (D) Serum antibody neutralization potencies at days 14, 28, and 50 are presented as SNI% in 1:30 dilutions of sera against RBD-hACE2 binding. The dashed horizontal line corresponds to the lower limit of detection (LLOD = 20%) of the assay used. The data are represented as the mean ± SEM and represent at least two independent experiments. p values are shown for entirety of study using one (D) or two-way ANOVA (A-C) test with post hoc Tukey’s multiple comparisons; *, p < 0.05; **, p < 0.01; ***, p < 0.001; ****, p < 0.0001. Cellular immune responses were assessed at day 75 post-immunization by stimulating spleen cells ex vivo with either vehicle control or overlapping peptide pools comprising the RBD protein at 0.1 µg/ml of all peptides for 6 h and then assessed by flow cytometry for RBD-tetramer+ CD8+ T cells and intracellular production of IFNγ in CD8+ T cells. (E) Representative flow cytometry contour plots and (F) graphed values of individual mice. *, p < 0.05; **, p < 0.01; ***, p < 0.001; ****, p < 0.0001 determined using a paired two-tailed Student’s t-test.
Fig. 5
Fig. 5
Immunization of S1 protein co-delivery of IL-15 with TLR-Ls provides the best humoral protection against live SARS-CoV-2 virus and variants of concern. B6 (WT) mice were immunized with S1 protein alone (black) or co-delivered with Alum (green), IL-12 and GM-CSF (red), or IL-15 and TLR-Ls (blue) in DOTAP. Serum samples from day 60 post-immunization were incubated with 30 PFU of SARS-CoV-2 for 1 h at 37 °C; serial dilutions of virus-serum mixtures were added onto Vero E6 cell monolayers and plates were fixed and stained after 3 days of culture. (A) PRNT (Plaque Reduction Neutralization Test) antibody titer ID50 was defined as the highest serum dilution resulting in 50% reduction of plaques. Serum samples from day 60 post-immunization and anti-S1 positive control antibodies were subjected to ELISAs (read as absorbance) for reactivity against SARS-CoV-2 variants, including WT (Wuhan) and variants of concern (B-M). The data are represented as the mean ± SEM and represent one (A) or two (B-M) independent experiments. p values are shown for entirety of study using one-way ANOVA test with post hoc Tukey’s multiple comparisons; *, p < 0.05; **, p < 0.01; ***, p < 0.001; ****, p < 0.0001.

Similar articles

Cited by

References

    1. Hall, V. et al. Protection against SARS-CoV-2 after Covid-19 vaccination and previous infection. N Engl. J. Med.386(13), 1207–1220. 10.1056/NEJMoa2118691 (2022). - PMC - PubMed
    1. Shang, J. et al. Structural basis of receptor recognition by SARS-CoV-2. Nature581, 221–224. 10.1038/s41586-020-2179-y (2020). - PMC - PubMed
    1. Yan, R. et al. Structural basis for the recognition of SARS-CoV-2 by full-length human ACE2. Science367(6485), 1444–1448. 10.1126/science.abb2762 (2020). - PMC - PubMed
    1. Barnes, C. O. et al. SARS-CoV-2 neutralizing antibody structures inform therapeutic strategies. Nature588, 682–687. 10.1038/s41586-020-2852-1 (2020). - PMC - PubMed
    1. Ssentongo P. et al. SARS-CoV-2 vaccine effectiveness against infection, symptomatic and severe COVID-19: a systematic review and meta-analysis. BMC Infect. Dis.22(1), 439. 10.1186/s12879-022-07418-y (2022). Published 2022 May 7. - PMC - PubMed

MeSH terms