

Semi automatic quantification of REM sleep without atonia in natural sleep environment
- PMID: 39609533
- PMCID: PMC11605064
- DOI: 10.1038/s41746-024-01354-8
Semi automatic quantification of REM sleep without atonia in natural sleep environment
Abstract
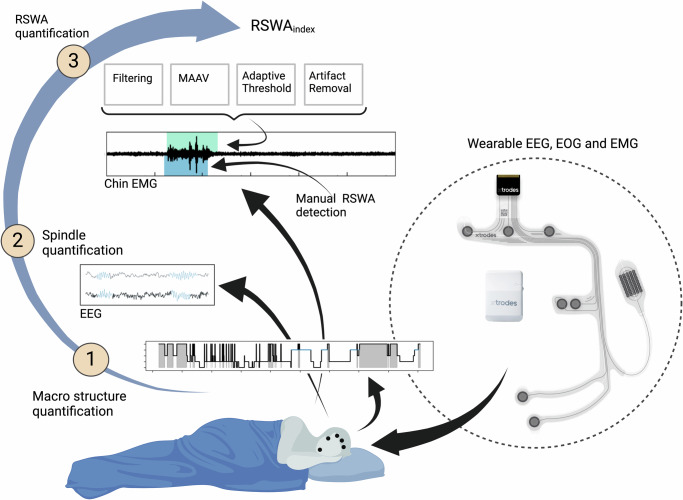
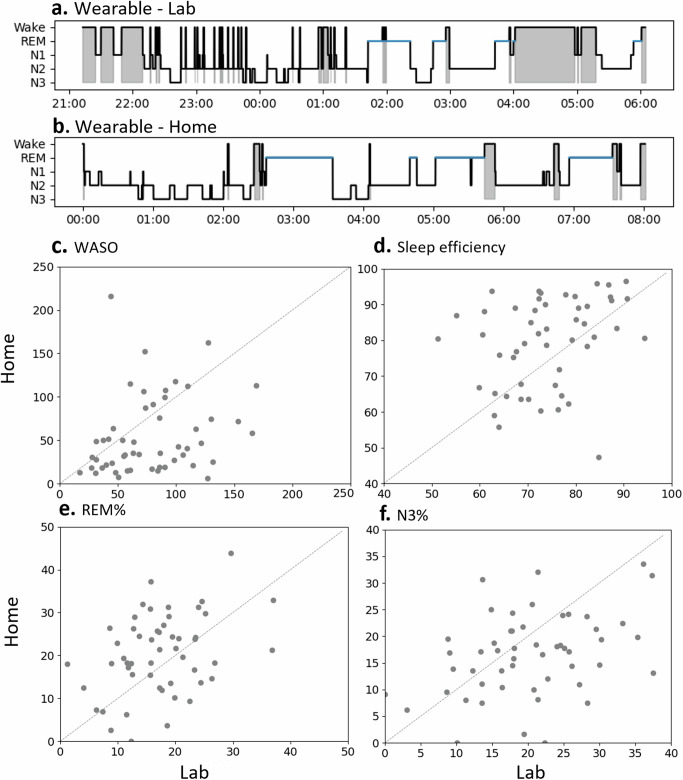
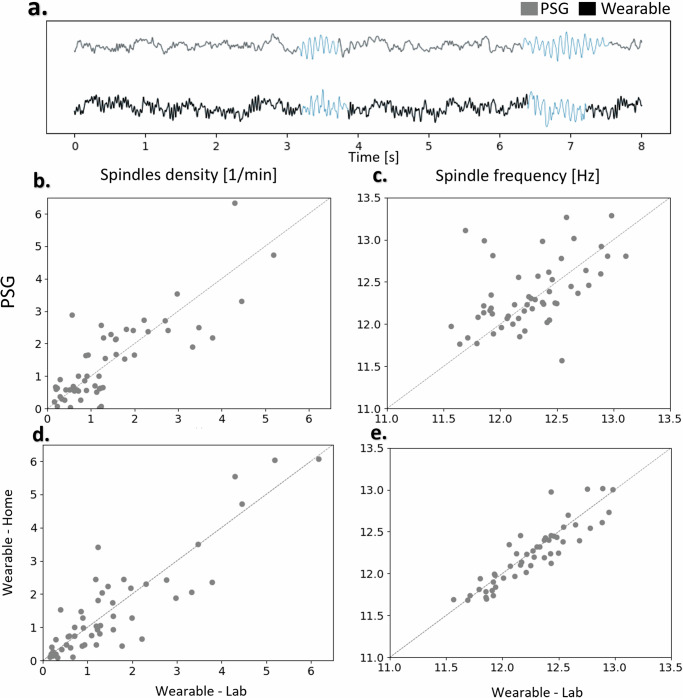
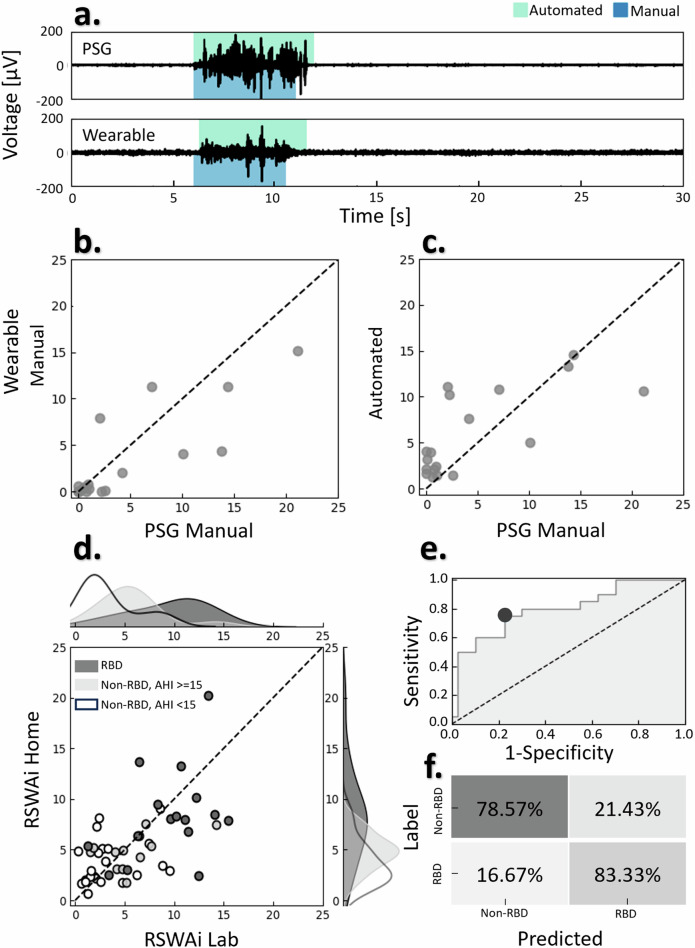
Polysomnography, the gold standard diagnostic tool in sleep medicine, is performed in an artificial environment. This might alter sleep and may not accurately reflect typical sleep patterns. While macro-structures are sensitive to environmental effects, micro-structures remain more stable. In this study we applied semi-automated algorithms to capture REM sleep without atonia (RSWA) and sleep spindles, comparing lab and home measurements. We analyzed 107 full-night recordings from 55 subjects: 24 healthy adults, 28 Parkinson's disease patients (15 RBD), and three with isolated Rem sleep behavior disorder (RBD). Sessions were manually scored. An automatic algorithm for quantifying RSWA was developed and tested against manual scoring. RSWAi showed a 60% correlation between home and lab. RBD detection achieved 83% sensitivity, 79% specificity, and 81% balanced accuracy. The algorithm accurately quantified RSWA, enabling the detection of RBD patients. These findings could facilitate more accessible sleep testing, and provide a possible alternative for screening RBD.
© 2024. The Author(s).
Conflict of interest statement
Competing interests: D.P., S.O., A.G., and Y.H. declare a financial interest in X-trodes Ltd, which developed the screen-printed electrode technology used in this paper. These authors have no other relevant financial involvement with any organization or entity with a financial interest in or financial conflict with the subject matter or materials discussed in the manuscript apart from those disclosed.
Figures
References
-
- Berry, R.B., G. C. H. S. L. R. M. C., Brooks, R. & BV, V. The AASM Manual for the Scoring of Sleep and Associated Events: Rules, Ter (American Academy of Sleep Medicine, Chichester, 2020), 2.6 edn.
-
- Riedel, B. W., Winfield, C. F. & Lichstein, K. L. First night effect and reverse first night effect in older adults with primary insomnia: does anxiety play a role? Sleep. Med.2, 125–133 (2001). - PubMed
Grants and funding
- 1355/17/Israel Science Foundation (ISF)
- OuterRetina/EC | EU Framework Programme for Research and Innovation H2020 | H2020 Priority Excellent Science | H2020 European Research Council (H2020 Excellent Science - European Research Council)
- W81XWH2010468./U.S. Department of Defense (United States Department of Defense)
LinkOut - more resources
Full Text Sources
Miscellaneous
