

The genetic origins of species boundaries at subtropical and temperate ecoregions in the North American racers (Coluber constrictor)
- PMID: 39609543
- PMCID: PMC11799203
- DOI: 10.1038/s41437-024-00737-7
The genetic origins of species boundaries at subtropical and temperate ecoregions in the North American racers (Coluber constrictor)
Abstract
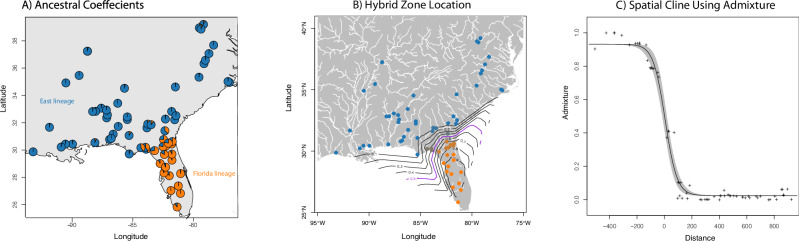
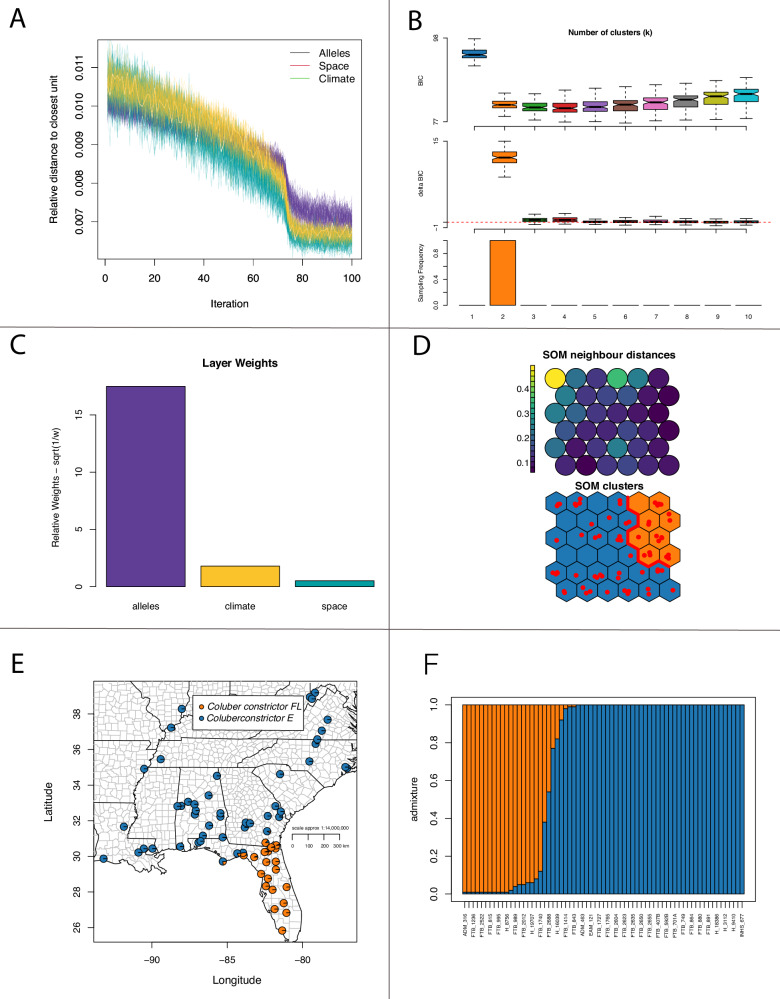
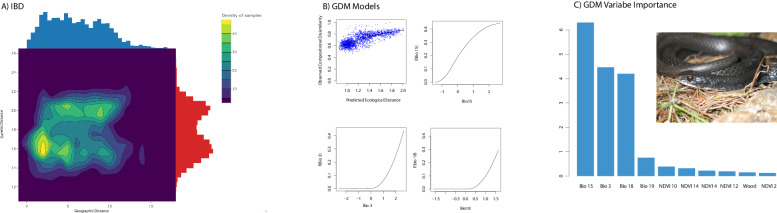
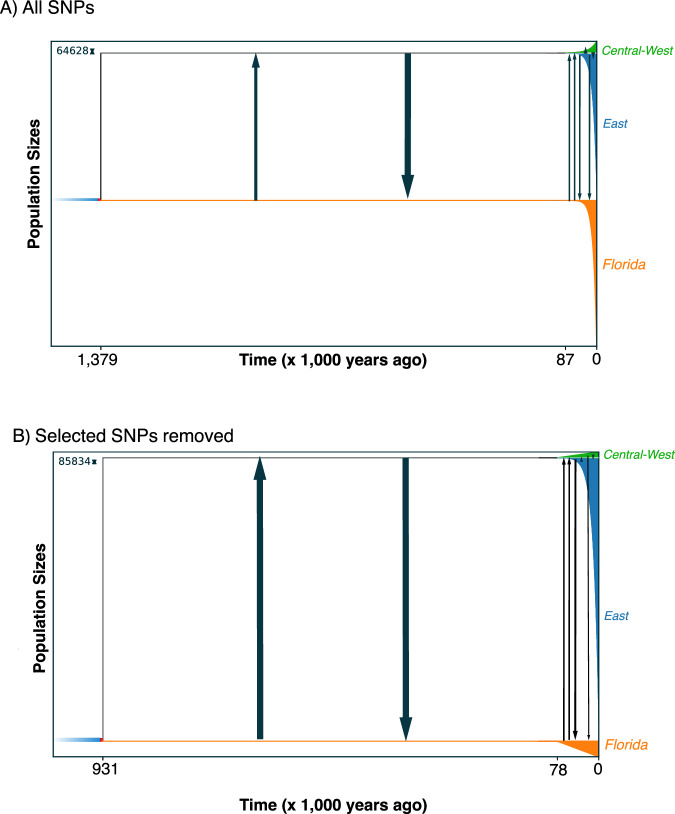
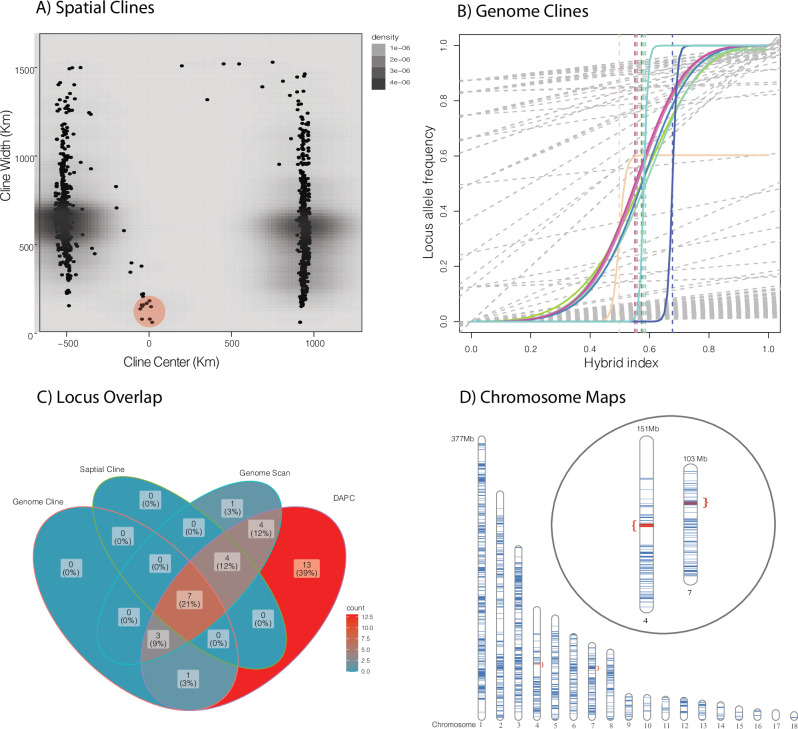
Phylogeographically structured lineages are a common outcome of range-wide population genetic studies. In the southeastern United States, disconnection between populations found at the intersection of the southeastern coastal plains of peninsular Florida and the southeastern plains of the adjacent continent is readily apparent among many plants and animals. However, the timing and maintenance of species boundaries between these distinctly different subtropical and temperate regions remains unknown for all organisms studied there. Using genome-scale data, we examine the timing of origins, gene flow, and the movement of genes under selection in unique ecoregions within the North American racers (Coluber constrictor). Isolation-migration models along with tests of genome-wide selection, locus-environment associations, and spatial and genomic clines demonstrate that two unrecognized species are present and are in contact at the boundary of these two ecoregions. We show that selection at several loci associated with unique environments have maintained species boundaries despite constant levels of gene flow between these lineages over thousands of generations. This research provides a new avenue of research to examine speciation processes in poorly studied biodiversity hotspots.
© 2024. The Author(s).
Conflict of interest statement
Competing interests: The authors declare no competing interests. Research Ethics Statement: No approval of research ethics committees was required to accomplish the goals of this study because it was conducted on previously sequenced genomic data from Myers et al. (2024) and available at NCBI/GenBank.
Figures
Similar articles
-
Phylogeny and biogeography of the American live oaks (Quercus subsection Virentes): a genomic and population genetics approach.Mol Ecol. 2015 Jul;24(14):3668-87. doi: 10.1111/mec.13269. Epub 2015 Jul 14. Mol Ecol. 2015. PMID: 26095958
-
Phylogeography of Ramalina menziesii, a widely distributed lichen-forming fungus in western North America.Mol Ecol. 2014 May;23(9):2326-39. doi: 10.1111/mec.12735. Mol Ecol. 2014. PMID: 24673777
-
Phylogeography across a continent: the evolutionary and demographic history of the North American racer (Serpentes: Colubridae: Coluber constrictor).Mol Phylogenet Evol. 2008 Apr;47(1):274-88. doi: 10.1016/j.ympev.2007.10.020. Epub 2007 Nov 9. Mol Phylogenet Evol. 2008. PMID: 18093846
-
Plant molecular phylogeography in China and adjacent regions: Tracing the genetic imprints of Quaternary climate and environmental change in the world's most diverse temperate flora.Mol Phylogenet Evol. 2011 Apr;59(1):225-44. doi: 10.1016/j.ympev.2011.01.012. Epub 2011 Feb 1. Mol Phylogenet Evol. 2011. PMID: 21292014 Review.
-
Divergence hitchhiking and the spread of genomic isolation during ecological speciation-with-gene-flow.Philos Trans R Soc Lond B Biol Sci. 2012 Feb 5;367(1587):451-60. doi: 10.1098/rstb.2011.0260. Philos Trans R Soc Lond B Biol Sci. 2012. PMID: 22201174 Free PMC article. Review.
References
-
- Akima H, Gebhard A, Petzoldt T, Maechler M (2016). Interpolation of irregularly and regularly spaced data [R package akima version 0.6-2.1].
-
- Altschul SF, Gish W, Miller W, Myers EW, Lipman DJ (1990) Basic local alignment search tool. J Mol Biol 215:403–410 - PubMed
-
- Avise JC (2000) Phylogeography: The History and Formation of Species. Harvard University Press, Cambridge, Mass
-
- Bailey RG (1995) Description of the ecoregions of the United States, 2nd edn. USDA Forest Service, Washington DC
-
- Bailey R (2024) Bayesian hybrid index and genomic cline estimation with the R package gghybrid. Mol Ecol Resour 24(2):e13910 - PubMed
MeSH terms
Grants and funding
LinkOut - more resources
Full Text Sources
