

Review
doi: 10.1038/s41375-024-02480-8.
Epub 2024 Nov 28.
Spatial transcriptomic approaches for characterising the bone marrow landscape: pitfalls and potential
Affiliations
- PMID: 39609595
- PMCID: PMC11794127
- DOI: 10.1038/s41375-024-02480-8
Item in Clipboard
Review
Spatial transcriptomic approaches for characterising the bone marrow landscape: pitfalls and potential
Leukemia.
2025 Feb.
No abstract available
Conflict of interest statement
Competing interests: RAC provides consulting services to Ground Truth Labs Ltd. DJR provides consulting services to Ground Truth Labs Ltd. and Johnson & Johnson. Other authors declare no competing interests.
Figures
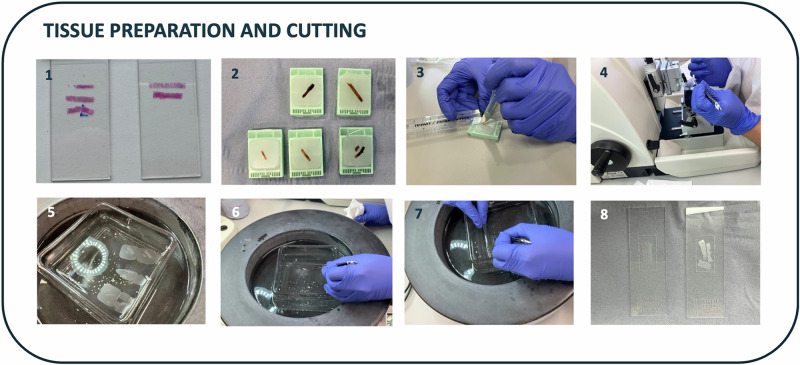
A stepwise approach for tissue preparation and sectioning for spatial transcriptomic (ST) analysis (FFPE sections of BMT tissue for 10x Xenium analysis). Prior to sectioning the environment should be cleaned with RNaseZap to ensure a RNase free environment. 1. Pathology review of a H&E-stained section. 2. Review FFPE tissue blocks to ensure macroscopic BMT tissue integrity. 3. Gently and very lightly score around the BMT region of interest with a scalpel, excluding areas not suitable for ST analysis e.g. thick cortical bone/haemorrhage. 4. Chill and rehydrate the FFPE block in an ice bath and then cut and discard the first few sections until a full-face of the BMT is seen and surface paraffin is removed. Cut a thin (see relevant protocol for thickness) section from the FFPE block with a microtome. 5. Immediately transfer the tissue section to surface of a warm (42°C or as per protocol) water bath using tweezers, careful to touch only the peripheral paraffin rather than tissue. Lie the section flat on the surface of the water and inspect the section for integrity and absence of folding. 6. Without touching the BMT tissue, remove the excess paraffin from the section with tweezers and discard. The light scoring in step three will facilitate removal of excess paraffin whilst preserving the BMT tissue. 7. Manoeuvre the BMT sections (on the surface of the water) onto the appropriate region of the ST slide. Placing the ST slide in the water bath under the tissue sections minimises the need to touch the tissue during this step. 8. Allow the tissue to dry on the slide as per protocol to be taken forward for further processing. Refer to the relevant user manual for further details including regarding water bath preparation, block chilling, drying temperature and timing.
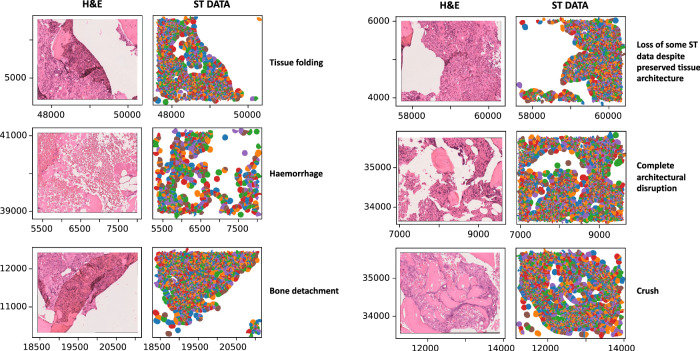
H&E images show areas of crush, haemorrhage, architectural disruption, tissue folding and bone detachment which are not readily identifiable on review of the spatial transcriptomic (ST) data output. The right column shows the ST data output (each coloured circle represents a cell) and left column the corresponding H&E image for the same region. x and y axes indicate spatial coordinates.
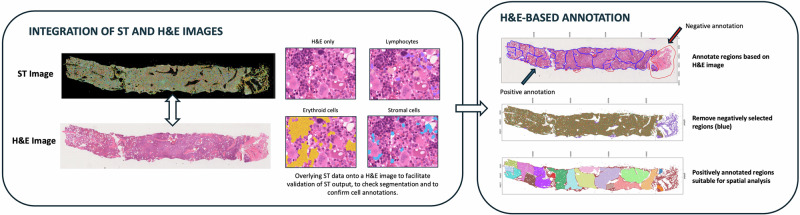
Left panel: Following generation of spatial transcriptomic (ST) data using the Xenium platform, H&E staining can be performed on the same section. The ST data can be integrated with the H&E image and be visualised overlying the H&E morphology. This step allows for confirmation of architectural preservation and cellular morphology, as well as visual confirmation of appropriate cellular segmentation. The panel shows H&E image of a BMT, with three distinct cell groups highlighted (purple, blue and yellow indicating lymphocytes, stromal and erythroid groups respectively, clockwise from top right). Right panel: H&E-based annotation. (Top and middle BMTs) Regions in which cell annotation is compromised (e.g. due to haemorrhage or crush) should be negatively annotated for removal from downstream analysis. Areas of architectural preservation are positively annotated for subsequent spatial analysis. (Bottom BMT) Each discrete positively annotated region (here representing an intertrabecular space) is indicated by a different colour.
References
-
- Yuan Z, Zhao F, Lin S, Zhao Y, Yao J, Cui Y, et al. Benchmarking spatial clustering methods with spatially resolved transcriptomics data. Nat Methods. 2024;21:712–22. - PubMed
Publication types
LinkOut - more resources
Full Text Sources
