. 2024 Nov 28;7(1):1587.
doi: 10.1038/s42003-024-07278-z.

Evolutionary genomics of Leishmania braziliensis across the neotropical realm

Affiliations

Evolutionary genomics of Leishmania braziliensis across the neotropical realm

Senne Heeren et al. Commun Biol. .

Abstract

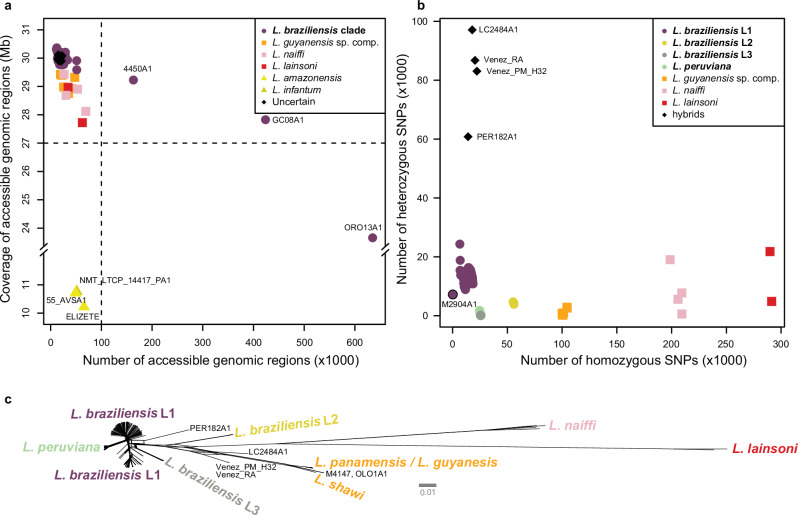
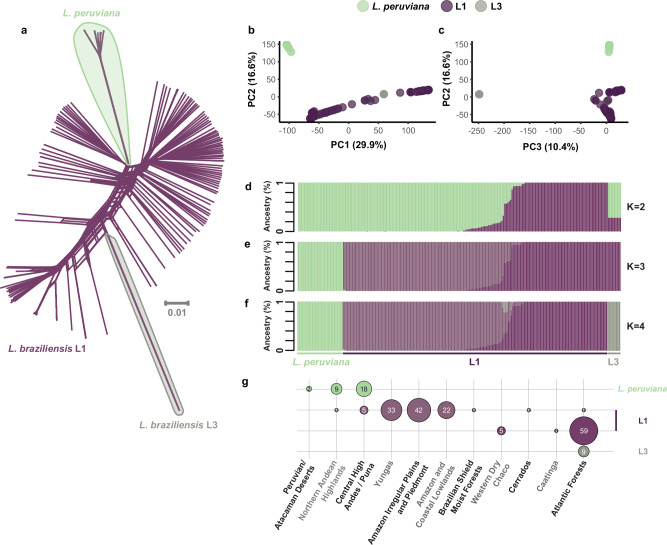
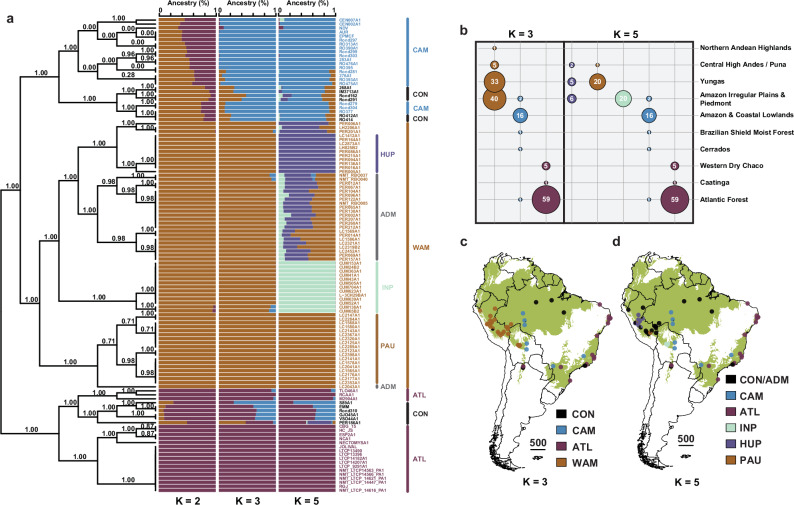
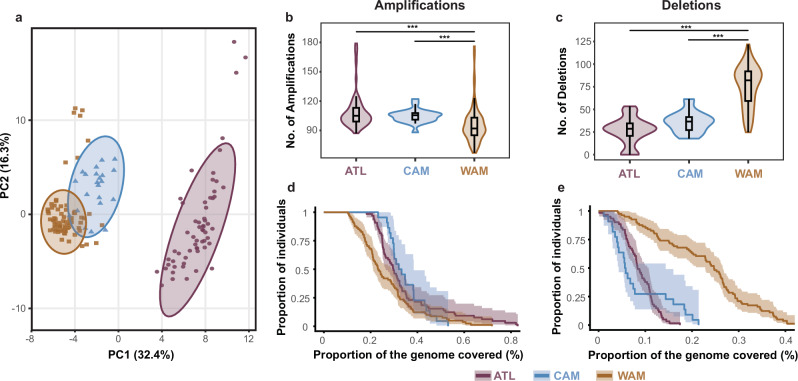
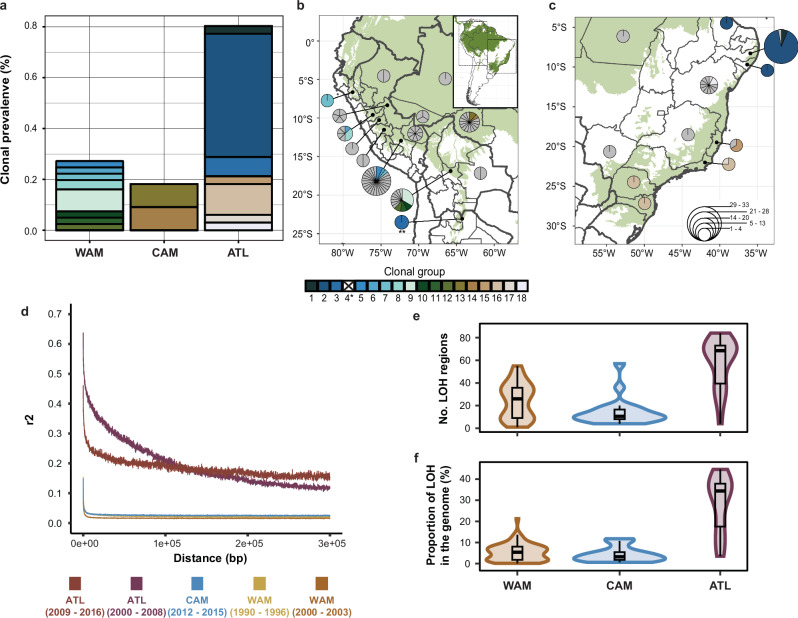
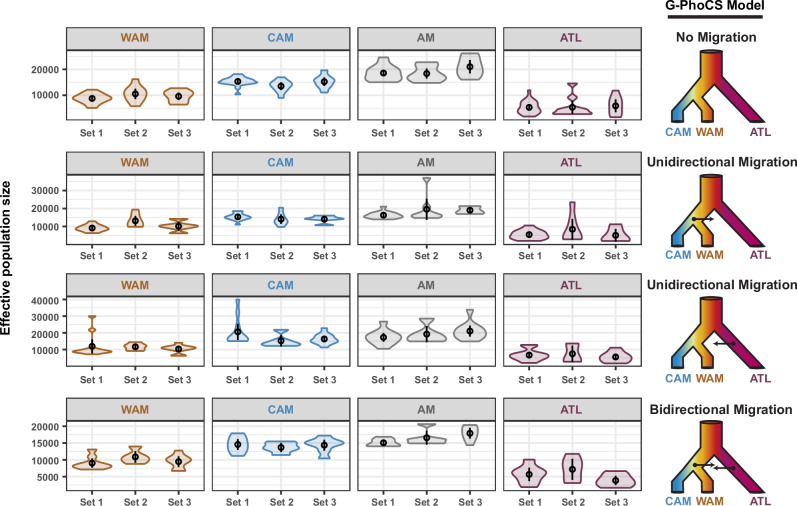
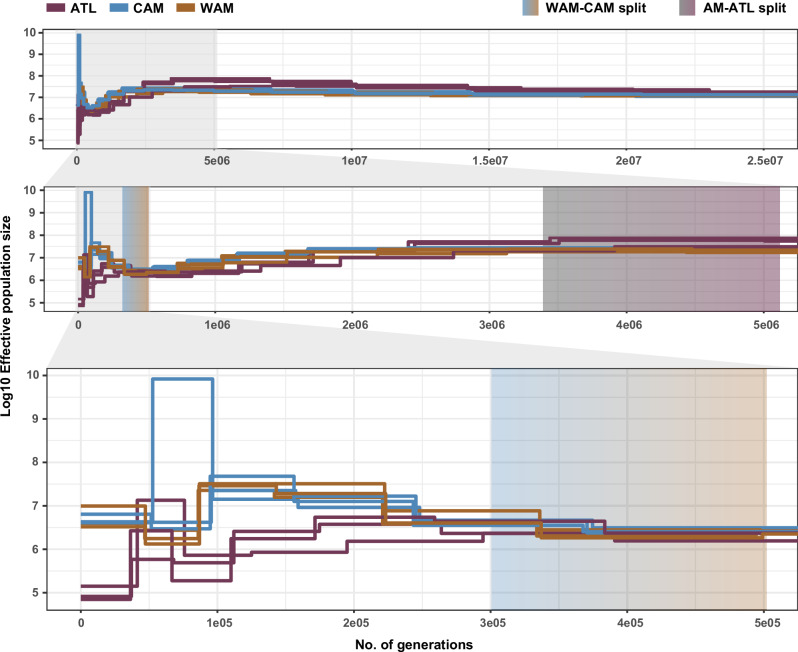
The Neotropical realm, one of the most biodiverse regions on Earth, houses a broad range of zoonoses that pose serious public health threats. Protozoan parasites of the Leishmania (Viannia) braziliensis clade cause zoonotic leishmaniasis in Latin America with clinical symptoms ranging from simple cutaneous to destructive, disfiguring mucosal lesions. We present the first comprehensive genome-wide continental study including 257 cultivated isolates representing most of the geographical distribution of this major human pathogen. The L. braziliensis clade is genetically highly heterogeneous, consisting of divergent parasite groups that are associated with different environments and vary greatly in diversity. Apart from several small ecologically isolated groups with little diversity, our sampling identifies two major parasite groups, one associated with the Amazon and the other with the Atlantic Forest biomes. These groups show different recombination histories, as suggested by high levels of heterozygosity and effective population sizes in the Amazonian group in contrast to high levels of linkage and clonality in the Atlantic group. We argue that these differences are linked to strong eco-epidemiological differences between the two regions. In contrast to geographically focused studies, our study provides a broad understanding of the molecular epidemiology of zoonotic parasites circulating in tropical America.


Conflict of interest statement

Competing interests: The authors declare no competing interests.

Figures

Fig. 1
Fig. 1. Read coverage and natural genome variation in the Leishmania (Viannia) subgenus.
a Coverages across the accessible genomes of all 257 isolates. Isolates contained a median of 17.8 k accessible genomic regions, altogether spanning a median of 29.96 Mb (i.e. 91.5% of the haploid genome). Three isolates (55_AVSA1, ELIZETE, and NMT_LTCP_14417_PA1) were removed because of aberrantly low coverage of accessible regions (10.2-10.8 Mb) compared to the other isolates; in silico multi-locus sequencing analysis (MLSA) revealed that these isolates were Leishmania amazonensis (55_AVSA1, ELIZETE) and Leishmania infantum (NMT_LTCP_14417_PA1) (results not shown). Three other isolates identified as L. braziliensis (4450A1, GC08A1, and ORO13A1) were also removed because of low median coverages (9×–14×) and fragmented callable genomes. b Number of homozygous and heterozygous SNPs in the remaining 244 L. (Viannia) isolates. c Phylogenetic network of the 244 L. (Viannia) isolates based on 834,178 bi-allelic SNPs. Note: the bold legend labels in panels (a, b) represent the same isolates, all of the L. braziliensis clade.
Fig. 2
Fig. 2. Divergence within the L. braziliensis clade.
a A phylogenetic network, based on 695,229 genome-wide SNPs, showing uncorrected p-distances between 222 isolates of the L. braziliensis clade (incl. L1, L3, and L. peruviana). b, c Principal component analysis for the 222 isolates showing the first three PC axes. df ADMIXTURE bar plots showing the estimated ancestry per isolate assuming K = 2 (d), K = 3 (e), and K = 4 (f) ancestral components. g Sample size distribution of Leishmania isolates from each group and per ecoregion. The four colours match the four ancestral components as inferred with ADMIXTURE K = 4 (f). Only isolates with at least 70% ancestry for a specific ancestral component were included. Ecoregion data is available from: https://gaftp.epa.gov/EPADataCommons/ORD/Ecoregions/sa/.
Fig. 3
Fig. 3. Population genomic structure of L. braziliensis L1.
a ADMIXTURE barplots depicting the ancestry per isolate (Nunique = 116) assuming K = 2, K = 3, and K = 5 ancestral components. Isolates are labelled according to K = 3 ancestral components. Black is used for isolates with uncertain/hybrid ancestry (CON). Outer vertical lines show the major parasite groups (WAM, CAM, ATL, and CON) delineated by ADMIXTURE for K = 3. Inner vertical lines represent the parasite groups within WAM as inferred by ADMIXTURE for K = 5 in this study, which is in accordance with Heeren et al. (PAU, HUP, INP, and ADM). The left bound tree represents the population tree of L1 as inferred by fineSTRUCTURE. Branch support values represent the posterior probability for each inferred clade. b Sample size distribution per ancestral component per ecoregion (level 2) for all isolates with at least 85% ancestry to a specific group/population. Ecoregion data is available from: https://gaftp.epa.gov/EPADataCommons/ORD/Ecoregions/sa/. c, d Map of the South American continent showing the L1 population genomic structure, assuming K = 3 (c) and K = 5 (d) populations. The base map depicts the occurrence of (sub-) tropical moist broadleaf forests; data is available from: http://maps.tnc.org/gis_data.html. Country-level data were available from: https://diva-gis.org/data.html. CAM central Amazon, WAM west Amazon, ATL Atlantic, CON conglomerate, PAU Southern Peru, HUP central/northern Peru, INP central Bolivia, ADM admixed.
Fig. 4
Fig. 4. Copy number variations across the major L. braziliensis populations.
a Scatterplot showing the first two principal components as calculated based on haploid copy numbers of all CNVs, after removing isolates of clonal group 3 (see “Methods”). Ellipses represent the 95% confidence boundaries of the major parasite populations in the PCA space. b, c Violin plots summarizing the number of CNVs per parasite genome. d, e Survival curves depicting the CNV burden per L. braziliensis population.
Fig. 5
Fig. 5. Contrasting clonality and population structure in L. braziliensis L1.
a Clonal prevalence per population. b, c Distribution of genotypes in the Amazon and along the Atlantic coast, summarized per department/state of the respective country. The size of each pie indicates the number of genotypes found in each locality with each segment representing a unique genotype. Coloured segments indicate the different clonal groups that were identified. Note: *clonal group 4 is not included as it consists of two isolates of the CON group; **clonal group 3, located in Salta, Argentina belongs to ATL. d Linkage disequilibrium decay of the different L. braziliensis populations, accounting for spatio-temporal Wahlund effects and population size. e The number of loss-of-heterozygosity (LOH) regions per major population. f Proportion of LOH regions across the genome per major population. For panels (b, c) the base map depicts the occurrence of (sub-) tropical moist broadleaf forests; data is available from: http://maps.tnc.org/gis_data.html. Country-level data were available from: https://diva-gis.org/data.html.
Fig. 6
Fig. 6. Estimated effective population sizes (Ne) per population for four possible migration scenarios.
Each row depicts the Ne estimates per population for a given model of historical migration. WAM, CAM, and ATL represent the three major populations as inferred by ADMIXTURE and fineSTRUCTURE (Fig. 3a). AM represents the ancestral population prior to the split of WAM and CAM. Four models of historical migration were tested: (i) no migration, (ii) unidirectional migration from AM to ATL, (iii) unidirectional migration from ATL to AM, and (iv) bidirectional migration between AM and ATL.
Fig. 7
Fig. 7. Simulated changes in Ne per population through time (in units of generations ago).
Simulations were performed in triplicate; on the same sample subsets per population as Fig. 6. Gradient boxes depict the estimated time of the first population split (rCCR ≈ 0.5) within the past 25 million generations, between WAM-CAM and AM-ATL based on the relative cross-coalescence rate (Supplementary Figs. 8 and 9). AM = WAM + CAM.

References

    1. Reithinger, R. et al. Cutaneous leishmaniasis. Lancet Infect. Dis.7, 581–596 (2007). - PubMed
    1. Nuwangi, H. et al. Stigma associated with cutaneous and mucocutaneous leishmaniasis: a systematic review. PLoS Negl. Trop. Dis.17, e0011818 (2023). - PMC - PubMed
    1. Alvar, J. et al. Leishmaniasis worldwide and global estimates of its incidence. PLoS One7, e35671 (2012). - PMC - PubMed
    1. Odiwuor, S. et al. Evolution of the Leishmaniabraziliensis species complex from amplified fragment length polymorphisms, and clinical implications. Infect. Genet. Evol.12, 1994–2002 (2012). - PubMed
    1. Van der Auwera, G. et al. Evaluation of four single-locus markers for Leishmania species discrimination by sequencing. J. Clin. Microbiol.52, 1098–1104 (2014). - PMC - PubMed

LinkOut - more resources