. 2024 Nov 28;7(1):1589.
doi: 10.1038/s42003-024-07288-x.

Prenatal dexamethasone exposure reduces osteoprogenitor proliferation in mice via histone modifications at the Mkp-1 gene locus

Affiliations

Prenatal dexamethasone exposure reduces osteoprogenitor proliferation in mice via histone modifications at the Mkp-1 gene locus

Yongheng Xie et al. Commun Biol. .

Abstract

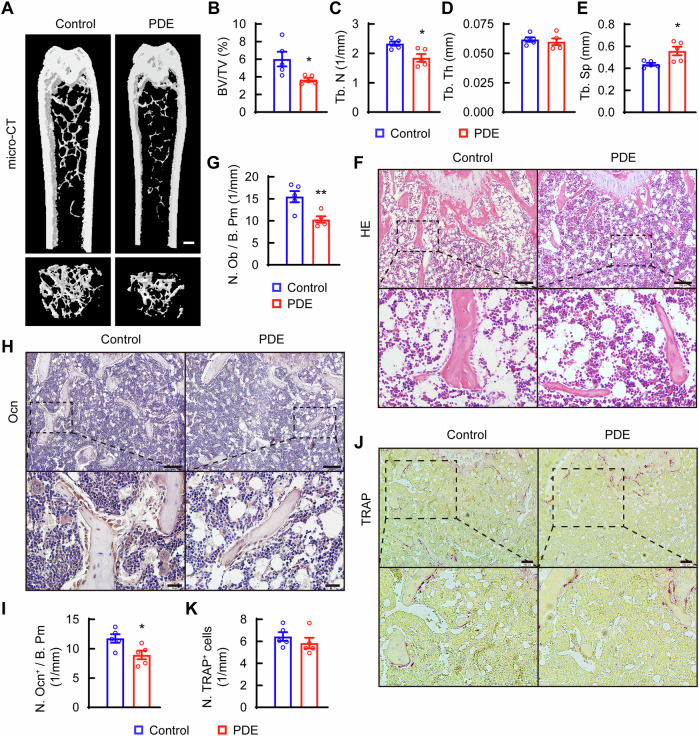
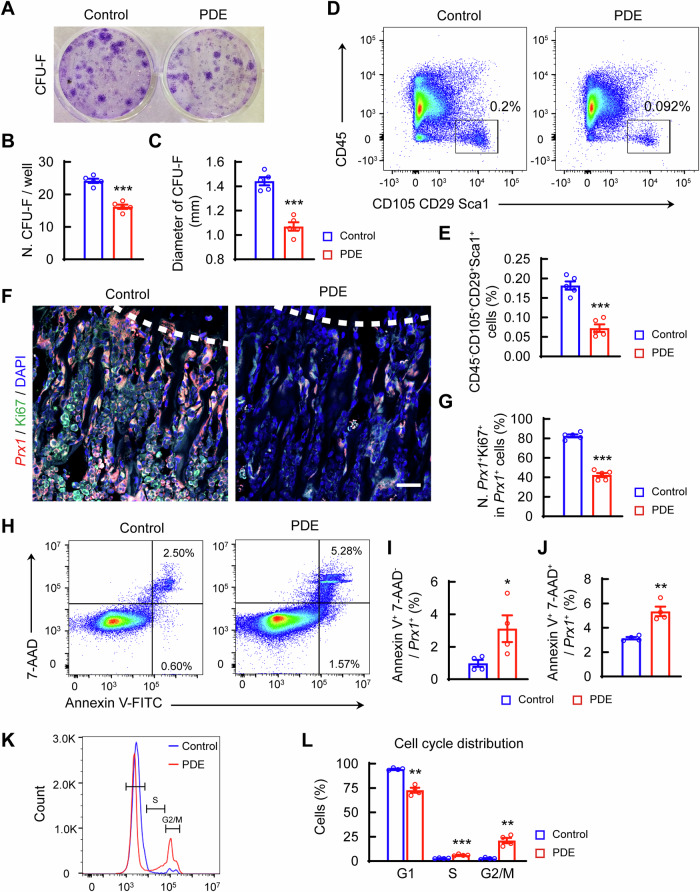
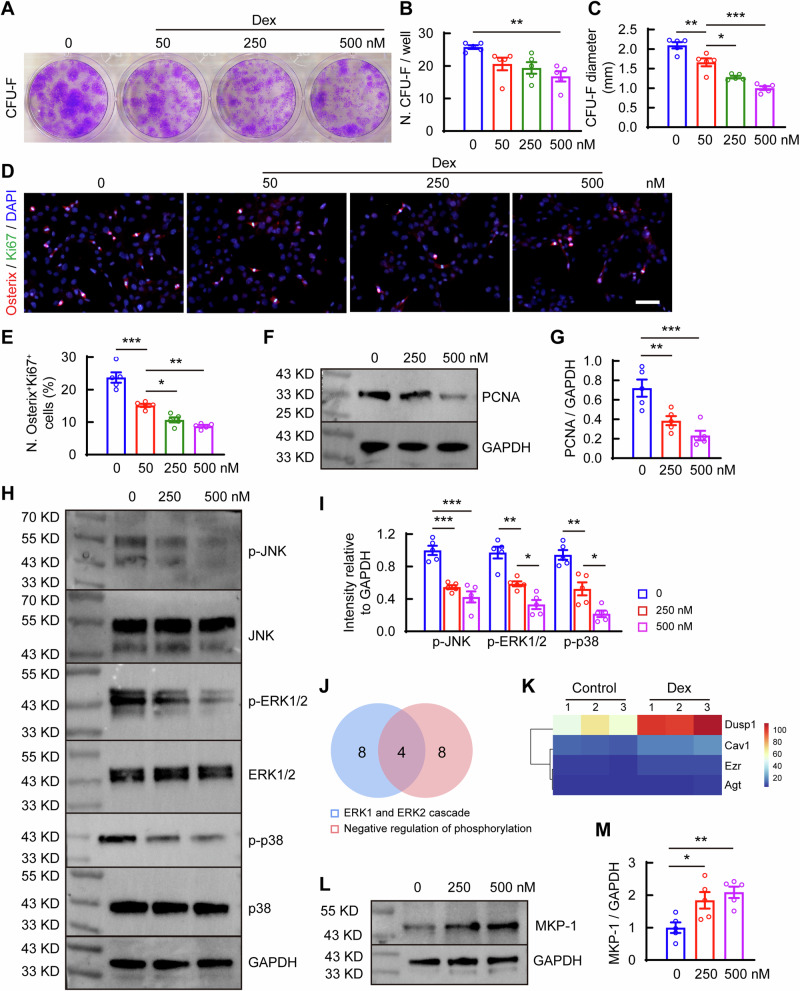
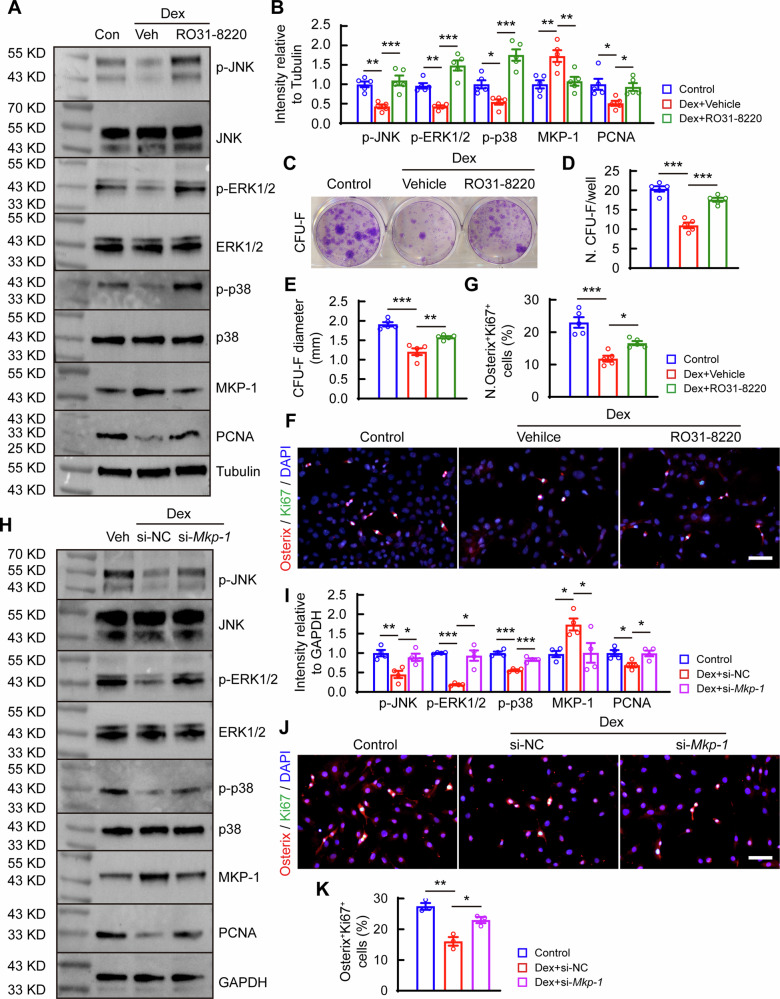
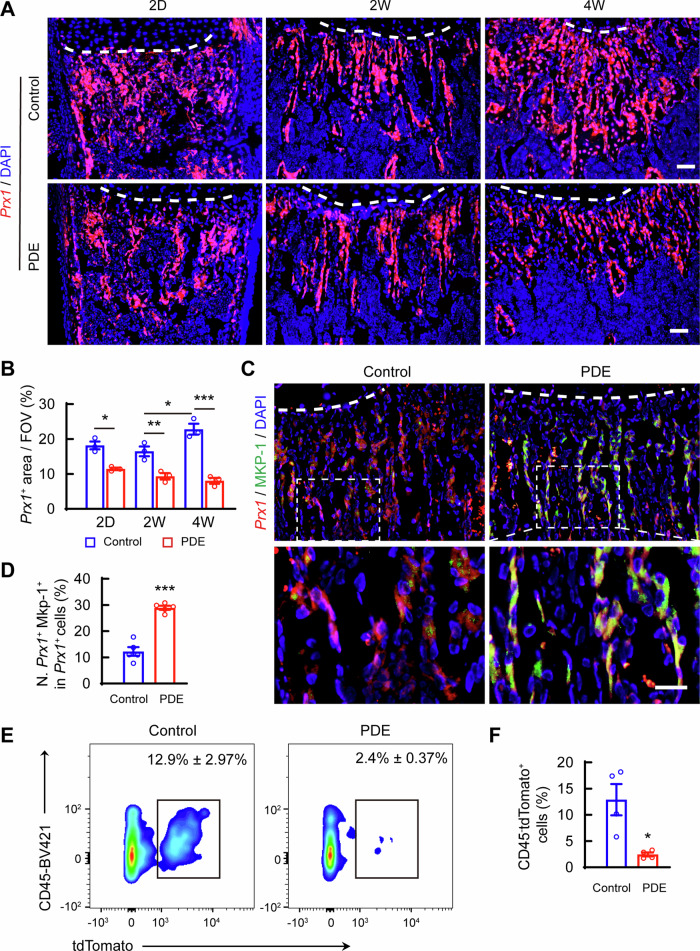
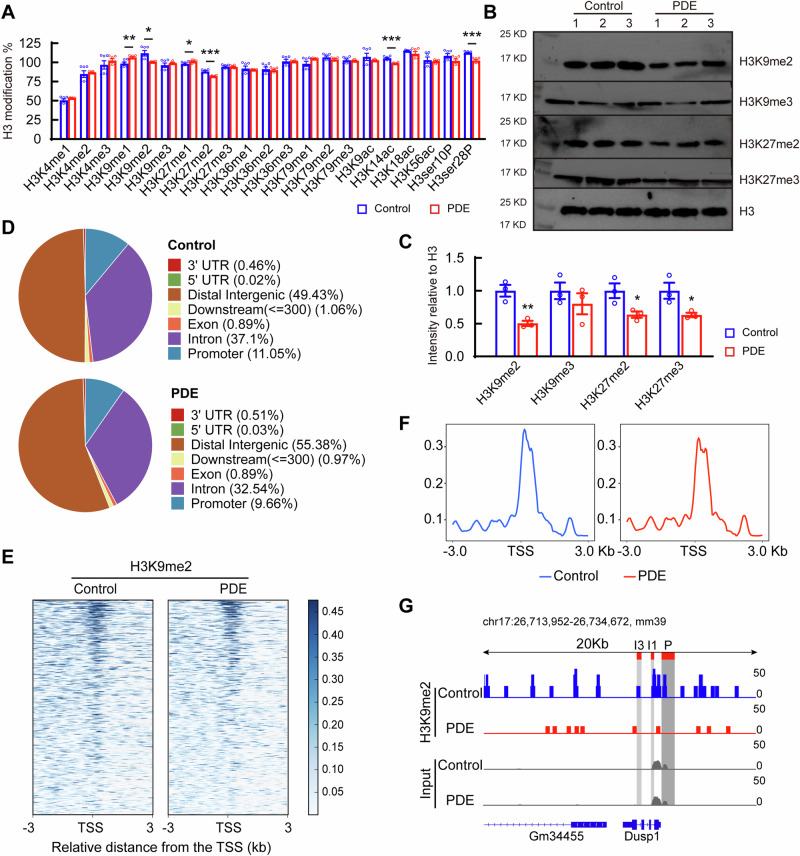
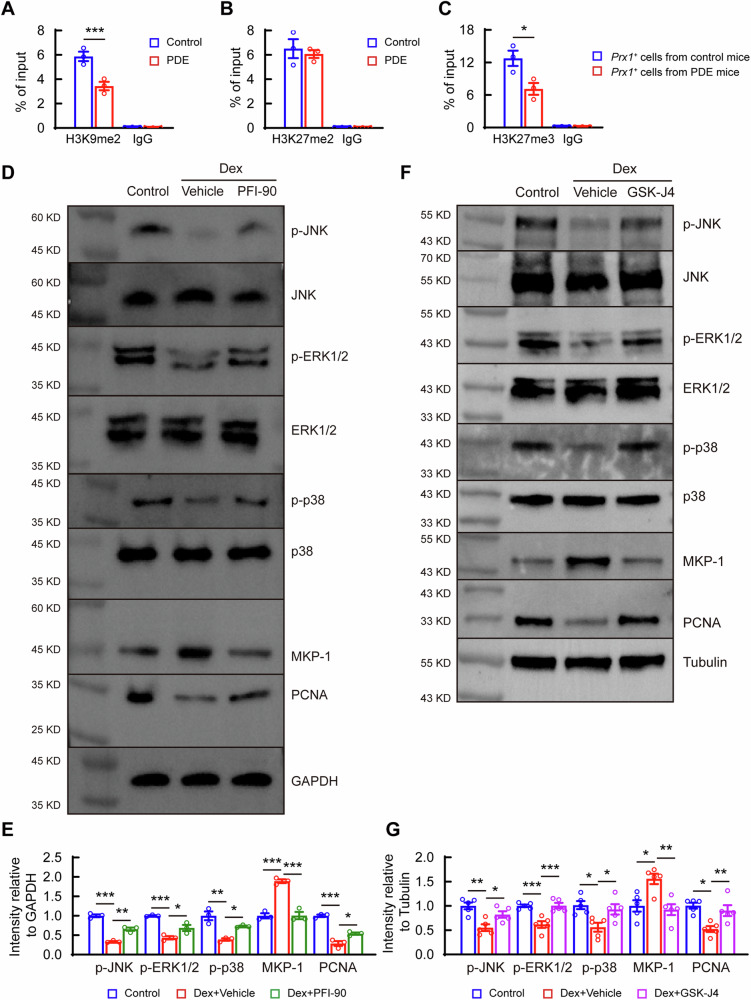
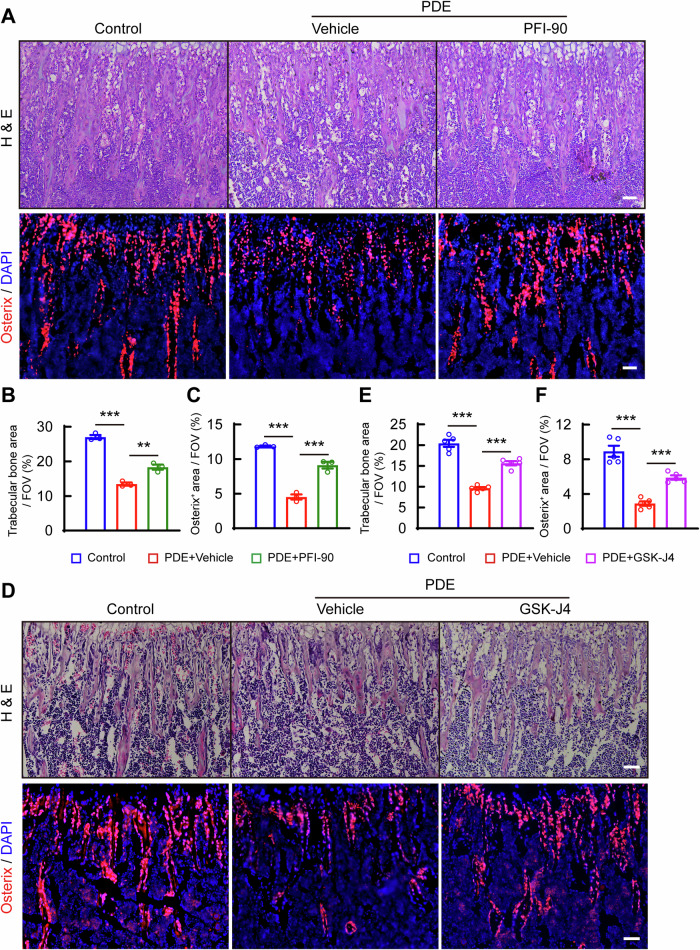
Prenatal dexamethasone exposure (PDE) has long-term consequences in bone development, though the underlying mechanisms remain unclear. Our results show that PDE offspring exhibit reduced bone mass, fewer osteoblasts and diminished osteoprogenitors proliferation. Further analyses show that PDE increases MKP-1 expression, while decreasing H3 lysine 9 dimethylation (H3K9me2) and H3 lysine 27 trimethylation (H3K27me3) at the Mkp-1 gene locus. Mechanistically, dexamethasone suppresses osteoprogenitors proliferation by upregulating MKP-1 expression, notably through the inhibition of H3K9me2 and H3K27me3 modifications, which promote demethylation and transcriptional activation of the Mkp-1 gene. Importantly, restoring histone methylation balance with PFI-90 or GSK-J4 treatment blocks the inhibitory effects of PDE on MAPK signaling in osteoprogenitors, and mitigates the detrimental impact of PDE on osteoprogenitor proliferation and bone development in the offspring. This study provides new insights into the epigenetic mechanism by which PDE disrupts long-term programming of fetal osteoprogenitor proliferation, ultimately impairing long bone growth in offspring.


Conflict of interest statement

Competing interests: The authors declare no competing interests. Ethics approval: All animal experiments were ethically approved by the Animal Ethics Committee of Southern Medical University Nanfang Hospital.

Figures

Fig. 1
Fig. 1. Prenatal dexamethasone exposure (PDE) induces a lower trabecular bone mass along with fewer osteoblasts in the long bones of adult female offspring.
A Representative three-dimensional (3D) images of coronal sections and transverse sections of distal femurs in 28-week-old female mouse offspring. Scale bars: 500 μm. BE Parameters of trabecular bone in distal femurs were analyzed, including B trabecular bone volume fraction (BV/TV), C trabecular number (Tb.N), D trabecular thickness (Tb.Th), and E trabecular separation (Tb.Sp). F Representative images of hematoxylin–eosin (H&E) staining in femoral sections from control and PDE mouse offspring and G quantitative analysis of the number of osteoblasts per trabecular bone perimeter (N. Ob/B. Pm) in metaphyseal bone below a growth plate. Scale bar = 100 μm. H Representative images of immunohistochemical staining for osteocalcin (Ocn) and I quantification of Ocn+ cells per trabecular bone perimeter (N. Ocn+/B. Pm) in metaphyseal bone. Scale bars: 100 μm (top) and 20 μm (bottom). J Representative images of tartrate-resistant acid phosphatase (TRAP) staining and K quantification of TRAP+ cells per trabecular bone perimeter (N. TRAP+/B. Pm) in metaphyseal bone below a growth plate. Scale bars: 100 μm (top). All data are presented as mean ± S.E.M., n = 5/group, *p < 0.05, ** p < 0.01 vs. each control determined by Welch’s t-test (B) or Student’s t-test (CE, G, I, and K).
Fig. 2
Fig. 2. PDE leads to less proliferation of osteoprogenitors in the long bone of offspring.
A CFU-F assay of bone marrow osteoprogenitors in the long bones of control and PDE mouse offspring. B, C Quantitative analysis of the number (B) and size (C) of colonies. n = 5/group. D Representative images of the flow cytometry analysis and E the percentage of CD45CD29+CD105+Sca1+ cells in femoral bone from control and PDE mouse offspring. n = 5/group. F Representative images of immunofluorescence staining for Ki67 (green) in frozen sections labeled with Prx1+ cells (red). Scale bar = 30 μm. The white dashed lines in the images mark the interface between the growth plate and the metaphyseal trabecular bone. G Quantification of the number of Prx1+Ki67+ cells in metaphyseal bone below the growth plate. n = 5/group. H Representative graphs of flow cytometry analysis and quantification of the percentage of early apoptosis Annexin V+7-AAD cells I and late apoptosis Annexin V+7-AAD+ cells J in Prx1+ cells. Bone marrow of tibias and femurs from 4-week-old PDE and control Prx1Cre-tdTomato mouse offspring were flushed out, passed through a 70-μm strainer, stained with Annexin V/7-AAD, and then used for flow cytometry analysis. n = 4/group. K Cell cycle profiling by flow cytometry using 7-AAD for DNA content analysis and L the percentage of Prx1+ cells in G1-, S-, and G2/M-phases. n = 4/group. Data are presented as mean ± S.E.M., *p < 0.05, ** p < 0.01, *** p < 0.001 vs. each control determined by Student’s t-test or Welch’s t-test.
Fig. 3
Fig. 3. Dexamethasone represses proliferation of osteoprogenitors and MAPK signaling in vitro.
A Representative images of CFU-F staining for primary bone marrow osteoprogenitors treated with various concentrations of dexamethasone for 7 days. B, C Quantitative analysis of the number (B) and size (C) of colonies. n = 5/group. D Double-immunofluorescence staining for Ki67 (green) and Osterix (red) in primary bone marrow osteoprogenitors culture treated with dexamethasone for 48 h. Scale bar = 50 μm. Blue DAPI stained nuclei. E Percentage of Osterix+Ki67+ cells in Osterix+ cells. n = 5/group. F Representative images of western blot for PCNA and G densitometric analysis of the relative level of PCNA to GAPDH. n = 5/group. H Representative images of western blot measuring total and phosphorylation of JNK (p-JNK/JNK), ERK1/2 (p-ERK1/2/ERK1/2), and p38 (p-p38/p38) in primary osteoprogenitors treated with various concentrations of dexamethasone. I Densitometric analysis of the ratios of p-JNK, p-ERK1/2, and p-p38 to GAPDH. n = 5/group. J Venn diagram showing the overlapped genes between the “ERK1 and ERK2 cascade” item and the “Negative regulation of phosphorylation” item. K Heatmap of the relative mRNA expression levels of the overlapped genes in (J). Primary cultures of osteoprogenitors were treated with 250 nM dexamethasone or the same volume of vehicle (control) for 48 h. Total RNA was collected for transcriptome analysis. n = 3/group. L Representative images of Western blot for MKP-1. M Densitometric ratio of the MKP-1 to GAPDH. Cell lysates were obtained from primary osteoprogenitors treated with various concentrations of dexamethasone for 48 h (0, 250 and 500 nM). n = 5/group. Data are presented as mean ± S.E.M., *p < 0.05, **p < 0.01, and ***p < 0.001, one-way ANOVA with Bonferroni post hoc test. The western blot images were cropped for presentation and full-size blots are present in the Supplementary Fig. 8.
Fig. 4
Fig. 4. MKP-1 inhibition rescues the toxic effect of dexamethasone on the proliferation of osteoprogenitors.
A Representative images of western blot for total and phosphorylation of JNK (p-JNK/JNK), ERK1/2 (p-ERK1/2/ERK1/2), and p38 (p-p38/p38), MKP-1, and PCNA in primary osteoprogenitors. Cells were treated with 5 μM Ro-31-8220 for 30 min followed by 2 h of dexamethasone (250 nM) treatment. B Densitometric ratios of protein p-JNK, p-ERK1/2, p-P38, MKP-1, and PCNA to Tubulin, n = 5/group. C Representative images of CFU-F staining for primary bone marrow osteoprogenitors. Cells were treated with 250 nM dexamethasone in the presence or absence of 5 μM Ro-31-8220 for 7 days. Quantitative analysis of the number (D) and size (E) of colonies per well, n = 5/group. F Double-immunofluorescence staining of Osterix (red) and Ki67 (green) for primary osteoprogenitors. Cells were treated with 250 nM dexamethasone in the presence or absence of 5 μM Ro-31-8220 for 48 h. Scale bar = 50 μm. G Percentage of Osterix+Ki67+ cells in Osterix+ cells. All the above results were derived from experiments repeated independently five times. H, I Representative images of western blot (H) and quantitative analysis (I) of the indicated proteins in primary osteoprogenitors in the presence of si-Mkp-1. Cells were treated with si-Mkp-1 for 48 h followed by 2 h of dexamethasone (250 nM) treatment, n = 4/group. J Double-immunofluorescence staining of Osterix (red) and Ki67 (green) for primary osteoprogenitors. Cells were treated with 250 nM dexamethasone and transfected with control or Mkp-1 siRNA for 48 h. Scale bar = 50 μm. K Quantification of the percentage of Osterix+Ki67+ cells, n = 3/group. All data are presented as mean ± S.E.M., *p < 0.05, **p < 0.01, and *** p < 0.001, one-way ANOVA with Bonferroni post hoc test was used except for p-ERK1/2 in (I) (Dunnett T3). The western blot images were cropped for presentation and full-size blots are present in the Supplementary Fig. 8.
Fig. 5
Fig. 5. PDE induces persistent loss of Prx1+ cells and upregulation of MKP-1 expression.
A Representative fluorescence images of Prx1-tdTomato mice offspring at 2 days, 2 weeks, and 4 weeks after birth. Blue DAPI stained nuclei. Scale bar = 50 μm. B Percentage of Prx1+ cells area over the area of the field of view (FOV). n = 3/group, * p < 0.05, ** p < 0.01, *** p < 0.001, one-way ANOVA with Bonferroni post hoc test. C Representative images of immunofluorescence staining for MKP-1 (green) in frozen sections with tdTomato-labled Prx1+ cells. Rosa26-tdTomato mice were crossed with Prx1Cre mice, and PDE model was established in Rosa26-tdTomato pregnant mice. Four-week-old mice offspring identified as Prx1Cre+tdTomato+ were chosen for further analysis. Blue DAPI stained nuclei. Scale bar = 10 μm. D Quantification of the number of Prx1+MKP-1+ in metaphyseal bone below the growth plate, n = 5/group, *** p < 0.001, Student’s t-test. E Representative images of flow cytometry for CD45Prx1+ (tdTomato+) cells from the long bone of Prx1Cre-tdTomato offspring in control and PDE groups. F Quantification of the percentage of Prx1+ cells in CD45 cells, n = 4/group, * p < 0.05, Welch’s t-test. Data are presented as mean ± S.E.M. The white dashed lines in the images mark the interface between the growth plate and the metaphyseal trabecular bone.
Fig. 6
Fig. 6. PDE suppresses H3K9me2 modification at the Mkp-1 gene locus in osteoprogenitors form the long bones of young mice offspring.
A H3 modification assay of osteoprogenitors isolated from the bone marrow of PDE and control mice offspring (normalized to the total amount of H3). Data are presented as mean ± S.E.M., n = 6/group. * p < 0.05, ** p < 0.01, *** p < 0.001, Student’s t-test or Welch’s t-test. B Western blot analysis and C relative band densities of H3K9me2, H3K9me3, H3K27me2, and H3K27me3 in osteoprogenitors from control and PDE mice offspring. Primary osteoprogenitors were isolated from the long bones of 4-week-old mice offspring of control and PDE groups and cultured for 7 days expansion. Data are presented as mean ± S.E.M., n = 3/group, * p < 0.05, ** p < 0.01, Student’s t-test. Raw images for western blots were provided in Supplementary Fig. 8. D Pie chat showing genome-wide enrichment of ChIP signal of H3K9me2 in osteoprogenitors from control and PDE offspring. E Heatmap of hierarchical clustering of H3K9me2 binding enrichment for all ChIP-seq gene promoters, spanning ±3 kb of transcription start sites (TSS). F The average levels of H3K9me2 for all refseq gene promoters, spanning ±3 kb of TSS. G Genome Browser tracks showing the enrichment level of H3K9me2 at the Mkp-1 locus in osteoprogenitors from control and PDE young mice offspring. The y-axis represents normalized read counts to the reference mm39 genome. P: promoter, I1: intron 1, I3: intron 3.
Fig. 7
Fig. 7. PDE induces persistent upregulation of MKP-1 expression by suppressing H3K9me2 and H3K27me3 modification at the Mkp-1 gene locus.
AD Chromatin immunoprecipitation (ChIP)-qPCR analysis of H3K9me2 (A), H3K27me2 (B), and H3K27me3 (C) enrichment levels at the Mkp-1 gene locus in bone marrow osteoprogenitors collected from 4-week-old offspring in control and PDE groups. IgG served as a negative control. n = 3/group. * p < 0.05, *** p < 0.001, one-way ANOVA with Bonferroni post hoc test. D Representative images of western blot for total and phosphorylation of JNK (p-JNK/JNK), ERK1/2 (p-ERK1/2/ERK1/2) and p38 (p-p38/p38), MKP-1, and PCNA. Cells were treated with 100 nM PFI-90 or the same volume of ethanol (control) for 30 min followed by 2 h of 250 nM dexamethasone treatment. E Densitometric analysis of the relative level of protein expression to GAPDH. n = 3/group. *p < 0.05, ** p < 0.01, *** p < 0.001, one-way ANOVA with Bonferroni post hoc test. F Representative images of western blot for p-JNK/JNK, p-ERK1/2/ERK1/2, p-p38/p38, MKP-1, and PCNA. Cells were treated with 1 μM GSK-J4 for 30 min followed by 2 h of 250 nM dexamethasone treatment. G Densitometric analysis of the relative level of protein expression to Tubulin. n = 5/group. All data are presented as mean ± S.E.M., *p < 0.05, ** p < 0.01, *** p < 0.001, one-way ANOVA with Bonferroni post hoc test. The western blot images were cropped for presentation and full-size blots are presented in the Supplementary Fig. 8.
Fig. 8
Fig. 8. Both PFI-90 and GSK-J4 restore osteoblasts and osteoprogenitors in PDE offspring.
A Representative images of hematoxylin-eosin (H&E) staining and immunofluorescence staining for Osterix (Red) in femoral metaphysis from 2-week-old female offspring in PDE groups treated with PFI-90 or vehicle and control groups. Blue DAPI stained nuclei. Scale bar = 50 μm. Quantitative analysis of trabecular area (B) and Osterix+ area (C) in the femoral metaphyseal bone area. n = 3/group, **p < 0.01, ***p < 0.001, one-way ANOVA with Bonferroni post hoc test was used. D Representative images of hematoxylin-eosin (H&E) staining and immunofluorescence staining for Osterix (Red) in femoral metaphysis from 2-week-old female offspring in PDE groups treated with GSK-J4 or vehicle and control groups. Blue DAPI stained nuclei. Scale bar = 50 μm. Quantitative analysis of trabecular area (E) and Osterix+ area (F) in the femoral metaphyseal bone area. n = 5/group. All data are presented as mean ± S.E.M., ***p < 0.001, one-way ANOVA with Bonferroni post hoc test was used.

Similar articles

References

    1. Susiloretni, K. A. et al. The psychological distress of parents is associated with reduced linear growth of children: Evidence from a nationwide population survey. PLoS ONE16, e0246725 (2021). - PMC - PubMed
    1. Rodriguez, A. et al. Antenatal corticosteroid therapy (ACT) and size at birth: a population-based analysis using the Finnish Medical Birth Register. PloS Med.16, e1002746 (2019). - PMC - PubMed
    1. Heppe, D. H. et al. Fetal and childhood growth patterns associated with bone mass in school-age children: the Generation R Study. J. Bone Min. Res.29, 2584–2593 (2014). - PubMed
    1. Kopiczko, A., Adamczyk, J. G. & Łopuszańska-Dawid, M. Bone mineral density in adolescent boys: cross-sectional observational study. Int. J. Environ. Res Public Health18, 245 (2020). - PMC - PubMed
    1. Haikerwal, A. et al. Bone health in young adult survivors born extremely preterm or extremely low birthweight in the post surfactant era. Bone143, 115648 (2021). - PubMed