. 2025 Jan;26(1):82-91.
doi: 10.1038/s41590-024-02023-4. Epub 2024 Nov 28.

Circulating tumor-reactive KIR+CD8+ T cells suppress anti-tumor immunity in patients with melanoma

Affiliations

Circulating tumor-reactive KIR+CD8+ T cells suppress anti-tumor immunity in patients with melanoma

Benjamin Y Lu et al. Nat Immunol. 2025 Jan.

Abstract

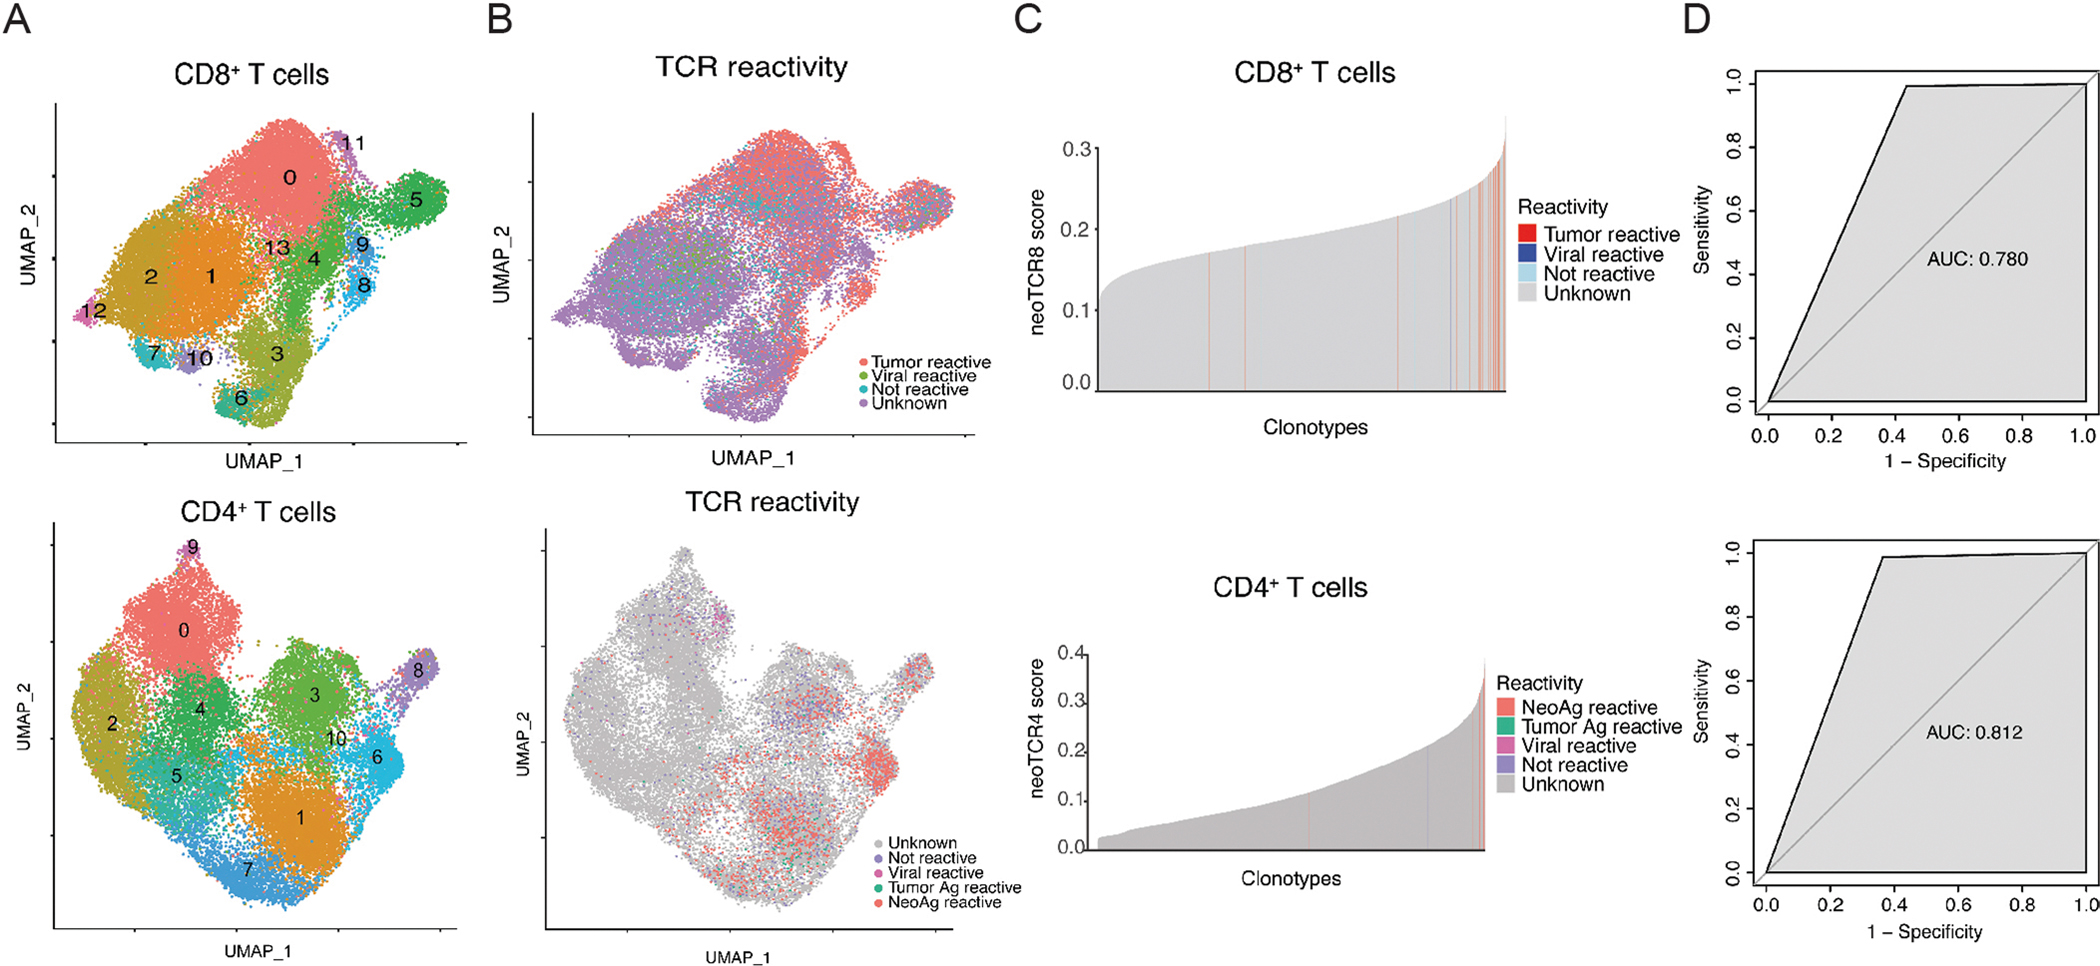
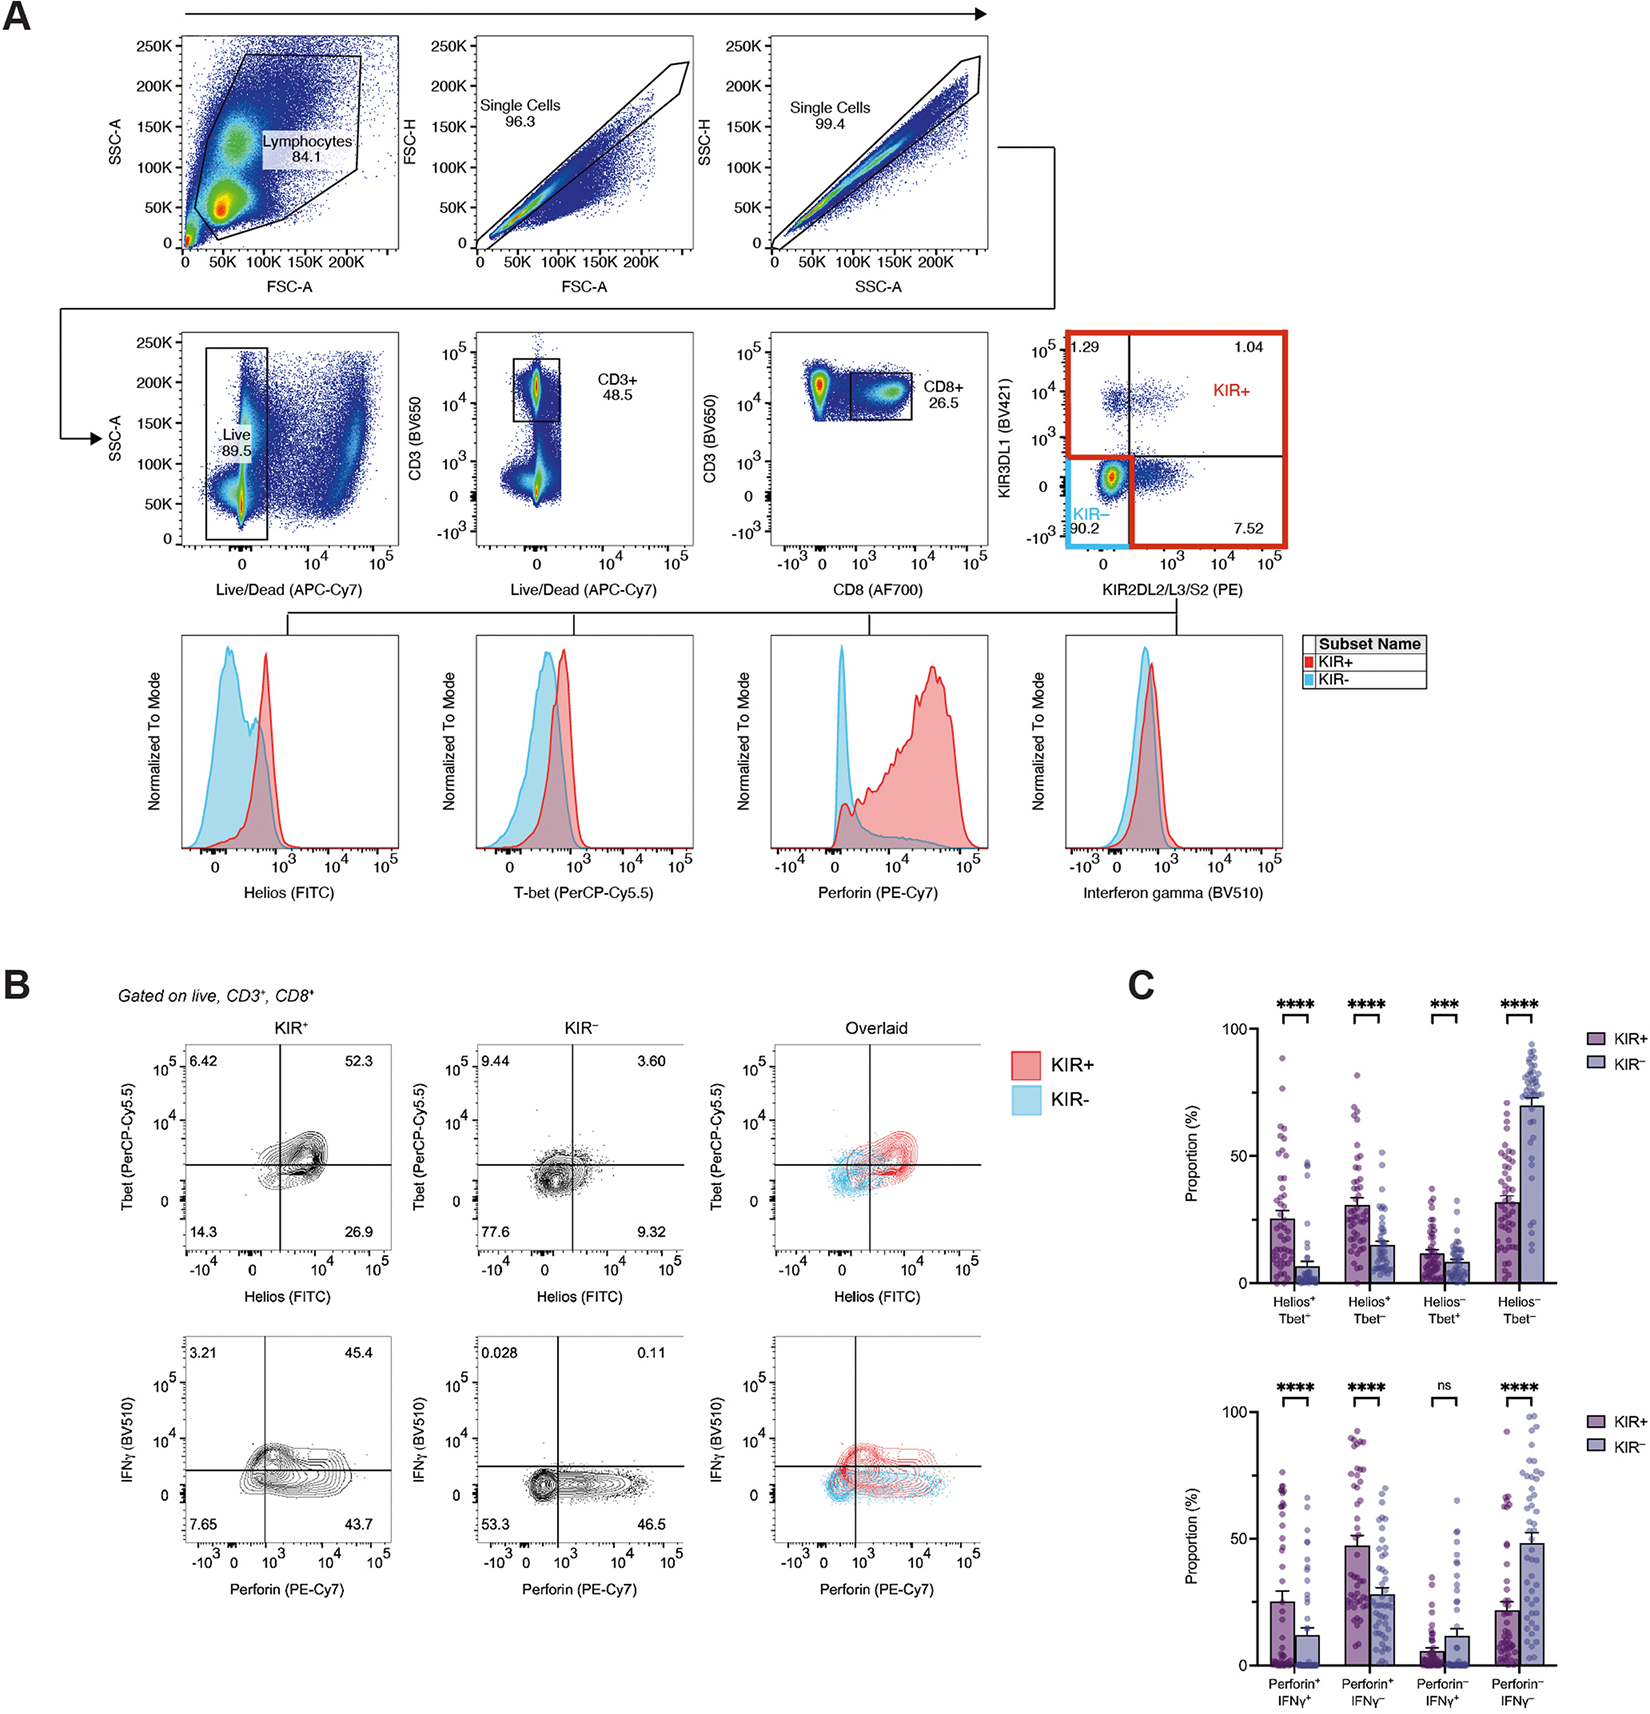
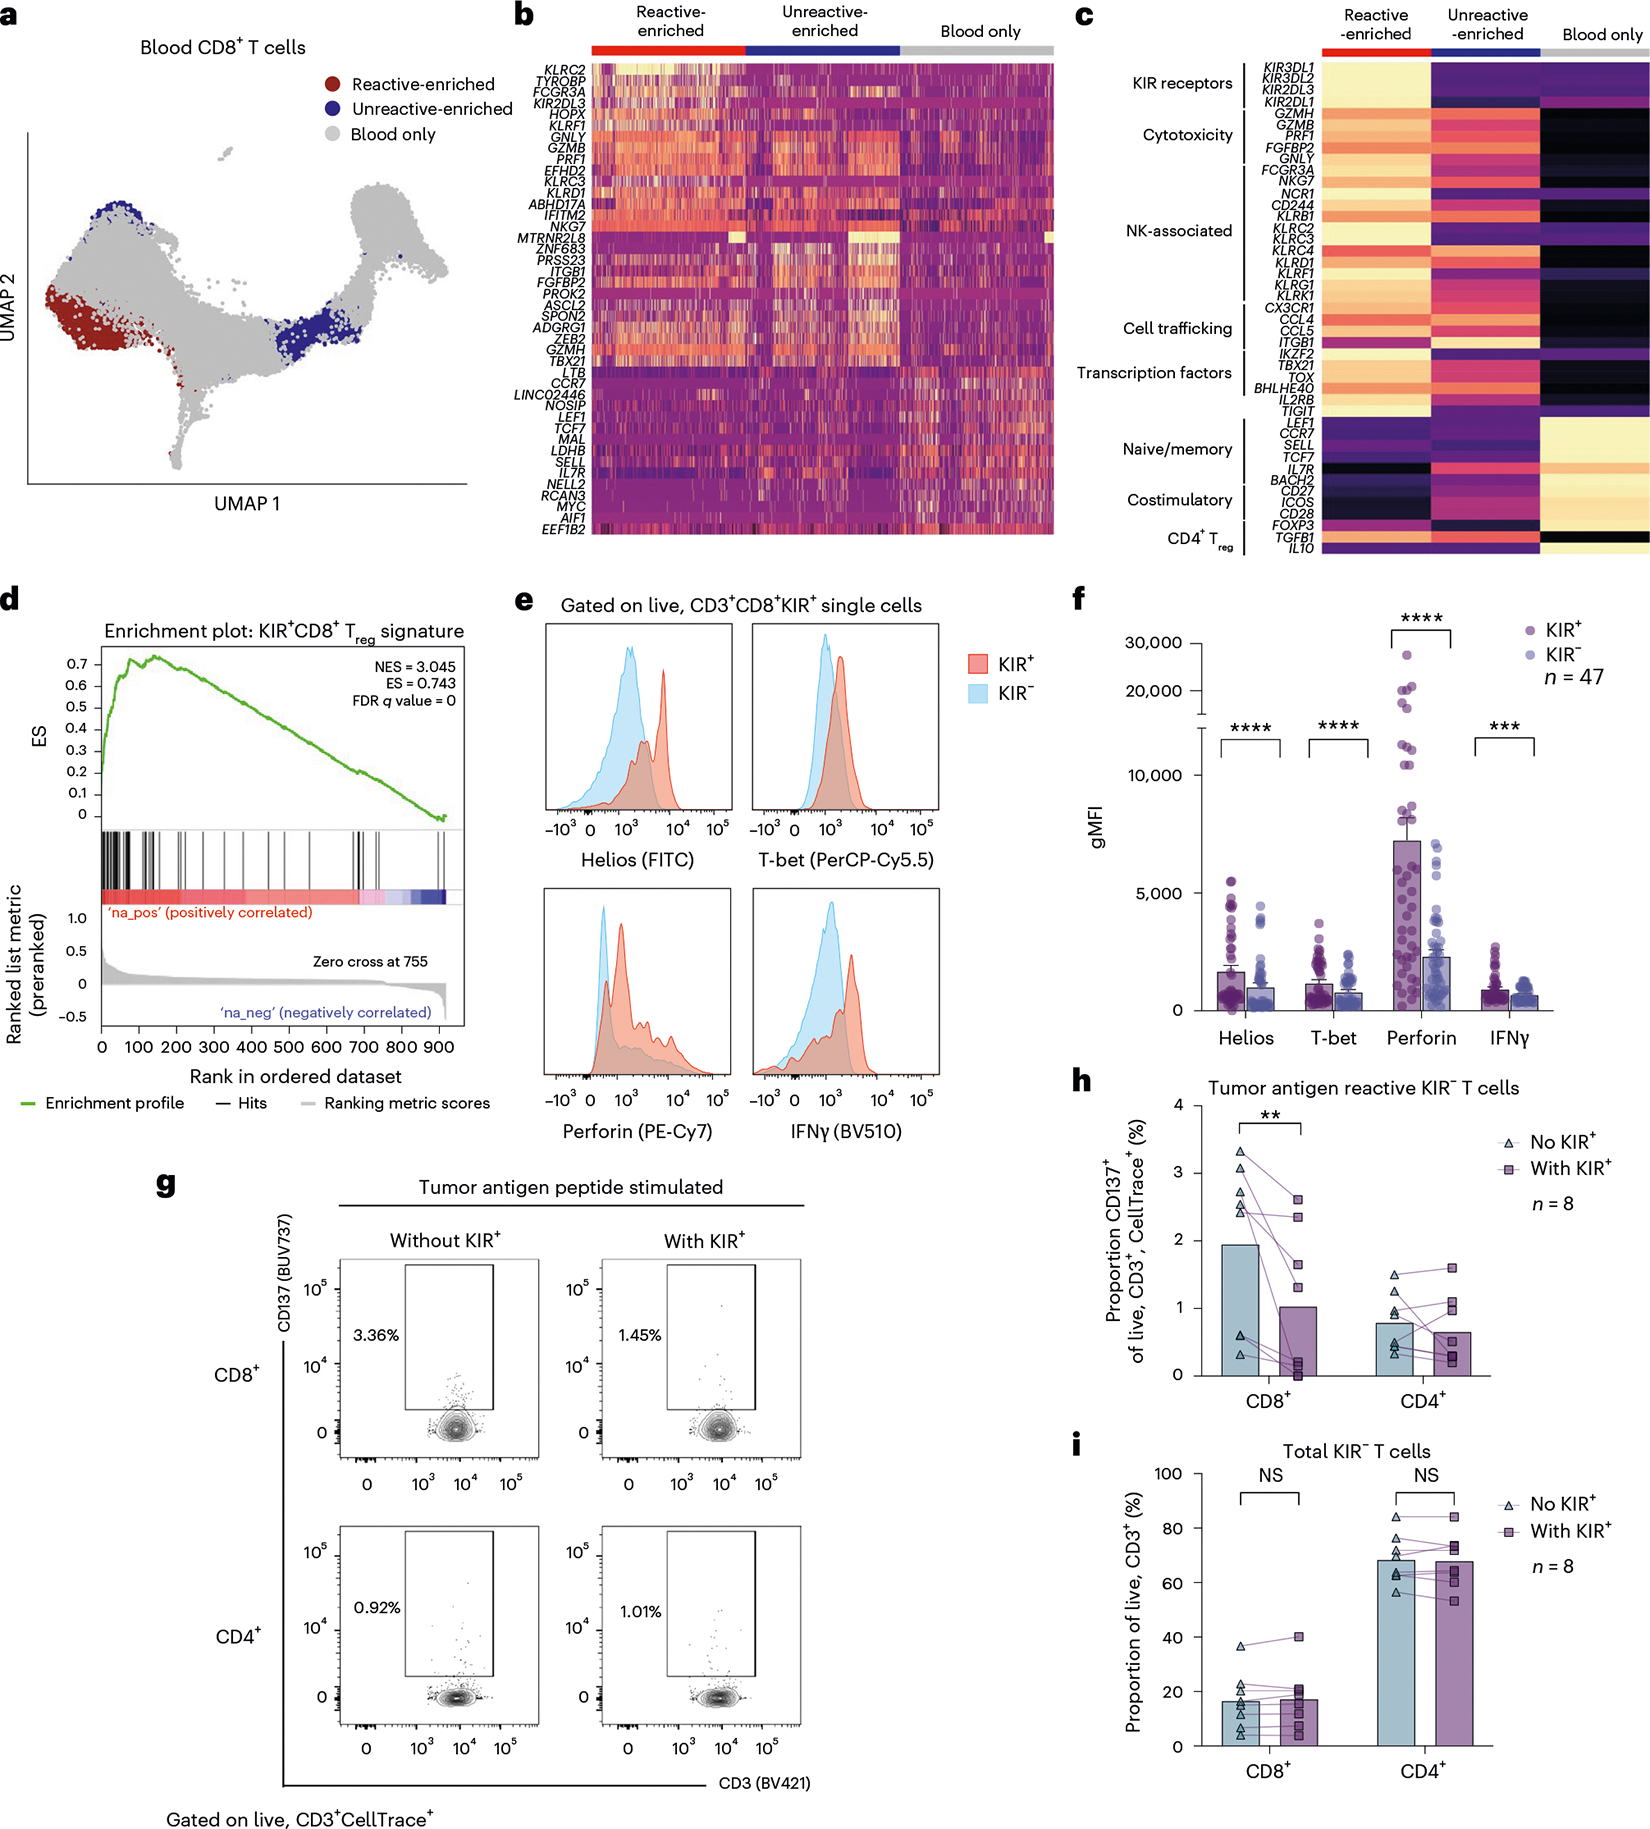
Effective anti-tumor immunity is driven by cytotoxic CD8+ T cells with specificity for tumor antigens. However, the factors that control successful tumor rejection are not well understood. Here we identify a subpopulation of CD8+ T cells that are tumor-antigen-specific and can be identified by KIR expression but paradoxically impair anti-tumor immunity in patients with melanoma. These tumor-antigen-specific KIR+CD8+ regulatory T cells target other tumor-antigen-specific CD8+ T cells, can be detected in both the tumor and the blood, have a conserved transcriptional program and are associated with a poor overall survival. These findings broaden our understanding of the transcriptional and functional heterogeneity of human CD8+ T cells and implicate KIR+CD8+ regulatory T cells as a cellular mediator of immune evasion in human cancer.


Conflict of interest statement

Competing interests: D.A.H. has received research funding from Bristol-Myers Squibb, Novartis, Sanofi and Genentech. He has been a consultant for Bayer Pharmaceuticals, Repertoire Inc, Bristol-Myers Squibb, Compass Therapeutics, EMD Serono, Genentech, Juno therapeutics, Novartis Pharmaceuticals, Proclara Biosciences, Sage Therapeutics and Sanofi Genzyme. H.M.K. has received institutional research grants from Bristol-Myers Squibb, Merck and Apexigen and financial support from Bristol-Myers Squibb, Iovance, Chemocentryx, Signatero, Gigagen, GI Reviewers, Pliant Therapeutics, Esai, Wherewolf and Invox. C.V.N., S.H., A.J.C., J.K. and F.-J.O. are employees and/or stockholders of Repertoire Immune Medicines. S.H., F.-J.O. and J.K. are employees of Repertoire Immune Medicines (Switzerland) AG, formerly Tepthera Ltd. The other authors declare no competing interests.

Figures

Extended Data Fig. 1 |
Extended Data Fig. 1 |. Transcriptional prediction of tumor antigen reactivity in tumor-infiltrating T cell reference single-cell dataset from patients with melanoma.
a-b) UMAP dimensionality reduction plots of single-cell RNA sequencing data generated from tumor-infiltrating CD8+ (top row) and CD4+ (bottom row) T cells from patients with melanoma (n = 4) as labeled with transcriptional cluster numbers (a) or experimentally-validated antigen reactivity. c) Histogram of neoTCR module score expression for each T cell clonotype, colored by antigen reactivity. d) Receiver operating characteristic curve of predicted reactivity based on neoTCR8 (top row) or neoTCR4 (bottom row) labeling.
Extended Data Fig. 2 |
Extended Data Fig. 2 |. Single-cell characterization of circulating T cells in patients with advanced melanoma.
a-c) UMAP dimensionality reduction plots of single-cell RNA sequencing data generated from blood T cells from patients with cutaneous melanoma (n = 17) as labeled by transcriptional clusters (a), TCR chains (b), or automated label assignments using the SingleR package (c). Cell labels were assigned based on similarity to bulk RNA sequencing signatures from sorted human peripheral blood mononuclear cells. d) Violin plots of canonical T cell lineage genes in each transcriptional cluster. e) Heatmap of the top 10 differentially expressed genes across each transcriptional cluster. f) UMAP highlighting tumor-matched, predicted reactive CD8+, CD4+ (blue), or unreactive and blood exclusive T cells (grey). g) Histogram of the log-normalized proportion of the total T cell repertoire occupied by a predicted reactive CD8+ (red), predicted reactive CD4+ (green), or unreactive and blood exclusive (blue) T cells in the blood. h) Bar graph summary of the proportion of transcriptional clusters in predicted reactive or predicted unreactive T cells.
Extended Data Fig. 3 |
Extended Data Fig. 3 |. Distribution of circulating T cell types in patients with immunotherapy-naive advanced melanoma.
a-b) CD8+, CD4+, and MAIT T cells by cell number (a) or proportion (b) in the single-cell RNA sequencing dataset generated from patients with immunotherapy-naive cutaneous melanoma (n = 17). c-d) The proportion of predicted-reactive blood CD8+ (c) or CD4+ (d) T cells by patient. e) The proportion of patients in all predicted-reactivity (Baseline) or differentially abundant groups.
Extended Data Fig. 4 |
Extended Data Fig. 4 |. Single-cell characterization of circulating CD8+ T cells in patients with immunotherapy-naive advanced melanoma.
a) UMAP dimensionality reduction plot of blood-based CD8+ T cells from patients with immunotherapy-naive cutaneous melanoma (n = 17) annotated with automated label assignments using the SingleR package. Cell labels were based on bulk RNA sequencing signatures from sorted human peripheral blood mononuclear cells. b) Heatmap of the expression of hallmark genes from CD8+ T cell states across differentially abundant predicted-reactive (Reactive), differentially abundant predicted-unreactive (Unreactive), and all other CD8+ T cell transcriptional clusters. c) Heatmap representation of overlap scores calculated against a single-cell RNA sequencing CD8+ T cell atlas from patients with cancer,,,. d) UMAP plots highlighting the expression of published gene signatures associated with tumor matched, circulating CD8+ T cells (‘Circulating TIL’) and circulating CD8+ T cells clonally related to cells expanded in the tumor (‘Expansion TIL’).
Extended Data Fig. 5 |
Extended Data Fig. 5 |. T cell repertoire diversity metrics in circulating CD8+ T cells in patients with immunotherapy-naive advanced melanoma.
Quantitative measures of T cell receptor repertoire diversity in predicted-reactive CD8+ T cells (‘Matched reactive’), predicted-unreactive (‘Matched unreactive’), and T cells found only in the blood (‘Blood only’) from patients with immunotherapy-naive cutaneous melanoma. Between group differences were determined with Kruskal–Wallis one-way analysis of variance testing with Dunn’s multiple comparison testing (ns = not significant, * P < 0.05, ** P < 0.01, **** P < 0.0001).
Extended Data Fig. 6 |
Extended Data Fig. 6 |. Immunophenotyping blood CD8+ T cells from patients with melanoma using flow cytometry.
a) Representative gating strategy for immunophenotyping peripheral blood mononuclear cells from patients with advanced melanoma. The gating strategy were kept the same across all samples for each experimental batch. Intracellular markers (Helios, T-bet, Perforin, interferon-gamma) in KIR+ (red) and KIR (blue) CD8+ T cells in histograms. b) Representative flow cytometry contour plots of transcription factor (top) or cytokine (bottom) co-expression in the KIR+ (left), KIR (middle), or overlaid (right) populations. c) Bar plots summarizing the co-expression patterns of transcription factors (top) or cytokines (bottom) in all patients (n = 47). Between group differences were calculated using two-sided Wilcoxon matched-pairs signed-rank testing with Benjamini, Krieger, and Yekutieli correction for multiple comparison testing (ns = not significant, *** q < 0.001, **** q < 0.0001).
Extended Data Fig. 7 |
Extended Data Fig. 7 |. Peptide stimulated CD8+ T cell suppression assay.
a) Experimental workflow of the CD8+ T cell suppression assay. b) Representative flow cytometry gating strategy to assess the proportion of peptide reactive (CD137+) T cells. The gating strategy was kept the same across all samples (n = 8). Graphic in a created with BioRender.com.
Extended Data Fig. 8 |
Extended Data Fig. 8 |. Single-cell characterization of tumor CD8+ T cells in patients with immunotherapy-naive advanced melanoma.
a) UMAP dimensionality reduction plot of tumor-infiltration CD8+ T cells annotated with unsupervised cluster numbers (top) and automated label assignments using the ProjectTIL package. b) Heatmap of the expression of the top 10 differentially expressed gene per transcriptional cluster. c) Heatmap representation of overlap coefficient calculated against a single-cell RNA sequencing CD8+ T cell atlas from patients with cancer,,,. d) Heatmap of the expression of hallmark genes from CD8+ T cell states across transcriptional clusters. e) Violin plot summary of gene signature expression of the conserved KIR signature, neoTCR8 signature, or published T cell exhaustion signatures,,,,,. f) Heatmap summarizing the clonal overlap between KIR+ and all other CD8+ T cell clusters.
Extended Data Fig. 9 |
Extended Data Fig. 9 |. Exploration of surface marker combinations based on Lasso Logistic classifier.
a) Decision Tree model to identify combinations of genes identified as predictive of circulating predicted-reactive CD8+ T cells by the Lasso Logistic classifier. b) Representative flow cytometry gating of surface marker combinations. The gating strategy was kept the same for each experimental batch. c) Kaplan-Meier plots of three-year overall survival based on the high (> median) or low (≤ median) expression of marker combinations in the flow cytometry cohort of patients with advanced melanoma (n = 47). Statistical significance was determined by Gehan-Breslow-Wilcoxon testing (P < 0.05).
Fig. 1 |
Fig. 1 |. Circulating tumor antigen reactive T cells in patients with advanced melanoma.
a, Design and analytical pipeline of 5′ droplet-based scRNA-seq with paired TCR sequencing experiment to identify tumor antigen reactive T cells. b, Uniform manifold approximation and projection (UMAP) dimensionality reduction plot of blood CD8+ T cells labeled with transcriptional clusters (left) or predicted tumor antigen reactivity (right). c, Heatmap displaying the top ten differentially expressed genes of circulating CD8+ T cells clonally related to predicted-reactive in the tumor (Matched reactive), predicted-unreactive in the tumor (Matched unreactive) and transcriptional clusters of all CD8+ T cells. d, Proportion of transcriptional phenotypes in blood-based CD8+ T cells based on predicted reactivity to tumor antigens. e, Histogram of the log-normalized proportion of the total T cell repertoire occupied by a given clonotype (expansion score) based on predicted tumor antigen reactivity. f, Violin plot of the TCR repertoire diversity for each predicted reactivity group, as quantified by the Shannon diversity index. Diversity metrics for each patient are represented by separate dots. Between-group differences are measured by Kruskal–Wallis one-way analysis of variance with Dunn’s multiple comparison testing (**q < 0.01, ****q < 0.001; Matched reactive versus Matched unreactive q = 0.0091; Matched reactive versus Blood only q < 0.0001; Matched unreactive versus Blood only q = 0.0013). Schematic in a created using BioRender.com.
Fig. 2 |
Fig. 2 |. KIR+CD8+ regulatory T cells are differentially abundant in circulating tumor antigen reactive CD8+ T cells.
a, UMAP dimensionality reduction plot of circulating CD8+ T cells labeled with differentially abundant predicted-reactive (Reactive-enriched) and predicted-unreactive (Unreactive-enriched) populations using local two-sample testing. b, Heatmap displaying the top 15 differentially expressed genes per differential abundance cluster. c, Heatmap displaying the expression of hallmark genes of human KIR+CD8+ Treg cells in each differentially abundant CD8+ T cell group. d, GSEA of the top 200 upregulated genes from human KIR+CD8+ Treg cells from patients with multiple sclerosis in the differentially abundant, circulating reactive-enriched CD8+ T cells. ES, enrichment score; NES, normalized ES; FDR, false discovery rate. e,f, Intracellular expression of the zinc finger protein Helios (Helios), T-box transcription factor TBX21 (T-bet), perforin, or IFNγ in circulating KIR+CD8+ or KIRCD8+ T cells from patients with advanced melanoma (n = 47) assessed by flow cytometry shown by representative histograms (e) or bar graph summary of the gMFI (f). Data are presented as mean values ± s.e.m. Between-group differences are measured by two-sided Wilcoxon matched-pairs signed-rank testing with Benjamini, Krieger and Yekutieli correction for multiple comparison testing (threshold q < 0.05, ***q = 0.000006, ****q < 0.000001). g, Representative contour plots showing CD137 expression in KIR T cells stimulated with tumor-associated antigen peptide (gp100, MAGE-A1, MAGE-A3, Melan-A) pools cultured with or without KIR+CD8+ T cells at day 2. h,i, Bar graphs summarizing the frequency of CD137+ T cells (h) or total CD8+ and CD4+ T cells (i) with or without KIR+CD8+ T cells on day 2 (n = 8). Between-group differences are measured by two-sided Wilcoxon matched-pairs signed-rank testing (NS, not significant; P < 0.05; **CD8+ P = 0.008; CD4+ P = 0.328).
Fig. 3 |
Fig. 3 |. Relationship between circulating and tumor KIR+CD8+ tumor antigen reactive T cells.
a, UMAP dimensionality reduction plot of tumor CD8+ T cells labeled with transcriptional clusters (top), clonal relation to circulating reactive-enriched (Matched reactive) or unreactive-enriched (Matched unreactive) CD8+ T cells (bottom left), or KIR+CD8+ T cells (bottom right). b, Heatmap of the expression of hallmark KIR+CD8+ Treg cell genes in tumor CD8+ T cells based on clonal relatedness to blood-based T cells. c, Volcano plot summarizing differentially expressed genes between KIR+CD8+ T cells in the tumor (right) or blood (left) as determined by two-sided Wilcoxon rank-sum testing with Bonferroni correction. FC, fold change. d, Violin plots summarizing the conserved KIR+CD8+ T cell gene signature. Between-group differences are measured by two-sided Wilcoxon signed-rank testing with continuity correction (q < 0.05, ****q < 0.0001). e,f, Scatterplots summarizing the correlation between the conserved KIR+CD8+ T cell gene signature (e) or the frequency of KIR+CD8+ T cells (f) in tumor (x axis) and blood (y axis) CD8+ T cells (two-sided Spearman’s rank correlation coefficient ρ, threshold P < 0.05). The simple linear regression line is plotted with the 95% CIs.
Fig. 4 |
Fig. 4 |. High-throughput epitope screening shows tumor antigen specificity in KIR+CD8+ T cell clonotypes.
a, Experimental design of epitope screening platform to identify TCR specificity using ten amino acid peptide sequences (10-mer) and major histocompatibility complex hybrid molecules (MCR1z). b, Table summarizing KIR+CD8+ T cell clonotype specificity from the MCR1z screen. c, Flow cytometry plots of responding MCR1z reporter cells (NFAT+) when co-cultured with 16.A2 cells carrying TCRs derived from KIR+CD8+ T cells or controls. d, Conserved KIR+CD8+ gene signature expression in tumor CD8+ T cells, grouped by KIR+CD8+ T cell clonotypes with demonstrated MCR1z reactivity (TCR2328, TCR2409, TCR2647), other KIR+CD8+ T cells, or KIRCD8+ T cells. Between-group differences are measured by two-sided Wilcoxon matched-pairs signed-rank testing (P < 0.05; ****P < 0.0001). Schematic in a created with BioRender.com.
Fig. 5 |
Fig. 5 |. Clinical relevance of tumor antigen reactive KIR+CD8+ T cells.
a, Table of clinical and surface protein-encoding genes selected by the Lasso Logistic model to classify circulating CD8+ T cells as tumor antigen reactive, KIR+CD8+ T cells (left). Receiver operating curves summarizing the predictive accuracy of the Lasso Logistic model classifier in the immunotherapy-naive (center) and immunotherapy resistant (right) scRNA-seq cohorts. b,c, Three-year OS based on a high (> median) or low (≤ median) frequency of tumor antigen reactive, KIR+CD8+ T cells identified using the Lasso Logistic model classifier in patients with advanced melanoma (n = 29) (b) and the subset of patients with disease progression following immunotherapy (n = 12, Immunotherapy resistant) (c). d, Three-year OS based on a high (> median) or low (≤ median) frequency of the tumor antigen reactive, KIR+CD8+ T cells in the flow cytometry cohort (n = 47). Between-group differences are measured by Gehan–Breslow–Wilcoxon test (P < 0.05). e, Frequency of KIR+CD8+ T cells in the blood of patients with advanced melanoma based on treatment history (Untreated, n = 18; Immunotherapy resistant, n = 29). Data are presented as mean values ± s.e.m. Between-group differences determined by two-sided Wilcoxon rank-sum testing (P = 0.05).

Update of

References

    1. Wolchok JD et al. Long-term outcomes with nivolumab plus ipilimumab or nivolumab alone versus ipilimumab in patients with advanced melanoma. J. Clin. Oncol. 40, 127–137 (2022). - PMC - PubMed
    1. Li J et al. KIR+CD8+ T cells suppress pathogenic T cells and are active in autoimmune diseases and COVID-19. Science 376, eabi9591 (2022). - PMC - PubMed
    1. Chakraborty S et al. Providence of the CD25+KIR+CD127FOXP3CD8+ T cell subset determines the dynamics of tumor immune surveillance. Immunol. Cell Biol. 96, 1035–1048 (2018). - PubMed
    1. Lowery FJ et al. Molecular signatures of antitumor neoantigen-reactive T cells from metastatic human cancers. Science 375, 877–884 (2022). - PMC - PubMed
    1. Oliveira G et al. Phenotype, specificity and avidity of antitumour CD8+ T cells in melanoma. Nature 596, 119–125 (2021). - PMC - PubMed