. 2025 Jan;17(1):129-168.
doi: 10.1038/s44321-024-00178-z. Epub 2024 Nov 28.

Bi-allelic variants in WDR47 cause a complex neurodevelopmental syndrome

Affiliations

Bi-allelic variants in WDR47 cause a complex neurodevelopmental syndrome

Efil Bayam et al. EMBO Mol Med. 2025 Jan.

Abstract

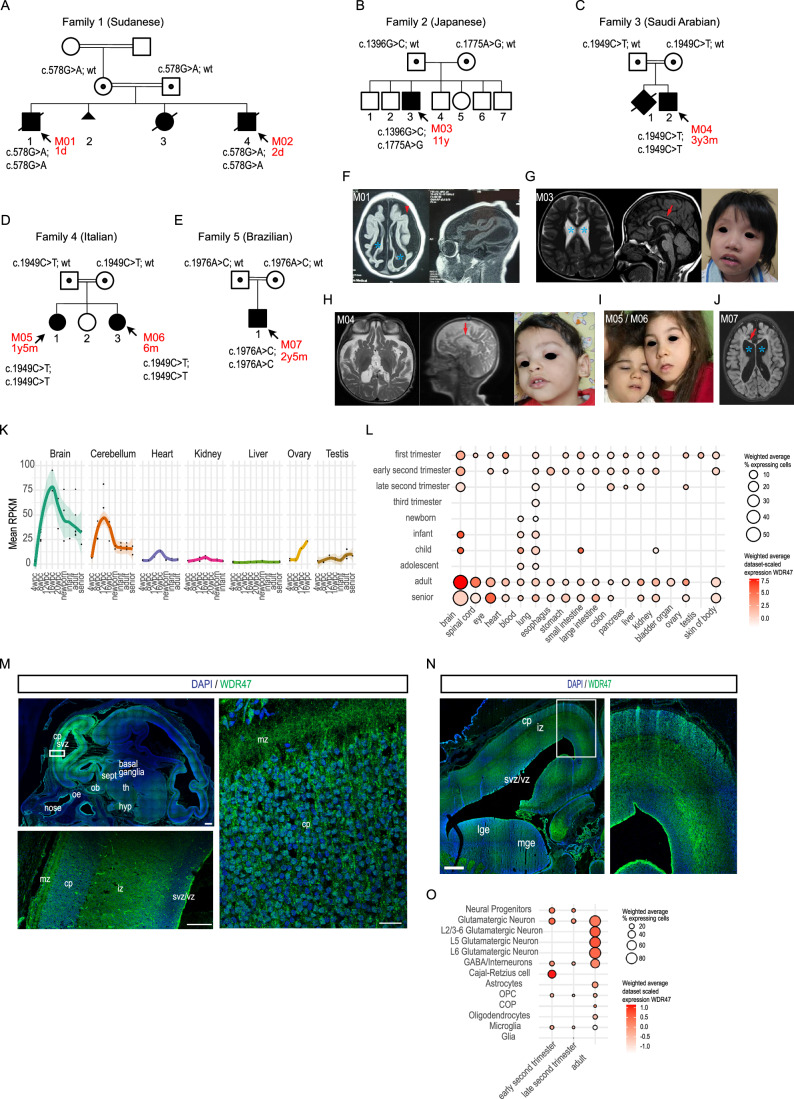
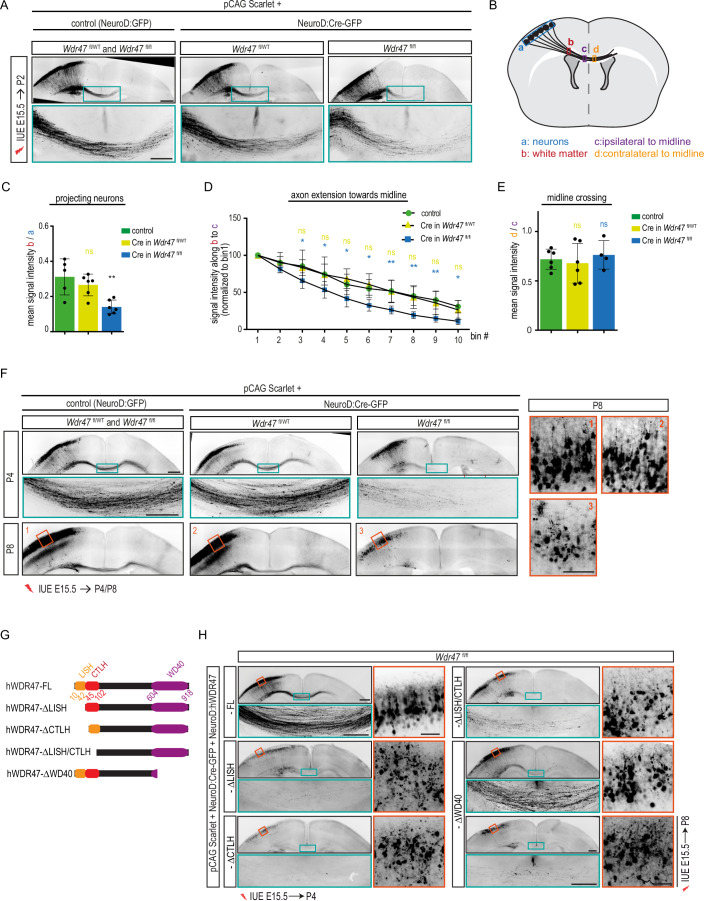
Brain development requires the coordinated growth of structures and cues that are essential for forming neural circuits and cognitive functions. The corpus callosum, the largest interhemispheric connection, is formed by the axons of callosal projection neurons through a series of tightly regulated cellular events, including neuronal specification, migration, axon extension and branching. Defects in any of those steps can lead to a range of disorders known as syndromic corpus callosum dysgenesis (CCD). We report five unrelated families carrying bi-allelic variants in WDR47 presenting with CCD together with other neuroanatomical phenotypes such as microcephaly and enlarged ventricles. Using in vitro and in vivo mouse models and complementation assays, we show that WDR47 is required for survival of callosal neurons by contributing to the maintenance of mitochondrial and microtubule homeostasis. We further propose that severity of the CCD phenotype is determined by the degree of the loss of function caused by the human variants. Taken together, we identify WDR47 as a causative gene of a new neurodevelopmental syndrome characterized by corpus callosum abnormalities and other neuroanatomical malformations.

Keywords: Callosal Neurons; Corpus Callosum Dysgenesis; Microtubule and Mitochondrial Homeostasis; Neurodevelopmental Disorder; WDR47.


Conflict of interest statement

Disclosure and competing interests statement. The authors declare no competing interests.

Figures

Figure 1
Figure 1. Clinical and brain imaging data from seven patients with WDR47 recessive loss-of-function variants.
(AE) Pedigrees showing the segregation of the identified WDR47 variants with the syndrome in consanguineous families (exception of Family 2). (FJ) Axial and sagittal T1 and T2-weighted brain MRI and facial features of patients with WDR47 variants. The red arrowhead indicates the simplified gyral pattern of the cortex, the blue stars show ventricular dilatations, and the red arrows point to thin corpus callosum. (K) Expression values of WDR47 as RPKM (Reads per kilo base per million mapped reads) throughout life for different organs in human. Dots represent average values for each replicate. Shaded regions represent standard deviation of distribution. Data from (Cardoso-Moreira et al, 2019). (L) Expression pattern of WDR47 in human across organs (x axis) and ages (y axis) showing prominent expression in the brain. Data obtained by multiple published dataset through https://cellxgene.cziscience.com (Abdulla et al, 2023). Color scale represents the weighted average expression across datasets and dot size represents the weighted average percentage of cells expressing WDR47. (MN) Images of (M) sagittal and (N) coronal human fetal brain sections immunostained with WDR47 antibody at GW14. Scale bars: 1 mm (upper left), 500 μm (lower left) and 40 μm (right). vz: ventricular zone, svz: subventricular zone, iz: intermediate zone, cp: cortical plate, mz: marginal zone, oe: olfactory epithelium, ob: olfactory bulb, lge: lateral ganglionic eminence, mge : medial ganglionic eminence, th: thalamus, hyp: hypothalamus, sept: septum. (O) Expression pattern of WDR47 across ages and selected cell types of the human cerebral cortex. Data obtained by multiple published dataset through https://cellxgene.cziscience.com (Abdulla et al, 2023). Color scale is as in (L). Source data are available online for this figure.
Figure 2
Figure 2. WDR47 missense variants affect the structure and stability of the WDR47 protein to various extent.
(A) Schematic representation of the human WDR47 (hWDR47) protein depicting the LISH, CTLH, and WD40 domains and the position of the mutated amino acids for M01&M02 (p.(Arg193His) (R193H)), M03 (p.(Asp466His)/p.(Lys592Arg) (D466H/L592R)), M04, M05, and M06 (p.(Pro650Leu) (P650L)) and M07 (p.(His659Pro) (H659P)). (B) Structural modeling of the human WDR47 (hWDR47) protein with an Alphafold2-derived atomic model. Homodimerization of the N-terminal featuring the LISH and CTLH domains is shown based on the crystal structure of mouse WDR47-NTD intertwined dimer. The position of the mutated amino acids for M01 & M02 (p.R193), M03 (p.D466) and (p.K592), M04, M05 and M06 (p.P650) and M07 (p.H659) and E205 residue that makes a salt bridge with the p.R193 are indicated. (C) Western blot analysis of extracts from N2A cells transfected with the indicated HA tagged hWDR47 constructs showed variable effect of variants on WDR47 protein levels. GFP was used as a transfection control. Dotted lines indicate where the membrane was cut. Data (means ± s.d.) from 5 independent cultures was analyzed by one-way ANOVA, with Bonferroni’s multiple comparison test. (D) MG132 treatment rescued the decreased levels of p.R193H variant suggesting proteasomal degradation of the mutant protein. Data (means ± s.d.) from 4 independent cultures was analyzed by two-way ANOVA, with Bonferroni’s multiple comparison test. (E, F) Western blot analysis showing that endogenous levels of WDR47 is (E) decreased in fibroblast extracts from patient M01 and (F) unchanged in lymphoblastoid cell extracts from patient M03. (E) Fibroblast and (F) lymphoblastoid cell lines from two and one healthy subjects were used, respectively, as controls. Data (means ± s.d.) from 3 cultures was analyzed by (E) one-way ANOVA, with Bonferroni’s multiple comparison test and (F) unpaired t-test. ns, non-significant; *P  <  0.05; **P  <  0.01; ***P  <  0.001; ****P  <  0.0001. Dotted lines indicate the position where the membrane was cut. Exact P values are listed in Dataset EV4. Source data are available online for this figure.
Figure 3
Figure 3. Neuroanatomical studies conducted in various mouse models reveal the neuronal origin of the observed defects.
(A) Top: Schematic representation of the 17 brain regions assessed at Bregma +2.19 mm and +3.51 mm in E18.5 Wdr47tm1a/tm1a mice (n = 5 WT vs n = 4 Wdr47tm1a/tm1a). Colored regions indicate the presence of at least one significant parameter within the brain region at the 0.05 level. White indicates a p-value > 0.05, gray shows not enough data to calculate a p-value. Bottom: Histograms of percentage change relative to matched WT animals (set as 0) for each of the measured parameters (listed in Dataset EV2 and on the right-hand side of the Figure). (B) Representative brain images stained with Nissl of embryonic WT and Wdr47tm1a/tm1a mice showing the internal capsule (ic) at Bregma +3.51 mm and the anterior part of the anterior commissure (aca) at Bregma +2.19 mm. Scale bars: 500 µm (top) and 250 µm (bottom). (C) Top: Schematic representation of the 17 brain regions assessed at Bregma +2.19 mm and +3.51 mm in E18.5 NexCre;Wdr47fl/fl mice (n = 6 WT vs n = 6 cKO). Colored regions indicate the presence of at least one significant parameter within the brain region at the 0.05 level. White indicates a p-value > 0.05, gray shows not enough data to calculate a p-value. Bottom: Barplots of percentage change relative to matched WT animals (set as 0) for each of the measured parameters. (D) Representative brain images stained with Nissl of embryonic WT and NexCre;Wdr47fl/fl embryonic mice showing the internal capsule (ic) at Bregma +3.51 mm and the anterior part of the anterior commissure (aca) at Bregma +2.19 mm. Scale bars: 500 µm (top) and 250 µm (bottom). (E) Top: Schematic representation of the 22 brain regions quantified at Lateral +0.72 mm on parasagittal section from adult Wdr47tm1a/tm1a mice, aged 16 weeks mice (n = 3 WT vs n = 3 Wdr47tm1a/tm1a). Colored regions indicate the presence of at least one significant parameter within the brain region at the 0.05 level. White indicates a p-value > 0.05, gray shows not enough data to calculate a p-value. Bottom: Histograms of percentage change relative to WT mice (set as 0) for each of the measured parameters (listed in Dataset EV2 and on the right-hand side of the Figure). (F) Top: Schematic representation of the 22 brain regions quantified at Lateral +0.72 mm on parasagittal section from adult CaMKIIαCre;Wdr47fl/fl at 16 weeks of age (n = 3 WT vs n = 2 cKO). Colored regions indicate the presence of at least one significant parameter within the brain region at the 0.05 level. White indicates a p-value > 0.05, gray shows not enough data to calculate a p-value. Bottom: Histograms of percentage change relative to WT mice (set as 0) for each of the measured parameters. (G) Representative brain images stained with Nissl-luxol of adult WT (left) and CaMKIIαCre;Wdr47fl/fl (right) mice showing the area of the corpus callosum and the height of the cortex at Lateral +0.72 mm. Scale bar: 1 mm. Source data are available online for this figure.
Figure 4
Figure 4. Deletion of Wdr47 impedes interhemispheric connectivity through impaired neuronal survival.
(A) Coronal sections of P2 mouse brains electroporated at E15.5 with pCAG:Scarlet plasmid together with either a control (NeuroD:Ires:GFP) or a NeuroD:Cre-GFP vector. Scarlet positive electroporated neurons are depicted in black. Close-up views of the green boxed area show axon extension defects in Wdr47fl/fl pups but not in Wdr47fl/WT pups or control conditions. Scale bars: 500 µm and 200 µm (green boxed inset). (B) Schematic describing the methods used to quantify (C) the percentage of projecting neurons (mean intensity of the scarlet signal in the white matter (red box) normalized on the mean intensity in the cortical plate (blue box)), (D) axon extension towards midline (intensity was plotted along a line that was divided into 10 equal bins from the immediate start of CC (red box) till the midline (purple box); intensity in bin1 was considered 100% and intensity in each bin was normalized to bin1) and (E) midline crossing (mean intensity of the scarlet signal just after the midline (yellow box) is normalized on the mean intensity just before midline crossing (purple box)). (CE) Quantification of (C) projecting neurons, (D) axon extension towards midline, and (E) midline crossing. Data (means ± s.d.) from at least 4 pups from 2 to 3 different litters per condition were analyzed by (C, E) one-way ANOVA, with Bonferroni’s multiple comparison test, or (D) two-way ANOVA, with Bonferroni’s multiple comparison test. (F) Coronal sections of P4 and P8 mouse brains electroporated at E15.5 with pCAG:Scarlet plasmid together with either a control (NeuroD:Ires:GFP) or a NeuroD:Cre-GFP vector. Scarlet positive electroporated neurons are depicted in black. Close-up views of the green and orange boxed area show loss of CC at P4 and loss of neuronal morphology at P8, respectively, in Wdr47fl/fl pups but not in Wdr47fl/WT pups or control conditions. At least 4 pups from 2 to 3 different litters per condition was analyzed. Scale bars: 500 µm, 200 µm (blue boxed inset) and 100 µm (red boxed inset). (G) Schematic representation of the WDR47 protein depicting different domains and the truncated Wdr47 constructs used in (H) to rescue the phenotype induced by the loss of Wdr47. (H) Coronal sections of P4 and P8 mouse brains electroporated at E15.5 with pCAG:Scarlet plasmid and NeuroD:Cre-GFP vector together with a truncated hWDR47 construct. Scarlet positive electroporated neurons are depicted in black. Close-up views of the green and orange boxed area show that at P4 ∆LISH, ∆CTLH, and ∆LISH/CTLH fail to rescue the loss of CC and neuronal morphology while ∆WD40 construct could partially restore the survival defects. Scale bars: 500 µm, 200 µm (blue boxed inset) and 50 µm (red boxed inset). ns, non-significant, *P  <  0.05, **P  <  0.01. Exact P values are listed in Dataset EV4. Source data are available online for this figure.
Figure 5
Figure 5. Function of WDR47 in neuronal survival is independent from its function in neuronal migration and axon extension.
(A) Coronal sections of E18.5 mouse cortices, four days after in utero electroporation with NeuroD-Cre-GFP together with either NeuroD:empty vector or a different rescue vector (either NeuroD:hWDR47-FL or a truncated NeuroD:hWDR47 construct or NeuroD:Camsap3). GFP-positive electroporated cells are depicted in green. Nuclei are stained with DAPI. Scale bar: 100 µm. (B, C) Analysis of the percentage of electroporated GFP-cells in different regions (uCP, lCP, IZ, and VZ/SVZ) showing effect of introducing (B) different truncated Wdr47 constructs and (C) Camsap3 on neuronal migration. Data (means ± s.d.) from at least three embryos from 2 to 3 different litters per condition was analyzed by two-way ANOVA, with Bonferroni’s multiple comparisons test. uCP, Upper cortical plate; lCP, Lower cortical plate; IZ, intermediate zone; VZ, ventricular zone; SVZ, subventricular zone. (D) Coronal sections of P2, P4, and P8 mouse brains electroporated at E15.5 with pCAG:Scarlet, NeuroD:Cre-GFP and NeuroD:Camsap3 plasmids. Scarlet positive electroporated neurons are depicted in black. Close-up views of the green boxed area show that axon extension defects are rescued upon introduction of Camsap3 at P2, however, CC is still lost at P8. Scale bars: 500 µm and 200 µm (green boxed inset). (E, F) Quantification of (E) projecting neurons and (F) axon extension towards midline. Data (means ± s.d.) from at least 5 pups per condition were analyzed by (E) one-way ANOVA, with Bonferroni’s multiple comparison test, (F) two-way ANOVA, with Bonferroni’s multiple comparison test. ns, non-significant; *P  <  0.05; **P  <  0.01; ***P  <  0.001; ****P  <  0.0001. Exact P values are listed in Dataset EV4. Source data are available online for this figure.
Figure 6
Figure 6. Wdr47 deficient neurons die via apoptosis.
(A) Left panel: Schematic of the viability analysis in primary neuronal cultures. Right panel: Fluorescence imaging depicting single scarlet positive neurons (in black) that were followed from DIV3 to DIV10 in primary cultures obtained from WT and HOM (Wdr47tm1b/tm1b) embryos. Red rectangle indicates the time of neuronal death. Scale bar: 50 µm. (B, C) Neuronal survival in vitro in WT and HOM (Wdr47tm1b/tm1b) primary neuronal cultures upon treatment with different drugs. (B) Representative fields, at DIV3 and DIV10, of neuronal cultures treated with DMSO, Qvd-OPh (Caspase inhibitor), Ferrostatin (ferroptosis inhibitor), and Necrostatin (Necroptosis inhibitor) at DIV2. Scarlet positive electroporated neurons are depicted in black. Yellow arrows correspond to neurons that died, red arrowheads correspond to neurons that are alive and could be followed from DIV3 to DIV10. Scale bar: 200 µm. (C) Survival of neurons from DIV3 to DIV10 upon different drug treatments. Data (means ± s.d.) from at least 3 independent cultures per condition was analyzed by two-way ANOVA, with Bonferroni’s multiple comparison test, ns, non-significant, *P  <  0.05, ***P  <  0.001, ****P  <  0.0001. Exact P values are listed in Dataset EV4. Source data are available online for this figure.
Figure 7
Figure 7. Wdr47 deficient neurons present neurodegenerative hallmarks with altered mitochondrial and microtubule homeostasis.
(A) Volcano plot showing the negative log10 adjusted P-value (p-adj) of all genes against their log2 fold change (log2FC) (Wdr47tm1b/tm1b versus WT neurons). Upregulated and downregulated genes (p-adj < 0.05) are in orange and blue, respectively, and the neurodegeneration-related genes selected for validation of RNA-seq results are labeled in red. Data from DIV6 cultures of 2 WT and 3 HOM E15.5 embryos were analyzed using Wald test with p-values adjusted for multiple testing using the Benjamini and Hochberg method. (B) GO term analysis of downregulated genes in DIV6 neurons in Wdr47tm1b/tm1b versus WT. The size of the circle represents the number of genes enriched in the GO term and the color of the circles represents the −log10 (qvalue). (C) Disease Ontology analysis of dysregulated genes in DIV6 neurons in Wdr47tm1b/tm1b versus WT. Diseases enriched among upregulated and downregulated genes are depicted in yellow and blue, respectively. Dashed line indicates qvalue equal to 0.05. (D) RT-qPCR validation of RNA-seq results for 11 downregulated genes associated to neurodegenerative diseases. Data (means ± s.d.) from at least 3 independent cultures per condition was analyzed by unpaired t-test. (EG) Assessment of mitochondria in axons of WT and HOM (Wdr47tm1b/tm1b) DIV6 cortical neurons magnetofected with pCAG-GFP and mito-dsred. (E) Live-cell confocal imaging of individual mitochondria (red) in single axons (green) of WT and HOM (Wdr47tm1b/tm1b) DIV6 cortical neurons. Scale bar: 5 µm. (F) Number of mitochondria per 100 µm of axon in DIV6 cortical neurons (n > 90 axons per condition). Data (means ± s.d.) from 5 independent cultures per condition was analyzed by unpaired t-test with Welch’s correction. (G) Quantitative assessment of mitochondrial morphology (Feret’s diameter) in axons of DIV6 cortical neurons (n > 400 mitochondria per condition). Data (means ± s.d.) from 5 independent cultures per condition was analyzed by two-way ANOVA. (H) Mitochondrial membrane potential (ΔΨm) (TMRE intensity) of individual mitochondria in the neurites of WT and HOM (Wdr47tm1b/tm1b) DIV6 cortical neurons (n > 3500 mitochondria per condition). Data from at least 3 independent cultures was analyzed by Mann Whitney test. (I) Redox potential (mito-Grx1-roGFP2) of mitochondria in the neurites of WT and HOM (Wdr47tm1b/tm1b) DIV6 cortical neurons (n > 50 neurites per condition). Data (means ± s.d.) from 3 independent cultures per condition was analyzed by unpaired t-test with Welch correction. (JM) Neurons were magnetofected at DIV4 with (J, K) mito-Dsred and (L, M) Lamp1-YFP to analyze mitochondria and lysosome motility, respectively, by videomicroscopy. Kymographs illustrate the motility of (J) mitochondria and (L) lysosomes in time (y, sec) and space (x, µm). Histograms represent the percentage of stationary (K) mitochondria (n > 60 axons per condition from 5 independent cultures) and (M) lysosomes (n = 30 axons per condition from 4 independent cultures). Data (means ± s.d.) was analyzed by unpaired t-test. (N) Western blot analysis shows decreased levels of acetylated tubulin in DIV6 HOM (Wdr47tm1b/tm1b) primary neurons compared to WT. Data (means ± s.d.) from 3 independent cultures was analyzed by unpaired t-test. (O, P) Neuronal survival in vitro in WT and HOM (Wdr47tm1b/tm1b) primary neuronal cultures upon treatment with MT stabilizer EpoD. (O) Representative fields, at DIV3 and DIV10, of neuronal cultures treated with DMSO EpoD at DIV2. Scarlet positive electroporated neurons are depicted in black. Yellow arrows correspond to neurons that died, red arrowheads correspond to neurons that are alive and could be followed from DIV3 to DIV10. The images shown for the DMSO condition are identical to those presented in Fig. 6B. Scale bar: 200 µm. (P) Survival of neurons from DIV3 to DIV10 upon treatment with DMSO and EpoD (10 nM). Data (means ± s.d.) from at least 3 independent cultures per condition was analyzed by two-way ANOVA, with Bonferroni’s multiple comparison test. ns, non-significant, *P  <  0.05, **P < 0.01, ***P  <  0.001, ****P  <  0.0001. Exact P values are listed in Dataset EV4. Source data are available online for this figure.
Figure 8
Figure 8. Different WDR47 variants impede neuronal migration and interhemispheric connectivity to varying degrees.
(A) Coronal sections of E18.5 mouse cortices, four days after in utero electroporation with NeuroD-Cre-GFP together with NeuroD:empty vector or FL or mutant NeuroD:hWDR47 constructs. GFP-positive electroporated cells are depicted in green. Nuclei are stained with DAPI. Scale bar: 100 µm. (B) Analysis of the percentage of electroporated GFP-cells in different regions (uCP, lCP, IZ, and VZ/SVZ) showing the ability of the WDR47 constructs carrying one of the different variants found in patients to rescue neuronal migration. Data (means ± s.d.) from at least five embryos from 2 to 4 different litters per condition was analyzed by two-way ANOVA, with Bonferroni’s multiple comparisons test. uCP, Upper cortical plate; lCP, Lower cortical plate; IZ, intermediate zone; VZ, ventricular zone; SVZ, subventricular zone. (C) Coronal sections of P21 mouse brains electroporated at E15.5 with pCAG:Scarlet plasmid together with either a control plasmid or a NeuroD:Cre-GFP plasmid and a rescue construct (either a NeuroD: hWDR47-WT or a NeuroD:hWDR47 carrying one of the human mutations). Scarlet positive electroporated neurons are depicted in black. Close-up views of the green boxed area show that different constructs have different effects on rescue of CC phenotypes. Close-up views of the red boxed areas show bipolar morphology of the neurons in the cortical plate. Scale bars: 500 µm, 100 µm (green and red boxed insets). (D) Schematic describing the methods used to quantify (E) the CC thickness (mean intensity of the scarlet signal in the CC (red box) normalized on the mean intensity in the cortical plate (blue box)). (E) CC thickness upon introduction of different WDR47 mutated constructs. Data (means ± s.d.) from at least 5 pups from 2 to 3 different litters per condition were analyzed by one-way ANOVA, with Bonferroni’s multiple comparison test, ns, non-significant, *P  <  0.05; **P < 0.01; ***P < 0.001; ****P < 0.0001. Exact P values are listed in Dataset EV4. Source data are available online for this figure.
Figure EV1
Figure EV1. Pattern of expression of mouse Wdr47.
(A) Expression values of Wdr47 as RPKM (Reads per kilo base per million mapped reads) throughout life for different organs in mouse. Dots represent average values for each replicate. Shaded regions represent standard deviation of distribution. Data from (Cardoso-Moreira et al, 2019). (B) Expression pattern of Wdr47 in mice across organs (x axis) and ages (y axis) showing prominent expression in the brain. Data obtained by multiple published dataset through https://cellxgene.cziscience.com (Abdulla et al, 2023). Color scale represents the weighted average expression across datasets and dot size represents the weighted average percentage of cells expressing Wdr47. (C) Coronal sections of E18.5 WT and HOM (Wdr47tm1b/tm1b) mouse brains immunostained with WDR47 and L1 antibodies show expression of WDR47 in the cortex with enrichment in fiber tracks. Asterisk depicted unspecific staining. Scale bars: 360 µm and 60 µm (insets).
Figure EV2
Figure EV2. Loss of Wdr47 induces massive neuronal death at early postnatal stages.
(A, B) Coronal sections of P2, P3, and P4 mouse brains electroporated at E15.5 with pCAG:Scarlet plasmid together with either a control (NeuroD:Ires:GFP) or a NeuroD:Cre-GFP vector. Scarlet positive electroporated neurons are depicted in red. (A) While Wdr47fl/WT neurons and neurons in control conditions keep a proper morphology, Wdr47fl/fl neurons lose their bipolar morphology from P3 on. In close-up views of the white boxed area, nucleus is counterstained with DAPI and arrowheads point to pyknotic nuclei. Scale bars: 50 µm and 20 µm (insets). (B) Coronal sections are immunolabelled for activated Caspase3 (aCasp3) (white). Several aCasp3+ cells appear at P3 and P4 in Wdr47fl/fl condition. Scale bar: 100 µm. (C) Western blot analysis of extracts from HEK cells transfected with the indicated HA tagged hWDR47 truncated constructs. Gapdh is used as the loading control. Data (means ± s.d.) from at least 3 independent experiments were analyzed by one-way ANOVA, with Bonferroni’s multiple comparisons test. **P < 0.01. Note that ∆WD40 construct is expressed about 10 times more than the other constructs. (D) Effect of different rescue constructs on CC and neuronal survival in control conditions. Coronal sections of P4 Wdr47fl/WT mouse brains electroporated at E15.5 with pCAG:Scarlet and NeuroD:Cre-GFP plasmids together with a truncated WDR47 construct. Scarlet positive electroporated neurons are depicted in black. Close-up views of the green and orange boxed area show no effect of the construct on the CC and neuronal survival. Data from at least 3 independent experiments. Scale bars: 500 µm, 200 µm (green boxed inset) and 50 µm (red boxed inset). Exact P values are listed in Dataset EV4.
Figure EV3
Figure EV3. Effect of different rescue constructs on neuronal migration in control conditions.
(A) Transmission light micrographs of an in vitro 36-h neuronal migration assay performed on Mitomycin-treated fibroblast lines obtained from two healthy subjects and patient M01. The dashed red lines show the edge of the wound. Scale bar: 500 μm. (B) Percentage of wound closure is shown over time in M01-derived fibroblasts compared to control lines. Data (means ± s.d.) from at least 18 wells per condition was analyzed by two-way ANOVA, with Bonferroni’s multiple comparison test, ns, non-significant, ****P < 0.0001. (C) Coronal sections of E18.5 Wdr47fl/WT mouse cortices 4 days after in utero electroporation with NeuroD-Cre-GFP together with a different NeuroD construct used for rescue experiments. GFP-positive electroporated cells are depicted in green. Nuclei are stained with DAPI. The representative image of NeuroD:GFP (empty) electroporation in Wdr47fl/WT embryo is identical to the one shown in Fig. 5A. Scale bar: 100 µm. (D) Analysis of the percentage of electroporated GFP-cells in different regions (uCP, lCP, IZ, and VZ/SVZ) show that apart from the mild effect of ∆WD40 domain construct, none of the constructs have an effect on neuronal migration in control conditions. Data (means ± s.d.) from at least three embryos per condition were analyzed by two-way ANOVA, with Bonferroni’s multiple comparisons test, ns, non-significant; *P  <  0.05. uCP, Upper cortical plate; lCP, Lower cortical plate; IZ, intermediate zone; VZ, ventricular zone; SVZ, subventricular zone. (E) Top: Representative brain image stained with Nissl-luxol of adult male WT and Camsap3 KO mice showing the soma of the corpus callosum at Bregma −1.34 mm. Bottom: Box plot showing the combined size of the lateral fibers (lat) of the corpus callosum with the hippocampal commissure in 3 male Camsap3−/− and 24 matched baseline WT mice of 16 weeks of age bred on a pure genetic background C57BL/6N. The line in the middle represents the median, the upper limit of the box corresponds to Q3, the lower limit to Q1, and the whiskers extend to 1.5× interquartile range. Scale bar: 0.05 cm. Data (means ± s.d.) was analyzed by two-tailed Student’s t-tests of equal variances. ns, non-significant; **P  <  0.01. cg, cingulate bundle; dhc, dorsal hippocampal commissure; lat, lateral fibers; med, medial fibers. Exact P values are listed in Dataset EV4.
Figure EV4
Figure EV4. Loss of Wdr47 in neurons does not impair intracellular transport or pool of dynamic microtubules.
(A) RT-qPCR using extracts from DIV4 primary cortical neurons, for the 11 genes that were validated to be differently expressed at DIV6. Data (means ± s.d.) from at least 3 independent cultures per condition was analyzed by unpaired t-test. ns, non-significant. (B) Mitochondrial mass and (C) mitochondrial membrane potential quantified using flow cytometry in WT and WDR47 KO HeLa cells. Data (means ± s.d.) from 9 independent experiments was analyzed by unpaired t-test, ***P < 0.001, ****P < 0.0001. (D, E) Histograms represent mean anterograde and retrograde velocities of (D) mitochondria (anterograde velocity: n = 77 for WT and n = 36 for HOM; retrograde velocity: n = 130 for WT and n = 88 for HOM) and (E) lysosomes (anterograde velocity: n = 216 for WT and n = 116 for HOM; retrograde velocity: n = 408 for WT and n = 173 for HOM). Data (means ± SEM) from at least 3 independent cultures per condition was analyzed by unpaired t-test with Welch correction, ns, non-significant, *P  <  0.05. (F) Kymographs illustrating the motility of lysosomes (Lysotracker) in control and mutant fibroblast in time (y, sec) and space (x, µm). Histograms representing the percentage of stationary lysosomes. Lysosomes from n = 39 and n = 23 cells were analyzed for control lines and fibroblasts derived from MO1, respectively, and data (means ± s.d.) was analyzed by unpaired t-test, ***P < 0.001. (G) LAMP1 immunostainings showing increased clustering of lysosomes around the nucleus in WDR47-KO HeLa cells compared to WT control HeLa cells. Cells were transfected with GFP to label their cytoplasm. Scale bar: 10 µm. n = 7138 and n = 8447 lysosomes from 94 WT and WDR47-KO HeLa cells was analyzed, respectively, by nested mixed effect model. Box plot: center line: median; box limits: 1st and 3rd quartiles; whiskers: +/−1.5× interquartile range. *P  <  0.05. (H) Western blot analysis showing unchanged levels of alpha tubulin (α-tub) and tyrosinated alpha tubulin (tyr-α-tub) in DIV6 HOM (Wdr47tm1b/tm1b) primary neurons compared to WT. Actin was used as loading control. Data (means ± s.d.) from 3 independent cultures was analyzed by unpaired t-test. (I, J) Western blot analysis showing decreased levels of acetylated tubulin (ac-α-tub) and unchanged levels of alpha tubulin (α-tub) in (I) WDR47 KO HeLa cells compared to WT HeLa cells and (J) fibroblasts derived from M01 compared to fibroblasts derived from healthy individuals. GAPDH was used as loading control. Data (means ± s.d.) from 3 to 4 independent cultures was analyzed by unpaired t-test, ns, non-significant, **P < 0.01; ***P < 0.001. (K) Representative images of human primary fibroblasts categorized as organized, partially disorganized and disorganized depending on the nucleation pattern of microtubules after 30 min of depolymerization followed by 2 min of repolymerization. Percentage of cells in each category is shown in M01-derived fibroblasts compared to control lines. >50 cells were analyzed for each culture and data (means ± s.d.) from 3 cultures was analyzed by two-way ANOVA, with Bonferroni’s multiple comparison test, ns, non-significant; ****P < 0.0001. (L) Effect of EpoD on WT cultures. (Right) Representative fields, at DIV3 and DIV10, of WT neuronal cultures treated with EpoD at DIV2. Scarlet positive electroporated neurons are depicted in black. Yellow arrows correspond to neurons that died, red arrowheads correspond to neurons that are alive and could be followed from DIV3 to DIV10. (Left) Survival of WT neurons from DIV3 to DIV10 upon treatment with DMSO and EpoD. Data (means ± s.d.) from at least 3 cultures per condition was analyzed by two-way ANOVA, with Bonferroni’s multiple comparison test. ns, non-significant. Exact P values are listed in Dataset EV4.
Figure EV5
Figure EV5. Effect of wild-type and mutant hWDR47 constructs on CC and neuronal survival in control conditions.
(A) Coronal sections of E18.5 Wdr47fl/WT mouse cortices, 4 days after in utero electroporation with NeuroD-Cre-GFP together with an empty (NeuroD:GFP) or wild type (WT) or mutant NeuroD:WDR47 constructs. GFP-positive electroporated cells are depicted in green. Nuclei are stained with DAPI. Scale bar: 100 µm. (B) Analysis of the percentage of electroporated GFP-cells in different regions (uCP, lCP, IZ, and VZ/SVZ) showing a mild effect of overexpression of some mutant WDR47 in the upper cortical plate (uCP). Data (means ± s.d.) from at least five embryos from 2 to 4 different litters per condition was analyzed by two-way ANOVA, with Bonferroni’s multiple comparisons test. uCP, Upper cortical plate; lCP, Lower cortical plate; IZ, intermediate zone; VZ, ventricular zone; SVZ, subventricular zone. (C) Coronal sections of P21 Wdr47fl/WT mouse brains electroporated at E15.5 with pCAG:Scarlet and NeuroD:Cre-GFP plasmids and together with either an empty (NeuroD:GFP) or a NeuroD:WDR47 construct with or without the human mutation. Scarlet positive electroporated neurons are depicted in black. Close-up views of the green boxed and red boxed areas show that none of the constructs have an effect on CC or neuronal morphology. Scale bars: 500 µm, 100 µm (green and red boxed insets). (D) CC thickness upon introduction of different hWDR47 constructs. Data (means ± s.d.) from at least 5 pups per condition were analyzed by one-way ANOVA, with Bonferroni’s multiple comparison test. ns, non-significant; *P  <  0.05; ***P < 0.001; ****P < 0.0001. Exact P values are listed in Dataset EV4.

References

    1. Abdulla S, Aevermann B, Assis P, Badajoz S, Bell SM, Bezzi E, Cakir B, Chaffer J, Chambers S, Michael Cherry J et al (2023) CZ CELL×GENE Discover: a single-cell data platform for scalable exploration, analysis and modeling of aggregated data. Preprint at 10.1101/2023.10.30.563174 - PMC - PubMed
    1. Accogli A, Shakya S, Yang T, Insinna C, Kim SY, Bell D, Butov KR, Severino M, Niceta M, Scala M et al (2024) Variants in the WDR44 WD40-repeat domain cause a spectrum of ciliopathy by impairing ciliogenesis initiation. Nat Commun 15:365 - PMC - PubMed
    1. Alberti S, Gitler AD, Lindquist S (2007) A suite of Gateway cloning vectors for high-throughput genetic analysis in Saccharomyces cerevisiae. Yeast 24:913–919 - PMC - PubMed
    1. Alkuraya FS (2013) The application of next-generation sequencing in the autozygosity mapping of human recessive diseases. Hum Genet 132:1197–1211 - PubMed
    1. Anazi S, Maddirevula S, Faqeih E, Alsedairy H, Alzahrani F, Shamseldin HE, Patel N, Hashem M, Ibrahim N, Abdulwahab F et al (2017) Clinical genomics expands the morbid genome of intellectual disability and offers a high diagnostic yield. Mol Psychiatry 22:615–624 - PubMed

LinkOut - more resources