. 2025 Jan;26(1):218-244.
doi: 10.1038/s44319-024-00323-2. Epub 2024 Nov 28.

The TGF-β mimic TGM4 achieves cell specificity through combinatorial surface co-receptor binding

Affiliations

The TGF-β mimic TGM4 achieves cell specificity through combinatorial surface co-receptor binding

Shashi P Singh et al. EMBO Rep. 2025 Jan.

Abstract

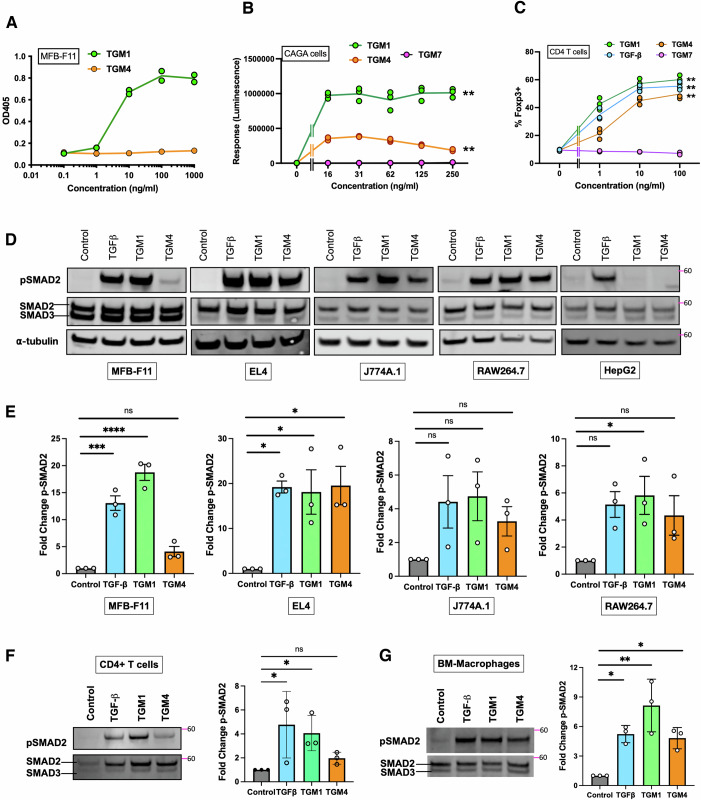
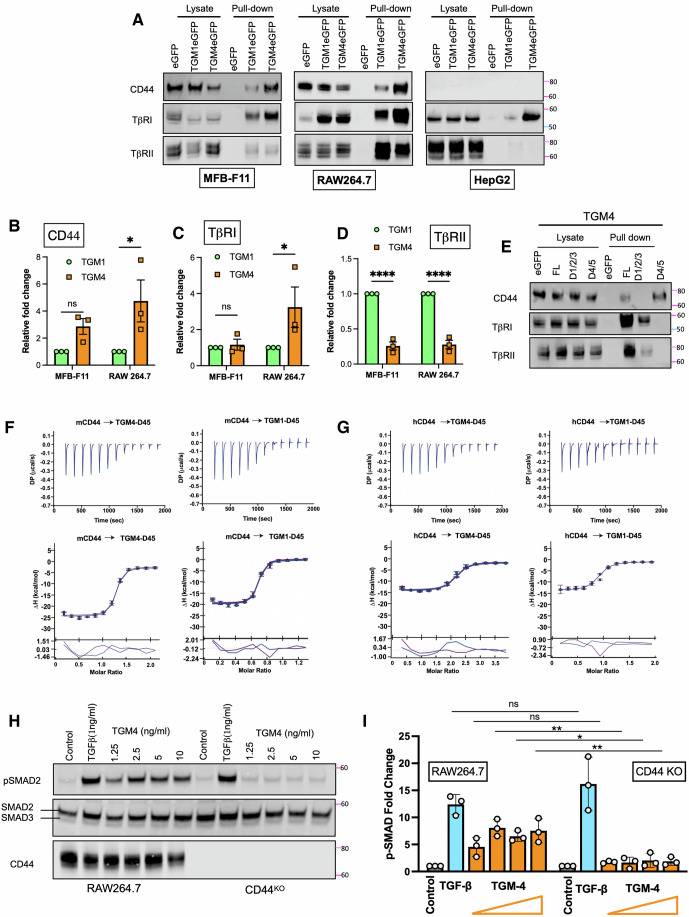
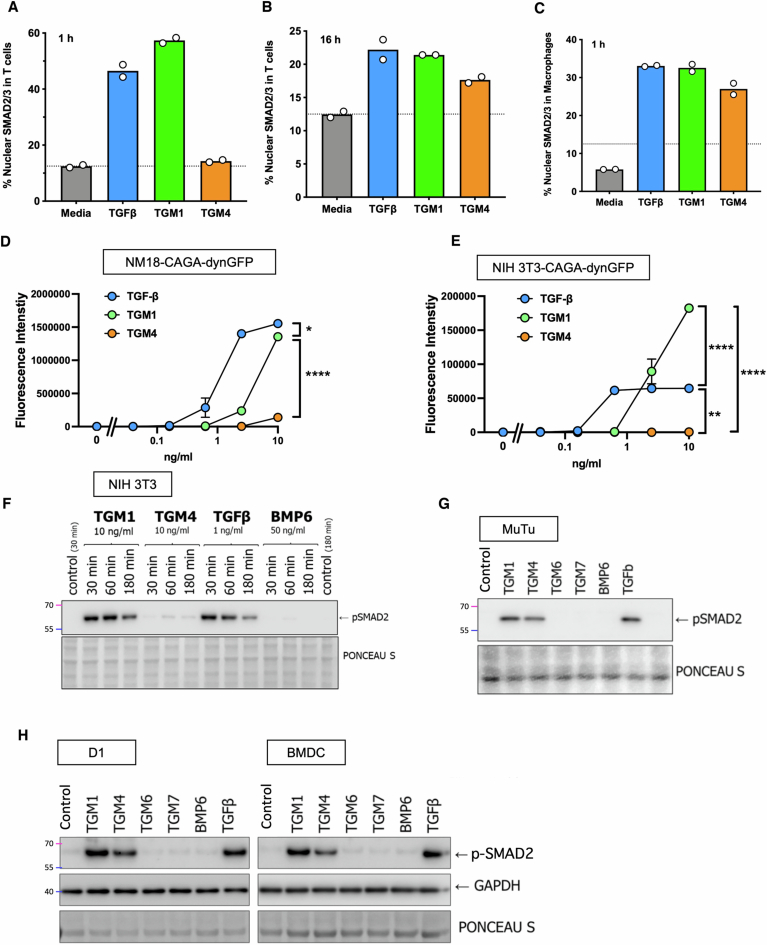
The immunoregulatory cytokine TGF-β is pleiotropic due to the near-ubiquitous expression of the TGF-β receptors TβRI and TβRII on diverse cell types. The helminth parasite Heligmosomoides polygyrus has convergently evolved a family of TGF-β mimics (TGMs) that bind both these receptors through domains 1-3 of a 5-domain protein. One member of this family, TGM4, differs from TGF-β in acting in a cell-specific manner, failing to stimulate fibroblasts, but activating SMAD phosphorylation in macrophages. Primarily through domains 4 and 5, TGM4 interacts with multiple co-receptors, including CD44, CD49d (integrin α4) and CD206, and can up- and downmodulate macrophage responses to IL-4 and lipopolysaccharide (LPS), respectively. The dependence of TGM4 on combinatorial interactions with co-receptors is due to a moderated affinity for TβRII that is more than 100-fold lower than for TGF-β. Thus the parasite has elaborated TGF-β receptor interactions to establish cell specificity through combinatorial cis-signalling, an innovation absent from the mammalian cytokine.

Keywords: Agonist; Antagonist; Cytokine; Helminth; Receptor.


Conflict of interest statement

Disclosure and competing interests statement. The authors declare no competing interests.

Figures

Figure 1
Figure 1. Differential activation of fibroblasts, T cells and macrophages by TGM4.
(A) Response of MFB-F11 reporter fibroblasts to recombinant TGM1 and TGM4 proteins, measured by an enzymatic assay (OD405 nm) for release of alkaline phosphatase. Data shown are from 1 of 4 biological replicate experiments with similar results (n = 2). (B) Response of CAGA12 luciferase reporters to TGM1 and TGM4; a more distantly related family member, TGM7, is included as a negative control. Data shown are from 1 of 2 biological replicate experiments with similar results; mean ± SD (n = 3). (C) Induction of Foxp3 expression in mouse splenic CD4+ T cells incubated with TGM1, TGM4, TGM7 or TGF-β. Data shown are from 1 of 2 biological replicate experiments with similar results (n = 3); mean ± SD. (D) SMAD2 phosphorylation in cell lines of MFB-F11 fibroblasts, EL4 T lymphocytes, J774A.1 RAW264.7 macrophages, and HepG2 cells stimulated with TGF-β, TGM1 and TGM4, measured by western blotting; upper row probed with anti-pSMAD2; lower row with anti-SMAD2/3 antibody. Images are from 1 of 3 biological replicate experiments. (E) Densitometric analyses of SMAD2 phosphorylation, as in (E), from all three biological replicate experiments, showing means ± SD. (F) SMAD2 phosphorylation in primary splenic CD4+ T cells, assessed as in (D, E), by western blot in 1 of 3 biological replicate experiments (left panel) and by densitometric analyses of all three experiments (right panel), showing means ± SD. (G) SMAD2 phosphorylation in bone marrow-derived macrophages, assessed as in (D, E), by western blot in 1 of 3 biological replicate experiments (left panel) and by densitometric analyses of all three experiments (right panel), showing means ± SD. Data Information: Data in (B) analysed by two-way ANOVA with Tukey’s correction; at 250 µg/ml, TGM1 vs TGM4 P = 0.0021; TGM1 vs TGM7 P = 0.0014; TGM4 vs TGM7 P = 0.0029. Data in (C) analysed by two-way ANOVA with Tukey’s correction; at 100 µg/ml TGM1 vs TGM4 P = 0.0937; TGM1 vs TGM7 P = 0.0011; TGM4 vs TGM7 P = 0.0064; TGF-β vs TGM7 P = 0.0011. (EG) Analysed by one-way ANOVA with Dunnett’s multiple comparison tests. In (E), for MFB-F11 Control vs TGF-β P = 0.0002, Control vs TGM1 P < 0.0001; for EL4, Control vs TGF-β P = 0.011, Control vs TGM1 P = 0.0169 and for Control vs TGM4 P = 0.0121; for RAW264.7, Control vs TGM1 P = 0.0392. (F) Control vs TGF-β P = 0.0364, Control vs TGM1 P = 0.0499. In (G), Control vs TGF-β P = 0.0222, Control vs TGM1 P = 0.0011 and for Control vs TGM4 P = 0.0360. In all panels, ns = not significant, *P < 0.05, **P < 0.01, ***P < 0.001, ****P < 0.0001.
Figure 2
Figure 2. TGM4 domain and receptor binding analysis.
(A, B) SMAD2 phosphorylation induced by D1-3 by both TGM1 and TGM4 when added to MFB-F11 fibroblasts (A) or RAW264.7 macrophage cell line (B). Serum-starved cells were incubated with conditioned medium from eGFP alone, TGM4 D1-5, D1-3 or D4–5 transfected cells for 1 h and analysed for pSMAD2 and SMAD2/3 by western blotting. Images are from 1 of 3 biological replicate experiments. (C) TβRI GFP-TRAP pulldown from MFB-F11 cells transfected with eGFP alone, or eGFP fused to TGM1, TGM4 or TGM7. (C) Whole-cell lysates shown on left-hand side of image, and anti-GFP immunoprecipitates (pulldowns) shown on right hand side, following western blot with anti-TβRI antibody. Image is from 1 of 3 biological replicate experiments. (D) Densitometric analyses of TβRI pulldowns, as in (C), from all three biological replicate experiments. Data shown as mean ± SD. (E) TβRII GFP-TRAP pulldown from MFB-F11 cells transfected with eGFP alone, or eGFP fused to TGM1, TGM4 or TGM7, as in (C). The image is from 1 of 3 biological replication experiments. (F) Densitometric analyses of TβRII pulldowns, as in (E), from all three biological replicate experiments. Data shown as mean ± SD and analysed by unpaired t test, ****P < 0.0001. (G, H) Surface plasmon resonance (SPR) sensorgrams of full-length TGM1 and TGM4 binding to biotinylated Avi-tagged TβRI immobilised on a streptavidin chip. Injections were performed as a twofold dilution series and are shown in black, with the orange traces over the raw data showing curves fitted to a 1:1 model. The black bars over the sensorgrams specify the injection period and the injection concentrations are indicated in the upper left. (I) SPR sensorgram of full-length TGM4 binding to biotinylated Avi-tagged TβRII immobilised on a streptavidin chip, with injection performed as above; injection period depicted by the black bar at top, and injection concentrations at bottom left. (J) NMR analysis of TGM4 D3 binding to TβRII; 15N-labelled D3 alone was at a concentration of 100 µM (red) and is overlaid with the 1H-15N spectra of the same protein bound to 1.2 molar equivalents of unlabelled TβRII (blue). Expansion of intermediate titration points (1:0, 1:0.4, 1:0.8, 1:1.2 15N-TGM4 D3:TβRII) of the boxed signals are shown in the lower panel. Data showing no interactions with other Type II receptors are presented in Fig. EV3. Data Information: Data in (D, E) analysed by unpaired Student’s t test; in (D), P = 0.0241 and in (E), P < 0.0001. In both panels, *P < 0.05, ****P < 0.0001.
Figure 3
Figure 3. TGM4, like TGM1, binds CD44.
(A) eGFP trap pull-down and western blotting analyses of MFB-F11, RAW264.7 and HepG2 cells transfected with eGFP alone, or with eGFP-TGM1 or TGM4 fusions; whole-cell lysates shown in the left-hand side of each panel, and anti-GFP immunoprecipitates (pulldowns) shown on the right; western blots were probed with antibodies to CD44, TβRI, and TβRII. Images are from 1 of 3 biological replicate experiments. (BD) Densitometric analysis, from all three biological replicate experiments, of pull-down proteins CD44 (B), TβRI (C), and TβRII (D) from MFB-F11 or RAW264.7 cells expressing TGM1 or TGM4. Data are shown as fold change relative to TGM1 (B, C) or TGM4 (D) that have been respectively normalised to 1. Data presented as mean ± SD of all biological replicates. (E) eGFP trap pulldown and western blotting RAW264.7 cells as in (A), with TGM4 full-length (FL) and truncated constructs D1-3 and D4-5. Images are from 1 of 3 biological replicate experiments. (F, G) ITC binding isotherms of TGM4 D4-5 binding to murine and human CD44 (F, G, respectively). Two technical replicate measurements, depicted in blue and purple, were globally fit to a single binding isotherm. (H, I) TGM4 activation of pSMAD signalling in RAW264.6 macrophages is dependent on CD44 expression, shown as western blot images from 1 of 3 biological replicate experiments (H), and densitometric data from all three biological replicate experiments, with increasing doses of TGM4 corresponding to doses of 1.25, 2.5, 5 and 10 µg/ml (I); in (I) TGF-β is shown to activate in a CD44-independent manner. Data Information: Data in (BD, I) analysed by two-way ANOVA with Sidak’s multiple comparison test. In (B), TGM1 vs TGM4 in RAW264.7 cells, P = 0.025; in (C), TGM1 vs TGM4 in RAW264.7 cells, P = 0.049; in (D), TGM1 vs TGM4 in both MFB-F11 and RAW264.7 cells, P < 0.0001; in (I), at 2.5 µg/ml P = 0.002; at 5 µg/ml P = 0.046; and at 10 µg/ml P = 0.002. In all panels, ns = not significant, *P < 0.05, **P < 0.01, ****P < 0.0001.
Figure 4
Figure 4. TGM4 binding to host immune cells.
(A) Co-staining of CD44 and Alexa Fluor 594 (AF594)-labelled TGM1 or TGM4 to peritoneal CD3+ T cells, and CD11b+F4/80(high) MHC-II(low) large peritoneal macrophages, measured by flow cytometry. Percentages of the target populations in each quadrant from 1 of 2 biological replicate experiments are shown. (B) Mean fluorescent intensity (MFI) for AF594-labelled TGM1 or TGM4 binding to peritoneal T cells and large peritoneal macrophages. Data shown are from 1 of 2 biological replicate experiments, with n = 3, showing mean ± SE. (C) Co-staining of AF594-labelled TGM1 and AF488-labelled TGM4 to peritoneal CD19+ B cells, CD3+ T cells and large peritoneal macrophages. Plots are superimposed from the indicated cell populations stained with TGM1 (cyan), TGM4 (orange), both TGM1 and TGM4 (purple) or unstained control (black). Data shown are from 1 of 2 biological replicate experiments. (D) Quantification of staining of large peritoneal macrophages by AF594-TGM1 or AF488-TGM4 in the absence of the presence of TGM4 or TGM1, respectively, as measured by MFI; the combination of TGM1 and TGM4 reduced the TGM1 signal by 38.2% and the TGM4 signal by 14.7%. Data shown are from 1 of 2 biological replicate experiments, with n = 4, showing mean ± SE. (E) Flow cytometric analysis of TGM4 binding to RAW264.7 wild-type and CD44-deficient cells, probed with full-length TGM4 D1-5, and truncated constructs D1-3 and D4–5. Data shown are from 1 of 3 biological replicate experiments. (F) Superimposition of the 3 datasets, with full-length TGM4 D1-5 (orange), D1-3 (dark blue), D4–5 (magenta), together with unstained control (black). Data shown are from 1 of 3 biological replicate experiments. (G) MFI in all three biological replicate experiments comparing binding of the TGM4 full-length and truncation constructs to wild-type and CD44-deficient RAW264.7 cells. Data are presented as mean ± SD. (H, I) Partial inhibition of AF AF488 FL TGM4 binding to RAW264.7 in the presence of unlabelled TGM4 D4–5 shown as exemplar histogram (G) and data from three technical replicate samples (H). Data are presented as mean ± SD. Data Information: Data in (B, D, G) analysed by two-way ANOVA with Sidak’s multiple comparison test. Data in (I) analysed by unpaired Student’s t test. In (B), TGM1 vs TGM4 in T cells, P = 0.0200; TGM1 vs TGM4 in LPM cells, P = 0.0003; in (D), TGM1 + TGM4 vs TGM1 alone, P < 0.0001; TGM4 + TGM1 vs TGM4 alone, P = 0.0014; in (G) Control vs CD44 KO with TGM4 D1-5 and with TGM4 D4–5 P < 0.0001; in (I) TGM4 D1-5 alone vs TGM4 D-15 + D4–5, P = 0.003. In all panels, ns = not significant, *P < 0.05, **P < 0.01, ***P < 0.001, ****P < 0.0001.
Figure 5
Figure 5. Identification of novel co-receptors for TGM4.
(AC) Pull-down samples purified from cells treated with biotin-tagged TGM4 and precipitated with streptavidin resin were subjected to mass spectrometry and analysed relative to control samples, pooling data from three biological replicate experiments, using C57BL/6 strain murine splenocytes (A), MFB-F11 fibroblasts (B) and J774 macrophages (C). (D–F) Parallel analyses of pull-down samples in the same experiments with TGM1 in the three indicated cell types, pooling data from three biological replicate experiments. (G) Pull-down and western blot analysis in CD44-sufficient and -deficient RAW264.7 cells, probed with antibodies to the indicated proteins. (H) As (G), but comparing full-length and truncated constructs of TGM4 by pulldown and western with antibodies to indicated proteins. Data Information: Data in (AF) analysed by Student’s t test plotted on graph by difference against the indicated P values plotted as negative logarithmic values.
Figure 6
Figure 6. TGM4 activity on macrophage populations.
(A, B) In vitro responses of bone marrow-derived macrophages (BMDM) to a range of concentrations of TGF-β, TGM1 and TGM4, in the presence or absence of 100 ng/ml LPS, measured by release of TNF (A) and IL-6 (B) after 24 h of culture. Data represent one of three biological replicate experiments, with n = 3, showing mean ± SE. (C) In vitro responses of bone marrow-derived macrophages (BMDM) cells to a range of concentrations of TGF-β, TGM1 and TGM4, in the presence or absence of 100 ng/ml LPS, measured by release of IL-1β after 24 h of culture. Data represent 1 of 2 biological replicate experiments, with n = 3, showing mean ± SE. (DF) Responses of bone marrow-derived macrophages(BMDM) to a range of concentrations of TGF-β, TGM1 and TGM4, in the presence or absence of 20 ng/ml IL-4, measured by release of Arginase-1 (D), Chi3L3 (Ym1) (E), and RELM-α (F) after 24 h of culture. Data represent one of two biological replicate experiments, with n = 3, except for (F), which is 1 of 4 replicates, showing mean ± SE. (G–I) Phenotype of resident large peritoneal macrophages(LPM), collected from the peritoneal cavity 24 h after i.p. injection of PBS, TGF-β, TGM1 or TGM4, and analysed by flow cytometry for staining for Arginase-1 (G), RELM-α (H), and CD86 (I) Data represent one of three biological replicate experiments, with n = 3, showing mean ± SE. Data Information: Data in (AF) analysed by two-way ANOVA with Dunnett’s multiple comparisons test. In (A, B, DF), statistical significances for each dose of TGF-β, TGM1 and TGM4 in presence of LPS versus LPS alone was P < 0.0001; in (C), only doses of 100 ng/ml reached significance, at P = 0.0358 for TGF-β, 0.0101 for TGM1, and 0.0173 for TGM4. Data in (G–I) were analysed by one-way ANOVA; in (G), TGM1 D1-5 vs PBS, and TGM4 D1-5 vs PBS, both P < 0.0001; TGM1 D1-5 vs TGM1 D1-3, P = 0.001; TGM4 D1-5 vs TGM4 D1-3, P < 0.0001; TGM4 D1-3 vs TGM6, P = 0.0456. in (H), TGM1 D1-5 vs PBS, P = 0.0062, and TGM4 D1-5 vs PBS, P = 0.0127; TGM4 D1-5 vs TGM4 D1-3, P = 0.0451. In (I), TGM1 D1-5 vs PBS, and TGM4 D1-5 vs PBS, both P < 0.0001; TGM1 D1-5 vs TGF-β, P = 0.0038; and TGM4 D1-5 vs TGM6, P = 0.0004. For all panels, ns = not significant, *P < 0.05, **P < 0.01, ***P < 0.001, ****P < 0.0001.
Figure EV1
Figure EV1. Schematic structure and similarity of TGM1 and TGM4 domains.
(A) Schematic of domain organisation; figures denote amino acid identity for each domain to TGM1, and amino acid identity for D1-3, D4–5 and full-length TGM4. (B) Amino acid alignments for each domain of TGM1 and TGM4; identical domains are shaded. Red background denotes residues of TGM1 identified as contacting TβRII (Mukundan et al, 2022). (C) Inhibition of Foxp3 induction of TGM1 and TGM4 in the presence of SB431542, which blocks kinase activity of ALK5, receptor I for TGF-β; data represent a single experiment, n = 3 per group, showing mean ± SE. Data Information: Data in (C) analysed by unpaired t test; untreated and SB431542 treated comparisons, for TGF-β, P = 0.0040; for TGM1, P = 0.0031; for TGM4, P = 0.0043. **P < 0.01.
Figure EV2
Figure EV2. Responses of different cell types to TGM4.
(A–C) SMAD2/3 nuclear localisation by imaging flow cytometry in T cells at 1 h (A) and 16 h (B) post-stimulation, and in macrophages at 1 h (C), stimulated with TGF-β, TGM1 or TGM4, evaluated by ImageStream. Data are from one (n = 2) of two biological replicate experiments. (D, E) NM18 mouse mammary gland epithelial cell (D) and NIH 3T3 mouse embryonic fibroblast (E) lines transfected with the CAGA-dynGFP reporter plasmid, and stimulated with TGFβ, TGM1 or TGM4, assayed by fluorescent intensity at 24 h. Data are from one (n = 3) of two biological replicate experiments, presented as mean ± SE. (F) NIH 3T3 cells analysed for pSMAD induction by Western blot by the indicated concentrations of TGF-β, TGM1 or TGM4, for 30, 60 or 180 min. (G) pSMAD induction in MuTu mouse splenic dendritic cells. Cells were stimulated for one hour with 10 ng/ml of each TGM protein, 50 ng/ml BMP6 and 5 ng/ml TGF-β. (H) pSMAD induction in the D1 mouse dendritic cell line (left) and bone marrow-derived DCs, differentiated in vitro with GM-CSF (right). Cells were stimulated for one hour with 10 ng/ml of each TGM protein, 50 ng/ml BMP6 and 5 ng/ml TGF-β. Data Information: Data in (D, E) analysed by two-way ANOVA with Tukey’s multiple comparisons test; in (D), at 10 ng/ml, TGF-β vs TGM1 P = 0.0295, and both TGF-β or TGM1 vs TGM4 P < 0.0001. In (E), TGM1 versus either TGF-β or TGM4, P < 0.0001; TGF-β vs TGM4, P = 0.0053. *P < 0.05, **P < 0.01, ****P < 0.0001.
Figure EV3
Figure EV3. Testing binding of TGM4 to other TGF-β family receptors.
(A) ITC analysis of interaction of ActRII with full-length (FL) TGM4; upper panel presents the raw measured heat represented as differential power (DP) for successive 2.5 µL injections of 200 µM ActRII into a cell containing 300 µL of 15 µM FL TGM4; lower panel presents the integrated heats for these data represented as the change in enthalpy (ΔH) as a function of the increasing molar ratio of ActRII to FL TGM4. One independent measurement, depicted in purple was performed. No binding isotherm could be fit. (B) As (A), for interactions of FL TGM4 with His-tagged ActRIIB; 300 μL of 10 µM FL TGM4 was titrated with successive 2.5 μL injections of 150 μM his-tagged ActRIIB). Two independent measurements, depicted in blue and purple, were performed. No binding isotherm could be fit. (C) As (A), for interactions of FL TGM4 with BMPRII; (300 μL of 10 µM FL TGM4 was titrated with successive 2.5 μL injections of 150 μM BMPRII). One independent measurement, depicted in purple was performed. No binding isotherm could be fit. (D) NMR analysis of TGM4 D2 interaction with ALK4 Type I receptor. 1H-15N spectrum of 15N Alk4 alone (left, red) and overlaid onto the 1H-15N spectrum of 15N Alk4 bound to 1.2 molar equivalents of unlabelled TGM4 D2 (right, blue).
Figure EV4
Figure EV4. Domain and co-receptor interactions of TGM4.
(A) Flow cytometric analysis of CD44 binding to control RAW264.7 cells (cyan) and Cd44-deleted RAW264.7 cells (tan). (B) Binding of AF594-labelled TGM1 and TGM4 constructs to the indicated cell lines, measured by Mean Fluorescence Intensity on a flow cytometer (n = 3). One of 2 biological replicate experiments, n = 3, presented as mean ± SD. (C) Quantification of staining of AF594-labelled TGM1 to peritoneal eosinophils (SiglecF+, CD11b(int), Ly6G(low), CD117), mast cells (CD117+, SSC(high)), monocytes (CD11b+, CD115+, CD117, Ly6G, F4/80, SiglecF, MHC-II, CD3, CD19), neutrophils (CD11b+, Ly6G+, CD117) and small peritoneal macrophages (CD11b+, CD117, Ly6G, F4/80(low), SiglecF, MHC-II(high), CD3, CD19), in absence (solid bars) or presence (hatched bars) of TGM4, as measured by MFI. One of 2 biological replicate experiments, n = 4, presented as mean ± SD. (D, E) Flow cytometric analysis of TGM4 binding to MFB-F11 wild-type and CD44-deficient cells, probed with full-length TGM4 D1-5, and truncated constructs D1-3 and D4–5. Example histograms (D) and results from 3 biological replicate experiments (E) are shown. Data shown (n = 3), presented as mean ± SD. (F) pSMAD induction in RAW264.7 cells by truncated 10 ng/mLTGM4 constructs, with C-terminal deletions and N-terminal deletions, assessed by western blotting. FL Full-length. Data Information: Data in (B, C, E), analysed by 2-way ANOVA; in (B), each comparison between TGM1 and TGM4, P < 0.0001; in (C), comparison between TGM1 and TGM4 for mast cells and macrophages; in (E), comparisons between wild-type and CD44 KO MFB-F11 fibroblasts with TGM4 D1-5 and TGM4 D4–5, both P < 0.0001; comparison with TGM4 D1-3, P = 0.0084.
Figure EV5
Figure EV5. Functional analysis of co-receptors.
(A) Heat map of mean mass spectrometry Label-Free Quantitation intensity values for proteins detected in each case, in the samples presented in Fig. 5A–F. (B) Pull-down and Western blot analysis in CD44-sufficient and -deficient MFB-F11 cells, probed with antibodies to the indicated proteins. Image is from one of 3 biological replicate experiments. (C) SMAD phosphorylation in RAW264.7 cells sufficient or deficient for CD49d, following stimulation with the indicated concentrations of TGM4. Image is from one of 3 biological replicate experiments. (D) As (B), but with RAW264.7 cells sufficient or deficient for NRP-1. Image is from one of 3 biological replicate experiments. (E) Flow cytometric measurement of TGM4 binding to cells lacking CD49d or NRP-1. RAW264.7 control cells, and sublines in which expression of CD49d or NRP-1 was genetically deleted, were probed by flow cytometry for binding to anti-CD44, TGM4 D-15, D1-3 or D4–5 as indicated.

References

    1. Anthony RM, Urban JF Jr., Alem F, Hamed HA, Rozo CT, Boucher JL, Van Rooijen N, Gause WC (2006) Memory TH2 cells induce alternatively activated macrophages to mediate protection against nematode parasites. Nat Med 12:955–960 - PMC - PubMed
    1. Baaten BJ, Tinoco R, Chen AT, Bradley LM (2012) Regulation of antigen-experienced T cells: lessons from the quintessential memory marker CD44. Front Immunol 3:23 - PMC - PubMed
    1. Boutard V, Havouis R, Fouqueray B, Philippe C, Moulinoux J-P, Baud L (1995) Transforming growth factor-β stimulates arginase activity in macrophages. Implications for the regulation of macrophage cytotoxicity. J Immunol 155:2077–2084 - PubMed
    1. Brautigam CA (2015) Calculations and publication-quality illustrations for analytical ultracentrifugation data. Methods Enzymol 562:109–133 - PubMed
    1. Brautigam CA, Zhao H, Vargas C, Keller S, Schuck P (2016) Integration and global analysis of isothermal titration calorimetry data for studying macromolecular interactions. Nat Protoc 11:882–894 - PMC - PubMed

MeSH terms

Substances

LinkOut - more resources