. 2025 Mar;32(3):491-501.
doi: 10.1038/s41594-024-01432-1. Epub 2024 Nov 28.

Closed and open structures of the eukaryotic magnesium channel Mrs2 reveal the auto-ligand-gating regulation mechanism

Affiliations

Closed and open structures of the eukaryotic magnesium channel Mrs2 reveal the auto-ligand-gating regulation mechanism

Ping Li et al. Nat Struct Mol Biol. 2025 Mar.

Abstract

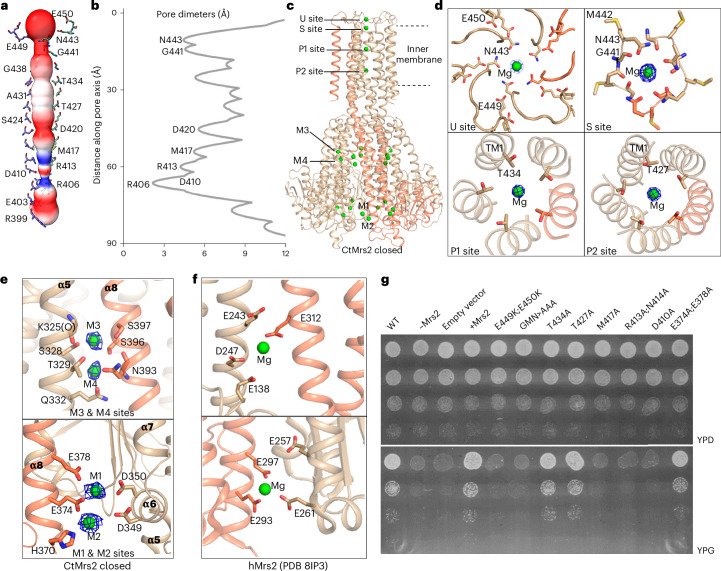
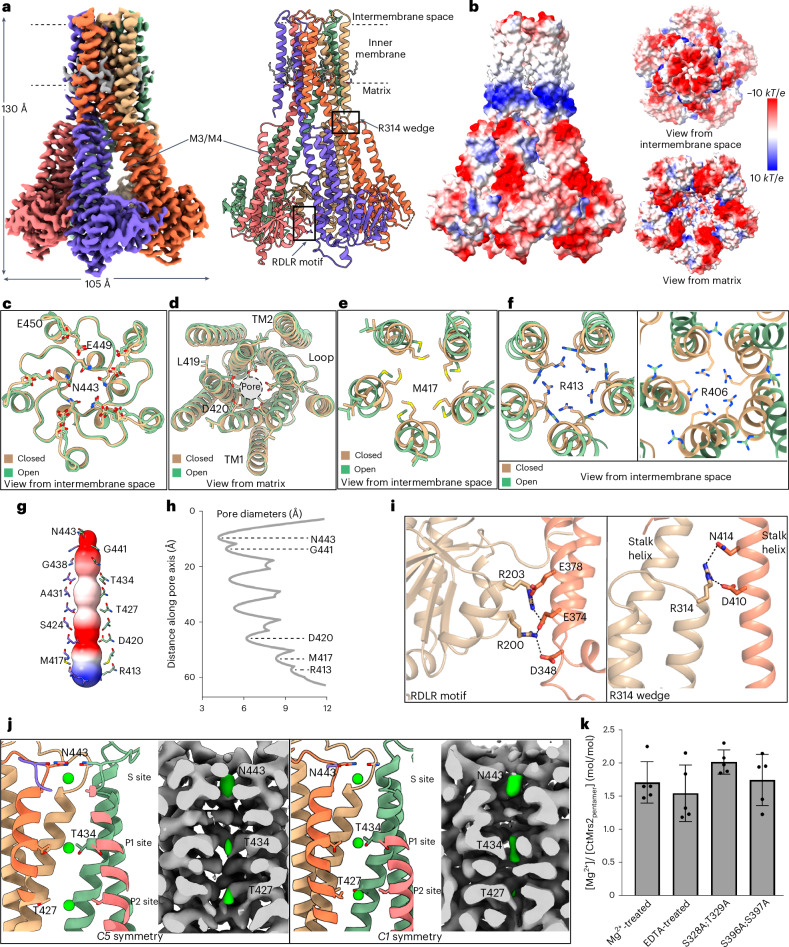
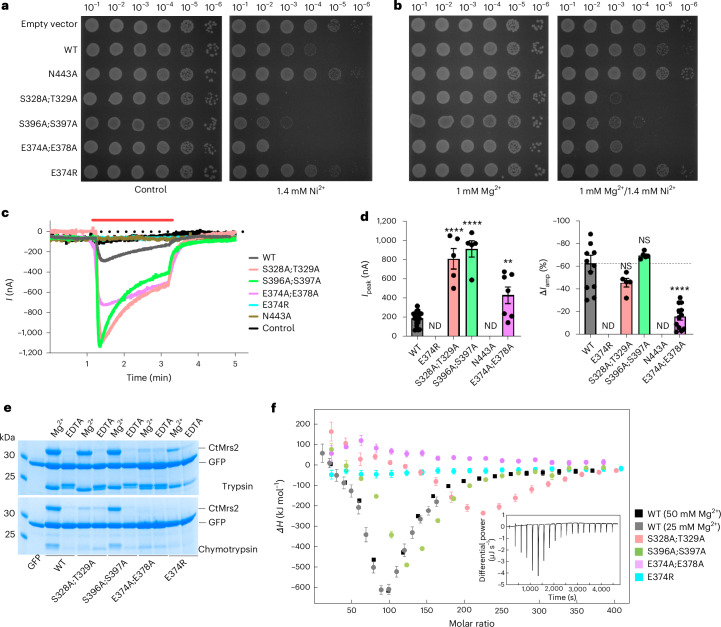
The CorA/Mrs2 family of pentameric proteins are cardinal for the influx of Mg2+ across cellular membranes, importing the cation to mitochondria in eukaryotes. Yet, the conducting and regulation mechanisms of permeation remain elusive, particularly for the eukaryotic Mrs2 members. Here, we report closed and open Mrs2 cryo-electron microscopy structures, accompanied by functional characterization. Mg2+ flux is permitted by a narrow pore, gated by methionine and arginine residues in the closed state. Transition between the conformations is orchestrated by two pairs of conserved sensor-serving Mg2+-binding sites in the mitochondrial matrix lumen, located in between monomers. At lower levels of Mg2+, these ions are stripped, permitting an alternative, symmetrical shape, maintained by the RDLR motif that replaces one of the sensor site pairs in the open conformation. Thus, our findings collectively establish the molecular basis for selective Mg2+ influx of Mrs2 and an auto-ligand-gating regulation mechanism.


Conflict of interest statement

Competing interests: The authors declare no competing interests.

Figures

Fig. 1
Fig. 1. Overall architecture of Mrs2 and the closed conformation.
a, Topology of one Mrs2 monomer, with the NTD located in the matrix and TM1 and TM2 in the C terminus. The conserved GMN selective filter motif is located at the end of TM1 and two acidic residues (red dots) in the loop connecting TM1 and TM2. b, SEC profile of detergent-solubilized GFP-fused CtMrs2 (performed at least five independent times) and associated Coomassie-stained native PAGE (performed twice independently), indicating that CtMrs2 forms homopentamers. c, The 2.7-Å overall resolution cryo-EM density of the closed CtMrs2 homopentamer, shown from the membrane plane, from the intermembrane space and from the matrix (C5 map). Separate monomers are colored blue, orange, wheat, green and pink and the nanodisc is colored gray. d, Cartoon representation of the final structure of the closed CtMrs2 homopentamer with the same views and colors as in c. e, Surface electrostatics of the closed CtMrs2 homopentamer, shown from the membrane plane, from the intermembrane space and from the matrix. Source data
Fig. 2
Fig. 2. The closed permeation pathway and Mg2+-binding sites.
One selected monomer is shown in orange throughout. a, MOLE software analysis of the conducting pore, shown as electrostatic surface, with residues lining the pathway shown as sticks. b, HOLE software calculation of pore diameter along the pore. c, Location of putative Mg2+ ions (shown in green) in the closed homopentamer. d, Close-up views with supporting cryo-EM density in the symmetry-applied C5 map of the putative Mg2+-binding sites close to or in the conducting pathway. Site U is positioned next to the loop in between TM1 and TM2 and site S is positioned next to the GMN motif of the selectivity filter. Sites P1 and P2 are located in the TM domain. e, Close-up views of sites M1–M4 in the NTD of CtMrs2. f, Close-up views of the corresponding Mg2+-binding sites (shown in e) in hMrs2 (PDB 8IP3), equivalent to sites M1 (top) and M4 (bottom). g, Growth phenotypes on YPD and YPG (the latter requiring mitochondrial respiration) media of WT Mrs2 from S.cerevisiae (ScMrs2), the equivalent MRS2-knockout strain (−MRS2), and cells based on −MRS2 with an empty vector or a vector containing different mutant forms of ScMrs2 (CtMrs2 numbering).
Fig. 3
Fig. 3. The open state of Mrs2.
The cryo-EM density panels refer to the C5 map throughout. a, Left, the 3.2-Å overall resolution cryo-EM density of the CtMrs2 homopentamer open state. Right, cartoon representation of the corresponding structure. The inset shows the feature assigned as cardiolipin, with the equivalent cryo-EM density in gray. b, Surface electrostatics of the open structure shown from the membrane plane, from the intermembrane space and from the matrix. cf, Structural comparisons of the open and closed CtMrs2 structures along the ion conductance pore at E449-E450 (c; view from the intermembrane space), D420 (d; view from the matrix), M417 (e; view from the intermembrane space) and R413 and R406 (f; view from the intermembrane space). g,h, MOLE and HOLE software analyses of the pore of the open structure, shown as the electrostatic surface, with residues lining the pathway shown as sticks (g) and with the diameter of the pore along the pathway (h). i, Close-up views of the RDLR motif and the R314 wedge in the open structure. j, Putative Mg2+-binding sites at the GMN motif selectivity filter (S site) and at the T427 (P1) and T434 (P2) rings observed in the cryo-EM maps calculated with five-fold symmetry (left) and without symmetry (right). k, Mg2+-binding stoichiometry in various CtMrs2 forms under different conditions, as determined by ICP-MS (stoichiometries refer to Mg2+ per CtMrs2 pentamer). Data points represent the means of five independent measurements, each from one purified sample, and error bars indicate the s.d. Source data
Fig. 4
Fig. 4. Conformational changes between the open and the closed states.
a,b, Alignments of the TM domains of the open and closed CtMrs2 structures shown from the membrane plane, from the intermembrane space and from the matrix (a) and of a single monomer (b). Residues lining the pore are shown as sticks in b. The intermembrane space loop and the TM domain (formed by TM1 and TM2) are highly similar between the two states, whereas the NTD is rotated, providing a wider funnel in the open structure. Nonetheless, the five-fold symmetry is maintained in both configurations. c,d, Conformational changes at the M1 and M2 (c) and M3 and M4 (d) Mg2+ ion-binding sites between the closed (left) and the open (right) states, with residues involved in ion binding shown as sticks.
Fig. 5
Fig. 5. The roles of the M1–M4 Mg2+-binding sites.
a,b, Comparison of the growth of E.coli with different CtMrs2 forms at different ion concentrations. The empty vector represents a control without Mrs2. c, Overlay of representative Mg2+ currents recorded in oocytes expressing WT and mutants. The red bar indicates the application period of Mg2+-containing recording solution. The control denotes water-injected oocytes. d, Summary of the recorded currents with peak current amplitudes following Mg2+ perfusion (Ipeak; left) and spontaneous current decay during Mg2+ perfusion (ΔIamp (%); right). Data shown as the mean ± s.e.m. (n = 5–19). Statistical analysis was conducted using a one-way ANOVA followed by Dunnett’s multiple-comparisons test in comparison to WT. NS, nonsignificant (P > 0.05; 0.16 for S328A-T329A and 0.79 for S396A-S397A); **P = 0.0036 and ****P < 0.0001. Further data and details are provided in Supplementary Fig. 2 and the Methods. ND, not determined (because of no detectable currents). e, Limited proteolysis assay (performed twice independently) using purified CtMrs2 forms using two separate proteases. The bands above 30 kDa represent CtMrs2, while the bands between 25 and 30 kDa are GFP, as confirmed by mass spectrometry. f, Binding isotherms for Mg2+ binding to WT CtMrs2 (at two stock concentrations) and mutant forms showing the heat of injection as a function of the molar ratio between Mg2+ and CtMrs2 monomer. For all mutants, 50 mM Mg2+ was used. For the mutants, the presented values are the means of two independent ITC titrations. Error bars show one s.d. and are estimated from the baseline uncertainties provided by NITPIC as previously described and from the uncertainty between injection from the two datasets, where i refers to the injection number (1–19). The inset graph shows the raw thermogram, before integration by NITPIC, for the titration of 50 mM Mg2+ into WT. The complete ITC data are presented in Supplementary Fig. 4 (Methods). Source data
Fig. 6
Fig. 6. Proposed Mg2+ autoregulation gating mechanism of Mrs2.
a,b, Schematic model as viewed from the mitochondrial inner membrane (a; with two monomers for simplicity) and from the matrix (b). In the closed state, Mg2+ ions bind between the NTDs of separate monomers (positions M1 and M4 or M1–M4 in CtMrs2), thereby assisting in stabilizing the symmetrical shape, and to distinct positions of the pore (U, S, P1 and P2). In the open configuration, Mg2+ is only present at some of the pore sites (S, P1 and P2) and the NTD is instead maintained in an alternative symmetrical assembly by the RDLR motif and residues that previously formed the M1 and M2 sites (blue). At elevated Mg2+ levels in the mitochondrial matrix, Mrs2 is closed. Acidic rings formed by the loops in the intermembrane space (shown in red) attract fully hydrated Mg2+ (large green circles), which can be transferred as partially hydrated Mg2+ (small green circles) to the asparagine ring of the GMN motif selectivity filter (pink) and then to the P1 and P2 sites (purple) of the pore in the TM domain. However, flux is not permitted as the pore-gating methionine and arginine rings (brown polygons), located approximately at the membrane interface to the matrix, are closed. At low Mg2+ concentrations in the matrix, the open structure is present. Removal of the ions from M1 and M4 (and from M1–M2 and M3–M4 in CtMrs2) of the closed structure triggers a shift and rotation of the stalk helix (light brown), resulting in opening of the pore gate, which permits Mg2+ influx into the matrix. It is possible that site S also prevents backflow to the intermembrane space. The closed state is reobtained through Mg2+ destabilization of the RDLR motif interaction and through Mg2+ bridging of the separated residues of the M3–M4 site.
Extended Data Fig. 1
Extended Data Fig. 1. Functional characterization and secondary structure of CtMrs2.
a, Growth comparison of wild-type and Mrs2 knockout S. cerevisiae on fermentable carbon source (with glucose) and nonfermentable carbon source (glycerol). b, Live cell bioimaging micrographs of yeast cells expressing CtMrs2 with bright light (left) and GFP fluorescence (right), The scale bar represents 5 µm. The experiments were performed more than five times independently. The protein likely partitions to mitochondria. c, Schematic depiction of the secondary structure of a CtMrs2 monomer. d, Cartoon representation of the CtMrs2 monomer, colored as in panel c. e, Surface electrostatics of CtMrs2 with close-views of the basic and acidic rings.
Extended Data Fig. 2
Extended Data Fig. 2. Sequence alignment of Mrs2 and CorA proteins.
The following sequences are included in the alignment (Uniprot-ID in brackets): CtMrs2 from Chaetomium thermophilum (G0S186), ScMrs2 from Saccharomyces cerevisiae (Q01926), HsMrs2 (or hMrs2) from Homo sapiens (Q9HD23), MmMrs2 from Mus musculus (Mouse) (Q5NCE8), DrMrs2 from Danio rerio (E7F680), TmCorA from Thermotoga maritima (Q9WZ31) and MjCorA from Methanocaldococcus jannaschii (Q58439). There is relatively low sequence homology between Mrs2 and CorA proteins (for example 35 % between TmCorA and the equivalent from Saccharomyces cerevisiae, ScMrs2) and even among Mrs2 members (for example 47 % between ScMrs2 and hMrs2). α-helices and β-strands are labelled with black arrows and grey cylinders as derived using the CtMrs2 structure. Black and blue arrowheads mark residues involved in gating (conserved arginine among Mrs2 proteins are highlighted with dark green box) and in Mg2+-binding, respectively. Green boxes denote the conserved GMN-motif selectivity filter and the conserved RDLR-regulation motif. Red circles represent residues of the conserved acidic loop. Wheat boxes show TM1 and TM2. Sequence alignments were performed using Cluster Omega (online) and visualized using ESPript 3.0 (online).
Extended Data Fig. 3
Extended Data Fig. 3. Cryo-EM data processing for the closed CtMrs2 state.
a, Representative motion corrected micrographs, more than 2000 micrographs were collected. b, Cryo-EM data processing workflow. c, Selected 2D classes shows the orientation problem with most classes appearing as side-views and with only few tilted views. d, Gold standard Fourier shell correlation curves calculated for the reconstructed map based on a FSC 0.143 cut-off. e, Particle orientation distribution of the final reconstruction with predominant side-view particles. f, Local resolution maps with different views based on a FSC 0.143 cut-off.
Extended Data Fig. 4
Extended Data Fig. 4. Cryo-EM density and associated model of representative parts of the closed and open CtMrs2 states.
a, The closed CtMrs2 pentamer, a separate monomer, and different segments. The cardiolipin density is colored in yellow. b, The open CtMrs2 pentamer, a separate monomer, and different segments. Interestingly, the open structure displays a clear lipid feature density in the groove between TM1 and TM2 of two adjacent monomers.
Extended Data Fig. 5
Extended Data Fig. 5. Structural comparisons of the closed CtMrs2 state with relevant conformations of ScMrs2, hMrs2, CorA, ZntB.
a, Alignment of a CtMrs2 monomer (blue) with the AlphaFold model of ScMrs2 monomer (green) (downloaded from AlphaFold Protein Structure Database), including a close-view of the residues lining the Mg2+-conducting pathway and certain residues of the NTD. b, The soluble domain of CtMrs2 shows a similar fold as the one previously determined for the NTD of ScMrs2 (cyan, PDB-ID 3RKG). c, Alignments of CtMrs2 (blue) with human hMrs2 (wheat, PDB-ID 8IP3). The left panel shows an alignment of the pentamers, while the right panel displays an alignment of the monomers. d, Alignments of CtMrs2 (blue) with TmCorA (grey, PDB-ID 3JCF). The left panel shows an alignment of the pentamers, while the right panel displays an alignment of the monomers. e, Alignment of CtMrs2 (blue) with ZntB (orange, PDB-ID 5N9Y). The left panel shows an alignment of the pentamers, while the right panel displays an alignment of the monomers. f, Mg2+-binding sites (corresponding to site M3 and M4 in CtMrs2) of MjCoA (wheat, PDB-ID 4EV6), and a close-view with residues shown as sticks, and with Mg2+ shown as green spheres.
Extended Data Fig. 6
Extended Data Fig. 6. Structural comparisons of the ion conductance pathways and M1 & M2 sites of the closed states of CtMrs2 and TmCorA.
The figure was generated using alignment of the YGMN-motifs. CtMrs2 is shown in blue with Mg2+ at M1 and M2 as green spheres. TmCorA (PDB-ID 3JCF) is shown in pink with Mg2+ at M1 and M2 as yellow spheres. Residues lining the pore are shown as sticks and the approximate pore lengths are indicated. a, Overall view. b, Close-view of the gate residues for TmCorA and CtMrs2. c, Close-views of the M1/2 binding sites from the cytoplasm and mitochondrial matrix of TmCorA and CtMrs2, respectively.
Extended Data Fig. 7
Extended Data Fig. 7. The cryo-EM C5 map of the closed state of CtMrs2 with details of the Mg2+-binding.
Side-view of CtMrs2 closed cartoon representation with associated cryo-EM map density (left). Close-views of the Mg2+-binding sites of the permeation pore (sites U, S as well as P1 and P2) as well as of the NTD in the mitochondrial matrix (sites M1 and M2 and M3 and M4).
Extended Data Fig. 8
Extended Data Fig. 8. Validation of studied ScMrs2 forms in terms of cellular localization and expression.
WT represents the exploited S. cerevisiae strain (BY4741) used for the experiments. ΔScMrs2 is BY4741 lacking native Mrs2. P426-ADH-HA(N) is ΔScMrs2 transformed with empty vector. ScMrs2_Full length is ΔScMrs2 transformed with the P426-ADH-HA(N) vector harbouring fulllength GFP-tagged ScMrs2, forming the basis for structure-function analyses. The corresponding variants of CtMrs2 are indicated in bold. a, The localization of ScMrs2 wild-type (ScMrs2_Full length) and mutants were investigated using fluorescence microscopy, comparing GFP-fluorescence (left), differential interference contrast (DIC) (middle) and merged (right), the scale bar represents 5 µm, Imaging experiments were conducted for three times with different clones of each yeast strain, and each time five different regions were captured containing around 100 cells in total. b, The expression of ScMrs2 wild-type (ScMrs2_Full length) and mutants probed using immunoblotting with an anti-HA antibody and using phosphoglycerate kinase (Pgk1) as a loading control. The experiments were conducted three times with different clones of each yeast strain. Source data
Extended Data Fig. 9
Extended Data Fig. 9. Cryo-EM data processing for the open CtMrs2 state.
a, Representative motion corrected micrograph, more than 10000 micrographs were collected. b, Cryo-EM data processing workflow. c, Selected 2D classes with different views. d, Gold standard Fourier shell correlation curves calculated for the reconstructed map based on a FSC 0.143 cut-off. e, Particle orientation distribution of the final reconstruction. f, Local resolution maps with different views based on a FSC 0.143 cut-off.
Extended Data Fig. 10
Extended Data Fig. 10. The open state of CtMrs2.
a, 3.2 Å overall resolution cryo-EM density of the CtMrs2 homo-pentamer (using C5 symmetry). The views are from the intermembrane space and from the matrix, respectively. The monomer are colored in blue, orange, wheat, green and pink. b, Cartoon representation of the CtMrs2 homo-pentamer with same views as in panel a and colored as in panel a. c, Comparison of two uncropped reconstructed cryo-EM maps, calculated in the absence of symmetry (C1, grey) or with C5 symmetry (yellow) imposed. The views are from the side, from the intermembrane space and from the matrix. The two maps overlay well. The Mg2+ bound to GMN-motif selectivity filter is shown as a green sphere.

References

    1. Maguire, M. E. & Cowan, J. A. Magnesium chemistry and biochemistry. Biometals15, 203–210 (2002). - PubMed
    1. Romani, A. M. Cellular magnesium homeostasis. Arch. Biochem. Biophys.512, 1–23 (2011). - PMC - PubMed
    1. Cowan, J. A. Structural and catalytic chemistry of magnesium-dependent enzymes. Biometals15, 225–235 (2002). - PubMed
    1. Hartwig, A. Role of magnesium in genomic stability. Mutat. Res475, 113–121 (2001). - PubMed
    1. Yamanaka, R. et al. Mitochondrial Mg2+ homeostasis decides cellular energy metabolism and vulnerability to stress. Sci. Rep.6, 30027 (2016). - PMC - PubMed

MeSH terms

LinkOut - more resources