. 2024 Nov 29;24(1):1142.
doi: 10.1186/s12870-024-05858-z.

Epigenetic regulation of organ-specific functions in Mikania micrantha and Mikania cordata: insights from DNA methylation and siRNA integration

Affiliations

Epigenetic regulation of organ-specific functions in Mikania micrantha and Mikania cordata: insights from DNA methylation and siRNA integration

Yatong Sang et al. BMC Plant Biol. .

Abstract

Background: DNA methylation is a crucial epigenetic mechanism that regulates gene expression during plant growth and development. However, the role of DNA methylation in regulating the organ-specific functions of the invasive weed Mikania micrantha remains unknown.

Results: Here, we generated DNA methylation profiles for M. micrantha and a local congeneric species, Mikania cordata, in three vegetative organs (root, stem, and leaf) using whole-genome bisulfite sequencing. The results showed both differences and conservation in methylation levels and patterns between the two species. Combined with transcriptome data, we found that DNA methylation generally inhibited gene expression, with varying effects depending on the genomic region and sequence context (CG, CHG, and CHH). Genes overlapping with differentially methylated regions (DMRs) were more likely to be differentially expressed between organs, and DMR-associated upregulated differentially expressed genes (DEGs) were enriched in organ-specific pathways. A comparison between photosynthetic (leaf) and non-photosynthetic (root) organs of M. micrantha further confirmed the regulatory role of DNA methylation in leaf-specific photosynthesis. Integrating small RNA-Seq data revealed that 24-nt small interfering RNAs (siRNAs) were associated with CHH methylation in gene-rich regions and regulated CHH methylation in the flanking regions of photosynthesis-related genes.

Conclusion: This study provides insights into the complex regulatory role of DNA methylation and siRNAs in organ-specific functions and offers valuable information for exploring the invasive characteristics of M. micrantha from an epigenetic perspective.

Keywords: Mikania cordata; Mikania micrantha; DNA methylation; siRNA.


Conflict of interest statement

Declarations. Ethics approval and consent to participate: Not applicable. Consent for publication: Not applicable. Competing interests: The authors declare no competing interests.

Figures
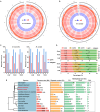
Fig. 1
Fig. 1
DNA methylation landscape of the M. micrantha and M. cordata. (A-B) DNA methylation profiles of CG, CHG, and CHH DNA across 18 chromosomes in M. micrantha (A) and M. cordata (B). The gray circle indicates chromosomes. a, Gene density; b, TE density; CG methylation (c-e), CHG methylation (f-h), and CHH methylation (i-k) of leaf, root, and stem (from outer to inner). (C) Average DNA methylation levels of CG, CHG, and CHH in genic regions and intergenic regions across different organs. a, mCG; b, mCHG; c, mCHH. Genic region: from 2k upstream to 2k downstream of a gene. (D) Proportion of methylation sites in genic and intergenic regions in CG, CHG and CHH contexts across different organs. (E) DNA methylome variation map of M. micrantha, M. cordata and 11 other plant species with different genome characteristics. The plant species under comparison are: Beta vulgaris [16], Solanum tuberosum [44], Camellia sinensis var. assamica [45], Arabidopsis thaliana [46], Populus trichocarpa [47], Glycine max [48], Oryza sativa [49], Panicum virgatum [50], Zea mays [16], Picea abies [51], Pinus tabuliformis [25]
Fig. 2
Fig. 2
DNA methylation profiles in genes and TEs across organs in M. micrantha and M. cordata. (A) DNA methylation patterns of the gene body and flanking regions within 2 kb. (B) DNA methylation patterns of TEs and their flanking regions within 2 kb. (C) Comparative analysis of DNA methylation patterns in different genomic regions between M. micrantha and M. cordata
Fig. 3
Fig. 3
Surveying gene expression among different organs in M. micrantha and M. cordata. (A-B) Venn diagram showing the number of DEGs between different organs of M. micrantha (A) and M. cordata (B). (C-D) The organ-specific gene expression patterns of M. micrantha (C) and M. cordata (D) in leaf, root, and stem. (E) Principal components analysis (PCA) of gene expression levels in 18 samples. (F) Scatter plot showing the number of up/downregulated one-to-one orthologous genes in three organs of M. micrantha compared to M. cordata. (G) GO enrichment analysis of upregulated one-to-one orthologous genes in the leaf of M. micrantha compared to M. cordata
Fig. 4
Fig. 4
Diverse regulatory roles of DNA methylation on gene expression in M. micrantha and M. cordata. (A) Expressed genes were divided into three groups according to their expression levels. (B) Correlations between methylation levels (CG, CHG, and CHH) and gene expression across gene bodies and flanking regions (up/down 2 kb). The methylation levels of each gene group (Low, Middle, and High) were calculated. Only expressed genes (FPKM > 0) were included in this analysis. Different letters indicate statistically significant differences between groups (p ≤ 0.05). (C) Changes in methylation levels between expressed (FPKM > 0) and unexpressed genes (FPKM = 0) in CG, CHG, and CHH sequence contexts. ***Mann-Whitney U test, p ≤ 0.001. (D) Methylation regulation patterns on gene expression in M. micrantha and M. cordata. (E) Correlation between gene expression and methylation levels in the 3’UTR region of M. micrantha within CG, CHG and CHH sequence contexts. (AC, E) are data from leaves
Fig. 5
Fig. 5
Differential methylation regions associated DEGs analysis. (A) Bar plot of hyper/hypo-DMR among different organs in M. micrantha and M. cordata. (B) Distribution of DMR across different genomic regions. (C) Summary of DEGs and DMR-associated DEGs among different organs in M. micrantha and M. cordata. (D) Enriched KO terms of DMR-associated upregulated DEGs in the leaves. The Q-value is scaled to the thickness of the line
Fig. 6
Fig. 6
Expression patterns and DNA methylation of photosynthesis-related genes in M. micrantha. (A) Number of hyper-/hypo-DMRs overlapping with upregulated DEGs in the leaf compared to the root. DMRs were divided into upstream, downstream, and gene body regions of CG, CHG, and CHH contexts. (B) Enriched GO terms for upregulated DEGs associated with CG hypo-DMRs in the gene body region of the leaf compared to the root. (C) Expression pattern of genes enriched in the photosynthesis pathway shown in Fig. 6B. (D) Dynamic changes of DNA methylation in CG, CHG, and CHH contexts of photosynthesis-related genes across different organs. The upstream, gene body, and downstream regions were divided into 10 bins, and the methylation levels of each bin were calculated. (E) Genome browser snapshot showing DNA methylation changes of evm.model.contig60_pilon.265 across different organs in CG, CHG, and CHH contexts
Fig. 7
Fig. 7
Association analyses of DNA methylation and siRNA expression in M. micrantha. (A) Length distribution of small RNAs (from 20 to 25 nucleotides) in the root, stem, and leaf of M. micrantha. (B) Nucleotide distributions and abundance of 21-, 22-, and 24-nt within the mapping region and 10-nucleotide flanking regions. mC represents methylcytosine on the sense strand; mC* represents methylcytosine on the antisense strand. Data from the leaf. (C) Comparison of CHH DNA methylation levels in regions with and without mapping of 21-, 22-, and 24-nt siRNAs in the leaf, root, and stem. (D) Distribution patterns of genes, TEs, and siRNAs in M. micrantha. The gray circle indicates the chromosomes. a, TE density; b, Gene density; 21-, 22-, and 24-nt siRNAs (from outer to inner) in the leaf (c-e), root (f-h), and stem (i-k). (E-F) Abundance distributions of 24-nt siRNAs in the gene body (E), in the TE (F), and the flanking region within 2 kb. (G) Genome browser snapshot showing CHH methylation and 24-nt siRNA changes in evm.model.contig60_pilon.265 across different organs
Fig. 8
Fig. 8
Identification and characterization of M. micrantha DMVs. (A) Summary of M. micrantha DMV characteristics. (B) IGV of a 16.8-kb DMV located on chromosome 2. (C) Percentage of conserved and non-conserved DMVs in leaf, root, and stem. (D) Genomic distribution of DMVs in different genomic regions in leaf, root, and stem. (E) Percentage of expressed (FPKM > 0) and non-expressed (FPKM = 0) genes, both genome-wide (all genes) and specifically within DMVs (DMV genes)

References

    1. Slotkin RK, Martienssen R. Transposable elements and the epigenetic regulation of the genome. Nat Rev Genet. 2007;8(4):272–85. - PubMed
    1. Robertson KD. DNA methylation and human disease. Nat Rev Genet. 2005;6(8):597–610. - PubMed
    1. Zhang X, Yazaki J, Sundaresan A, Cokus S, Chan SW, Chen H, Henderson IR, Shinn P, Pellegrini M, Jacobsen SE, et al. Genome-wide high-resolution mapping and functional analysis of DNA methylation in arabidopsis. Cell. 2006;126(6):1189–201. - PubMed
    1. Law JA, Jacobsen SE. Establishing, maintaining and modifying DNA methylation patterns in plants and animals. Nat Rev Genet. 2010;11(3):204–20. - PMC - PubMed
    1. Zhang H, Lang Z, Zhu JK. Dynamics and function of DNA methylation in plants. Nat Rev Mol Cell Biol. 2018;19(8):489–506. - PubMed

Substances

LinkOut - more resources