

Identification of metabolic reprogramming-related genes as potential diagnostic biomarkers for diabetic nephropathy based on bioinformatics
- PMID: 39609849
- PMCID: PMC11603941
- DOI: 10.1186/s13098-024-01531-5
Identification of metabolic reprogramming-related genes as potential diagnostic biomarkers for diabetic nephropathy based on bioinformatics
Abstract
Background: Diabetic nephropathy (DN) is a serious complication of diabetes mellitus, marked by progressive renal damage. Recent evidence indicates that metabolic reprogramming is crucial to DN pathogenesis, yet its underlying mechanisms are not well understood. This study aimed to examine how metabolic reprogramming-related genes (MRRGs) are differentially expressed and to explore their potential mechanisms in the development of DN.
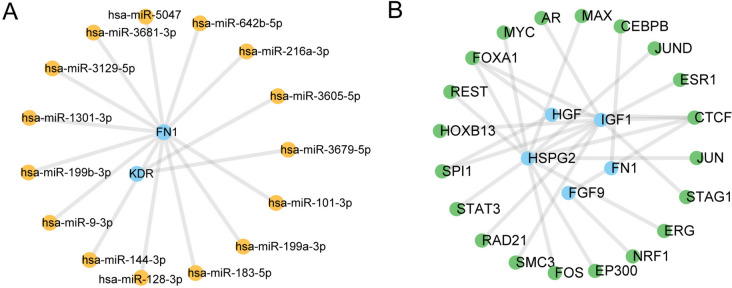
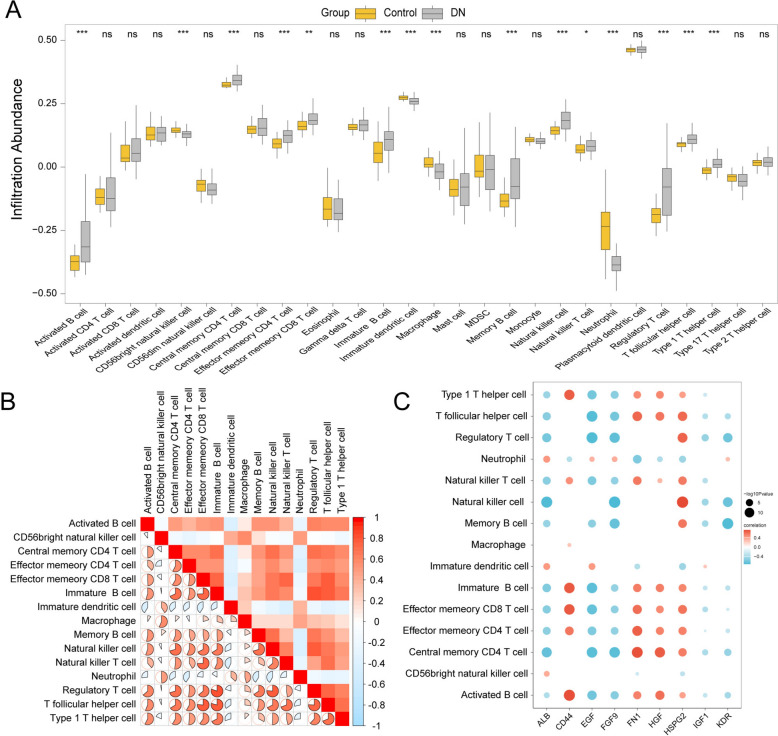
Methods: We analyzed the datasets GSE30528 and GSE96804 from the Gene Expression Omnibus (GEO), comprising 50 DN samples and 33 controls. MRRGs were sourced from GeneCards and PubMed. Data preprocessing included batch effect correction using the R package sva, followed by normalization and differential expression analysis with limma (|logFC|> 0.5, adj.p < 0.05). Functional enrichment analyses (GO, KEGG, GSEA) were performed using clusterProfiler. Protein-protein interaction (PPI) networks were constructed via STRING, identifying hub genes through CytoHubba. Regulatory networks (mRNA-TF, mRNA-miRNA) were derived from ChIPBase and StarBase. Validation of hub genes and ROC analysis assessed diagnostic performance. ssGSEA quantified immune cell infiltration.
Results: Our analysis identified 708 differentially expressed genes (DEGs), including 119 metabolic reprogramming-related DEGs (MRRDEGs). Enrichment analyses revealed significant roles for MRRDEGs in processes such as wound healing and pathways like MAPK signaling. The PPI network identified nine hub genes: FN1, CD44, KDR, EGF, HSPG2, HGF, FGF9, IGF1, and ALB, which exhibited high diagnostic accuracy (AUC 0.7 to 0.9). Notably, FN1 and CD44 showed significant association with renal fibrosis and could serve as potential biomarkers for early diagnosis and therapeutic targets in DN. Immune infiltration analysis showed notable differences in immune cell composition between DN and control samples.
Conclusion: This study identifies hub genes such as FN1 and CD44, with potential diagnostic value in DN. It also reveals immune cell infiltration differences between DN patients and controls, offering insights into disease progression and potential therapeutic targets.
Keywords: Bioinformatics; Biomarker; Diabetic nephropathy; Metabolic reprogramming; Metabolic reprogramming-related genes.
© 2024. The Author(s).
Conflict of interest statement
Declarations. Ethics approval and consent to participate: The studies involving human participants were reviewed and approved by the original studies. Consent for publication: Not applicable. Competing interests: The authors declare no competing interests.
Figures


Similar articles
-
Integrating bioinformatics and machine learning to identify glomerular injury genes and predict drug targets in diabetic nephropathy.Sci Rep. 2025 May 15;15(1):16868. doi: 10.1038/s41598-025-01628-5. Sci Rep. 2025. PMID: 40374840 Free PMC article.
-
Screening of the Key Genes and Signalling Pathways for Diabetic Nephropathy Using Bioinformatics Analysis.Front Endocrinol (Lausanne). 2022 Jul 12;13:864407. doi: 10.3389/fendo.2022.864407. eCollection 2022. Front Endocrinol (Lausanne). 2022. PMID: 35923621 Free PMC article.
-
Identifying C1QB, ITGAM, and ITGB2 as potential diagnostic candidate genes for diabetic nephropathy using bioinformatics analysis.PeerJ. 2023 May 25;11:e15437. doi: 10.7717/peerj.15437. eCollection 2023. PeerJ. 2023. PMID: 37250717 Free PMC article.
-
Integrative analyses of biomarkers and pathways for diabetic nephropathy.Front Genet. 2023 Apr 11;14:1128136. doi: 10.3389/fgene.2023.1128136. eCollection 2023. Front Genet. 2023. PMID: 37113991 Free PMC article.
-
Identification of Lipotoxicity-Related Biomarkers in Diabetic Nephropathy Based on Bioinformatic Analysis.J Diabetes Res. 2024 May 14;2024:5550812. doi: 10.1155/2024/5550812. eCollection 2024. J Diabetes Res. 2024. PMID: 38774257 Free PMC article.
Cited by
-
Development and validation of transient receptor potential channel-related signature for predicting prognosis in patients with lung adenocarcinoma.Oncol Lett. 2025 Jul 29;30(4):464. doi: 10.3892/ol.2025.15210. eCollection 2025 Oct. Oncol Lett. 2025. PMID: 40787424 Free PMC article.
-
Identification and evaluation of metabolic mRNAs and key miRNAs in colorectal cancer liver metastasis.Cancer Cell Int. 2025 Jul 16;25(1):265. doi: 10.1186/s12935-025-03903-x. Cancer Cell Int. 2025. PMID: 40671011 Free PMC article.
-
Integrating bioinformatics and machine learning to identify glomerular injury genes and predict drug targets in diabetic nephropathy.Sci Rep. 2025 May 15;15(1):16868. doi: 10.1038/s41598-025-01628-5. Sci Rep. 2025. PMID: 40374840 Free PMC article.
References
-
- Shan S, Luo Z, Yao L, Zhou J, Wu J, Jiang D, Ying J, Cao J, Zhou L, Li S, et al. Cross-country inequalities in disease burden and care quality of chronic kidney disease due to type 2 diabetes mellitus, 1990–2021: findings from the global burden of disease study 2021. Diabetes Obes Metab. 2024;26(12):5950–9. - PubMed
-
- The Diabetes Control and Complications (DCCT) Research Group. Effect of intensive therapy on the development and progression of diabetic nephropathy in the Diabetes Control and Complications Trial. Kidney Int. 1995;47(6):1703–20. - PubMed
LinkOut - more resources
Full Text Sources
Miscellaneous
