. 2024 Nov 28;22(1):1079.
doi: 10.1186/s12967-024-05802-7.

Diagnostic potential of salivary microbiota in persistent pulmonary nodules: identifying biomarkers and functional pathways using 16S rRNA sequencing and machine learning

Affiliations

Diagnostic potential of salivary microbiota in persistent pulmonary nodules: identifying biomarkers and functional pathways using 16S rRNA sequencing and machine learning

Xiao Zeng et al. J Transl Med. .

Abstract

Background: The aim of this study was to explore the microbial variations and biomarkers in the oral environment of patients with persistent pulmonary nodules (pPNs) and to reveal the potential biological functions of the salivary microbiota in pPNs.

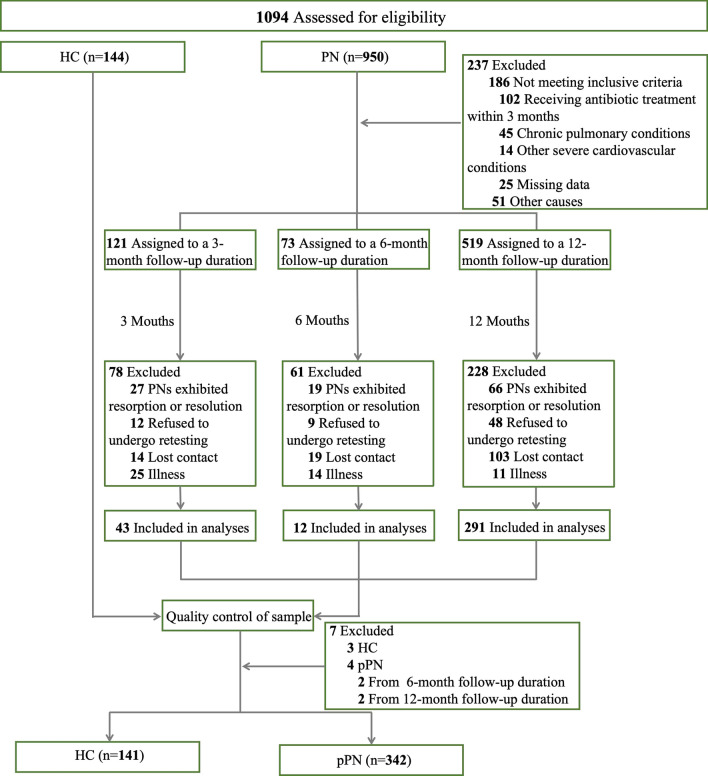
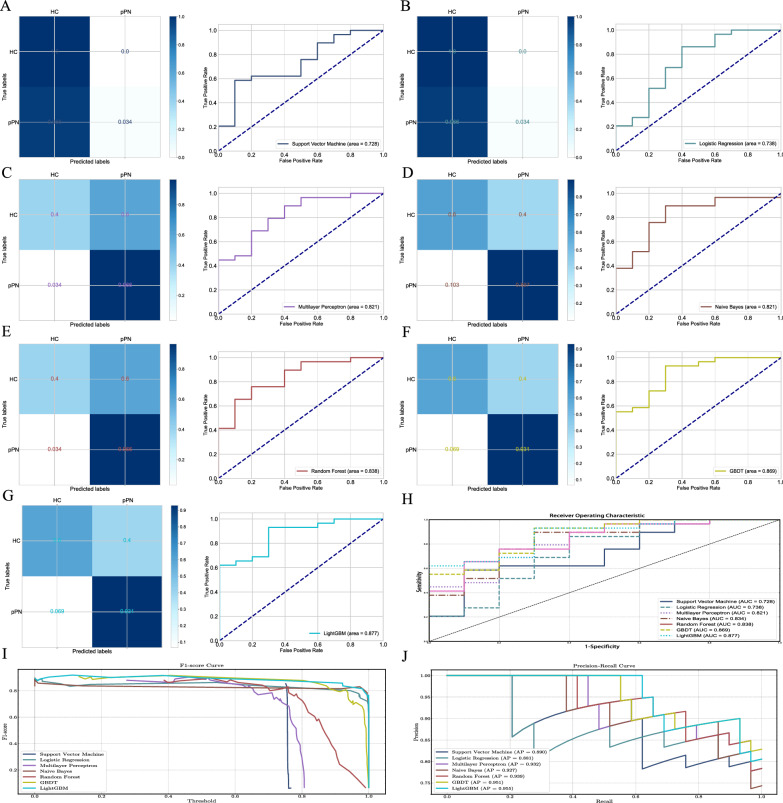
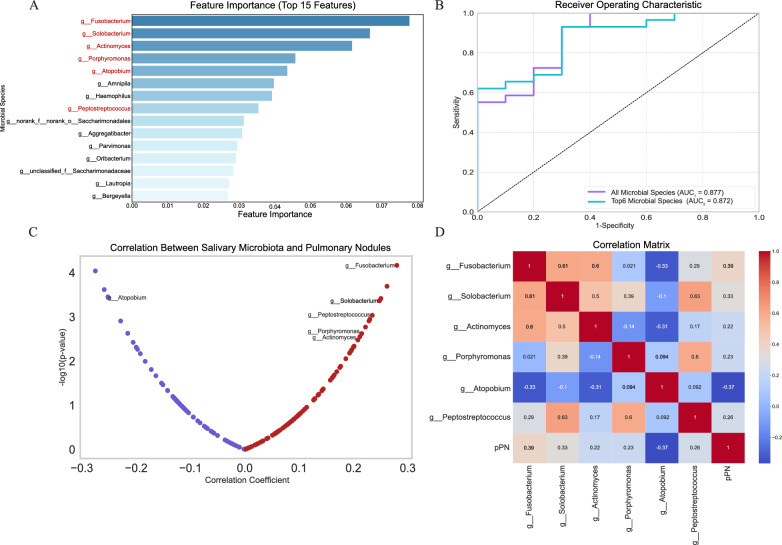
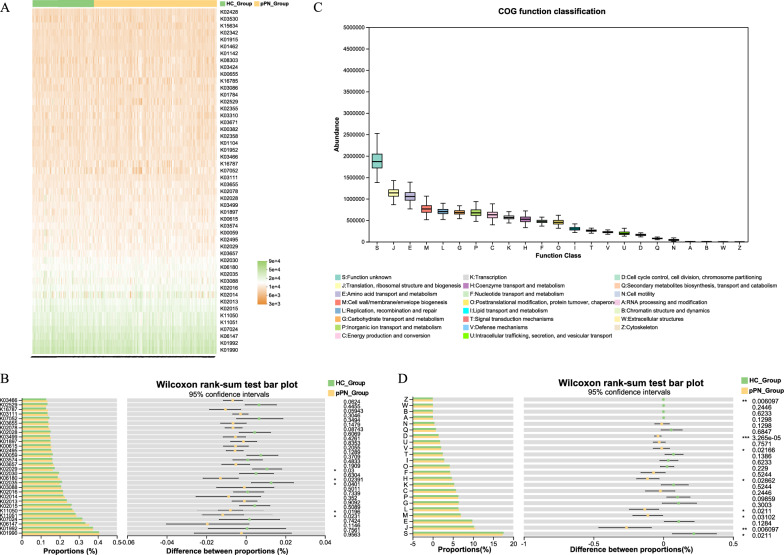
Materials and methods: This study included a total of 483 participants (141 healthy controls and 342 patients with pPNs) from June 2022 and January 2024. Saliva samples were subjected to sequencing of the V3-V4 region of the 16S rRNA gene to assess microbial diversity and differential abundance. Seven advanced machine learning algorithms (logistic regression, support vector machine, multi-layer perceptron, naïve Bayes, random forest, gradient boosting decision tree, and LightGBM) were utilized to evaluate performance and identify key microorganisms, with fivefold cross-validation employed to ensure robustness. The Shapley Additive exPlanations (SHAP) algorithm was employed to explain the contribution of these core microbiotas to the predictive model. Additionally, the PICRUSt2 algorithm was used to predict the microbial functions.

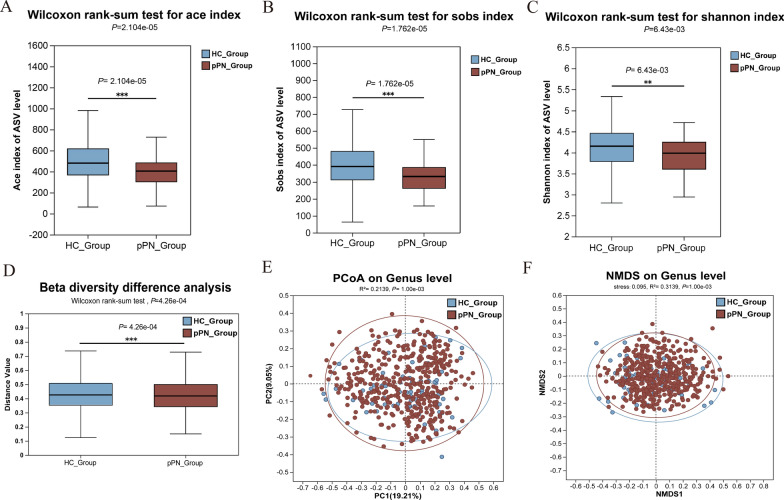
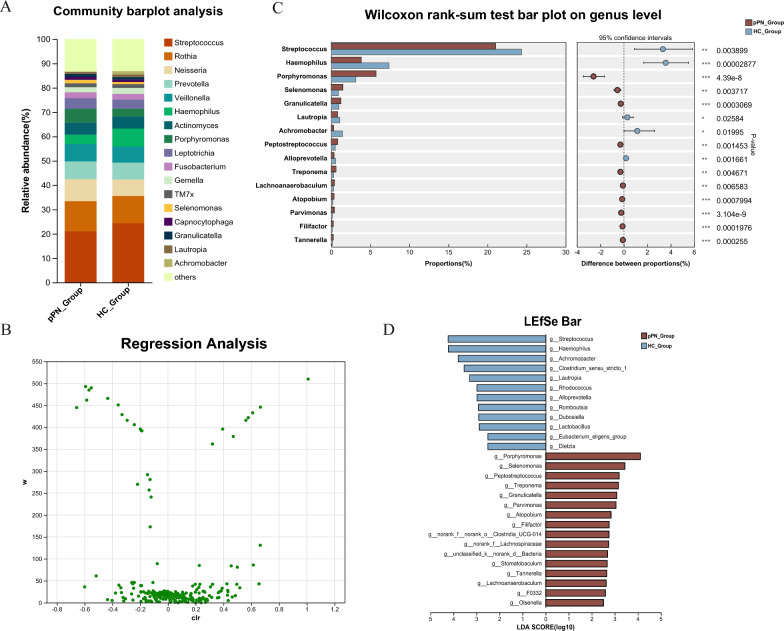
Results: The salivary microbial composition in pPNs group showed significantly lower α- and β-diversity compared to healthy controls. A high-accuracy LightGBM model was developed, identifying six core genera-Fusobacterium, Solobacterium, Actinomyces, Porphyromonas, Atopobium, and Peptostreptococcus-as pPNs biomarkers. Additionally, a visualization pPNs risk prediction system was developed. The immune responses and metabolic activities differences in salivary microbiota between the patients with pPNs and healthy controls were revealed.

Conclusions: This study highlights the potential clinical applications of the salivary microbiota for enable earlier detection and targeted interventions, offering significant promise for advancing clinical management and improving patient outcomes in pPNs.

Keywords: 16S rRNA sequencing; Biomakers; Lung cancer; Machine learning; Microbiota; Persistent pulmonary nodules.


Conflict of interest statement

Declarations. Ethics approval and consent to participate: This study was approved by the Ethics Committee of the Affiliated Hospital of Chengdu University of Traditional Chinese Medicine (Ethics Approval No. 2022KL-051) and registered in the Chinese Clinical Trial Registry (Registration No. ChiCTR2200062140). Written informed consent was obtained from all participants. Competing interests: The authors declare that they have no competing interests authors' contributions.

Figures

Fig. 1
Fig. 1
Flow diagram of the study
Fig. 2
Fig. 2
α-and β-diversity of salivary microbial communities in HC Group and pPN Group. A Ace index of salivary microbiota in both groups. B Sobs index of salivary microbiota in both groups. C Shannon index of salivary microbiota in both groups. D Intergroup differences in β-diversity of salivary microbiota. E, F Comparison of salivary microbial communities between HC Group and pPN Group using PCoA and NMDS based on Bray–Curtis distance (E, ANOSIM R2 = 0.2139, P = 0.001, F, ANOSIM R2 = 0.3139, P = 0.001). PCoA principal coordinate analysis, NMDS non-metric multidimensional scaling. P < 0.05 (*), P < 0.01 (**), P < 0.001 (***)
Fig. 3
Fig. 3
Differences in microbial community compositions between pPN Group and HC group. A Community bar plot displaying the percentage of community abundance of salivary microbiotas at the genus level between the two groups; B ANCOM differential abundance volcano plot showing significant differences in each ASV feature at the genus level between the two groups. The y-axis value represents the empirical distribution of W; the x-axis value represents the clr-transformed mean difference in abundance (between groups). Positive x-axis values indicate genus-level enriched in the pPN group, while negative x-axis values indicate genus-level enriched in the HC group. C Comparison of microbial differences between the two groups using intergroup difference testing (P value: Wilcoxon rank-sum test). D LEfSe analysis comparing microbial enrichment differences between the two groups (LEfSe score > 2.0). w: the number of times each feature was identified as significantly different in intergroup comparisons. clr centered log ratio, LDA linear discriminant analysis
Fig. 4
Fig. 4
Performance evaluation of seven predictive models based on salivary microbiota features. AG. Normalized confusion matrices and corresponding AUC for LR (A), SVM (B), MLP (C), NB (D), RF (E), GBDT (F), and LightGBM (G). The confusion matrices consist of False Positives, False Negatives, True Positives, and True Negatives. H Comparison of AUC among the seven predictive models, with AUC reflecting the performance of the binary classification models. I Comparison of the F1 scores among the seven predictive models. J Comparison of the Precision-Recall Curves among the seven predictive models. F1 score and Precision-Recall Curve are comprehensive metrics for evaluating model performance, with a larger area under the curve indicating better and more stable model performance. LR logistic regression, SVM support vector machine, MLP multi-layer perceptron, NB naïve Bayes, RF random forest, GBDT gradient boosting decision tree, LightGBM Light Gradient Boosting Machine, AUC the area under the receiver operating characteristic curve
Fig. 5
Fig. 5
Predictive microbial biomarkers for pPNs. A Feature importance plot displaying the top 15 genera ranked by importance scores using the LightGBM model; the alues represent the importance scores of each genus. B Comparison of the test set AUC for all microbial features versus the top 6 microbial features (AUC1 vs AUC2). C Correlation Volcano Plot showing the correlation between salivary microbiota genera and pPNs. The x-axis represents the correlation coefficient, and the y-axis represents − log10 (P value). Colors range from blue to red, indicating the transition from negative to positive correlation. D Heat map showing the correlation between 6 genera and pPNs. Colors range from blue to red, indicating the transition from negative to positive correlation. AUC the area under the receiver operating characteristic curve
Fig. 6
Fig. 6
SHAP Algorithm Explanation of Important Features. A SHAP summary plots showing the contribution of 6 genera to the model output. Positive SHAP values indicate an increased likelihood of the predicted outcome, while negative SHAP values indicate a decreased likelihood. The y-axis represents the feature importance ranking. Each point represents a case in the dataset, with the color indicating the feature value, blue representing the lowest range. B SHAP force plot explaining a single sample correctly classified as HC group, visually illustrating the contribution of each feature to the prediction. C SHAP force plot for a sample correctly classified as pPN group, visually illustrating the contribution of each feature to the prediction. D pPNs visualization risk prediction system. The left section allows input of data for six core microbiotas, while the right section presents the results, including the risk probability of pPNs and the contribution of feature variables to this probability. Red arrows indicate features that positively contribute to the prediction value, while blue arrows indicate features that negatively contribute. The length of the arrows represents the magnitude of the feature contribution, with the sum determining the final prediction value. SHAP SHapley Additive exPlanations
Fig. 7
Fig. 7
Predicted microbiota functions using the PICRUSt2 algorithm. A Heatmap displaying enriched KEGG pathways between the HC and pPN groups, with colors ranging from orange to green, indicating low to high correlation. B Bar chart displaying KEGG pathways with significant differences between the HC and pPN groups. C Box plot showing the distribution differences of various COG functional categories between the sample groups. D Bar chart displaying COG pathways with significant differences between the HC and pPN groups. P < 0.05 (*), P < 0.01 (**), P < 0.001 (***). KEGG Kyoto Encyclopedia of Genes and Genomes, COG Clusters of Orthologous Groups

References

    1. MacMahon H, Naidich DP, Goo JM, Lee KS, Leung ANC, Mayo JR, et al. Guidelines for management of incidental pulmonary nodules detected on CT images: from the Fleischner Society 2017. Radiology. 2017;284:228–43. - PubMed
    1. Wahidi MM, Govert JA, Goudar RK, Gould MK, McCrory DC. Evidence for the treatment of patients with pulmonary nodules: when is it lung cancer?: ACCP evidence-based clinical practice guidelines (2nd edition). Chest. 2007;132:94S-107S. - PubMed
    1. Wiener RS, Gould MK, Woloshin S, Schwartz LM, Clark JA. “The thing is not knowing”: patients’ perspectives on surveillance of an indeterminate pulmonary nodule. Health Expect. 2015;18:355–65. - PMC - PubMed
    1. Freiman MR, Clark JA, Slatore CG, Gould MK, Woloshin S, Schwartz LM, et al. Patients’ knowledge, beliefs, and distress associated with detection and evaluation of incidental pulmonary nodules for cancer: results from a multicenter survey. J Thorac Oncol. 2016;11:700–8. - PMC - PubMed
    1. Goto T. Microbiota and lung cancer. In: Seminars in cancer biology. Amsterdam: Elsevier; 2022. p. 1–10. - PubMed

LinkOut - more resources