. 2024 Nov 28;25(1):300.
doi: 10.1186/s13059-024-03439-9.

Genetic-by-age interaction analyses on complex traits in UK Biobank and their potential to identify effects on longitudinal trait change

Affiliations

Genetic-by-age interaction analyses on complex traits in UK Biobank and their potential to identify effects on longitudinal trait change

Thomas W Winkler et al. Genome Biol. .

Abstract

Background: Genome-wide association studies (GWAS) have identified thousands of loci for disease-related human traits in cross-sectional data. However, the impact of age on genetic effects is underacknowledged. Also, identifying genetic effects on longitudinal trait change has been hampered by small sample sizes for longitudinal data. Such effects on deteriorating trait levels over time or disease progression can be clinically relevant.

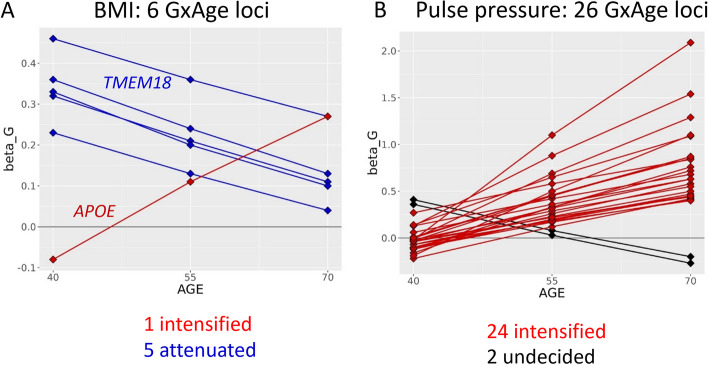
Results: Under certain assumptions, we demonstrate analytically that genetic-by-age interaction observed in cross-sectional data can be indicative of genetic association on longitudinal trait change. We propose a 2-stage approach with genome-wide pre-screening for genetic-by-age interaction in cross-sectional data and testing identified variants for longitudinal change in independent longitudinal data. Within UK Biobank cross-sectional data, we analyze 8 complex traits (up to 370,000 individuals). We identify 44 genetic-by-age interactions (7 loci for obesity traits, 26 for pulse pressure, few to none for lipids). Our cross-trait view reveals trait-specificity regarding the proportion of loci with age-modulated effects, which is particularly high for pulse pressure. Testing the 44 variants in longitudinal data (up to 50,000 individuals), we observe significant effects on change for obesity traits (near APOE, TMEM18, TFAP2B) and pulse pressure (near FBN1, IGFBP3; known for implication in arterial stiffness processes).

Conclusions: We provide analytical and empirical evidence that cross-sectional genetic-by-age interaction can help pinpoint longitudinal-change effects, when cross-sectional data surpasses longitudinal sample size. Our findings shed light on the distinction between traits that are impacted by age-dependent genetic effects and those that are not.

Keywords: Blood pressure; GWAS; Genetic-by-age interaction; Lipids; Longitudinal; Obesity; UK Biobank.


Conflict of interest statement

Declarations. Ethics approval and consent to participate: Not applicable. Consent for publication: Not applicable. Competing interests: The authors declare that they have no competing interests.

Figures

Fig. 1
Fig. 1
Relationship between longitudinal and cross-sectional genetic-by-age interaction GWAS models. The figure illustrates the similarity between genetic effects on annual trait change (estimated using longitudinal data from two timepoints) and genetic-by-age interaction effects (estimated from cross-sectional data) and states the assumptions for the equivalence. The figure demonstrates the genotype effects on the example of BMI for individuals with homozygous a/a (no time/age-dependency, no BMI effect) compared to individuals with heterozygous A/a genotypes (time/age-dependent BMI effect)
Fig. 2
Fig. 2
Approaches to identify longitudinal change effects. Shown is the workflow of three approaches considered to identify annual change effects: (i) the 1-stage GWAS on GxAge approach in cross-sectional data (blue; assuming equivalence of genetic-by-age interaction and annual change effects; involves genetic-by-age interaction testing at genome-wide significance, PGxAge < 5 × 10−8, and a 2-step approach focused on variants with genome-wide significant marginal effects, P < 5 × 10−8; then PGxAge < 0.05/Meff, corrected for the number of effective tests among marginally associated variants); (ii) the 2-stage GWAS on GxAgeChange approach that includes additional validation for annual change effects in independent longitudinal data (magenta); and (iii) the 1-stage GWAS on change approach in longitudinal data (green; involves annual change association testing at genome-wide significance, PChange < 5 × 10.−8, and a 2-step approach focused on variants with genome-wide significant marginal effects, PGxAge < 0.05/Meff)
Fig. 3
Fig. 3
Power to identify genetic-by-age interaction and longitudinal change effects. Shown are power curves for genetic-by-age interaction and annual change effects on A BMI, B LDL-C, and C PP. Power is shown for the three approaches: the 1-stage GWAS on GxAge approach in cross-sectional data (blue), the 2-stage GWAS on GxAgeChange approach that includes additional validation for annual change effects in independent longitudinal data (magenta), and the 1-stage GWAS on change approach in longitudinal data (green). For each trait, the left panel shows power over varying effect size (varied from zero to 25% of a median marginal genetic effect on the trait; purple vertical dotted line denotes 10% of the medium marginal effect) while keeping cross-sectional and longitudinal sample sizes constant at UKB sample sizes for the trait (Table 1). The right panel shows power of varying longitudinal-to-total sample size ratios (f), while keeping total sample size constant at the UKB trait sample size (Table 1; Nlong = f*Ntotal; Ncross = Ntotal − Nlong; the red vertical dotted line denotes f as given in UKB for the respective trait) and keeping the genetic effect constant at the 10% medium marginal effect size (purple dotted line in the left panel). Power was calculated for an allele frequency of 30%, based on analytical formulas given in Additional file 2: Note S2 and assumptions given in “Methods.” Power computations for the remaining traits are shown in Additional file 2: Fig. S1
Fig. 4
Fig. 4
Cross-sectional genetic-by-age interaction GWAS and longitudinal GWAS results for 8 complex traits. For the eight traits, shown are the quantile–quantile (QQ) plots for the genetic-by-age interaction P values (blue; testing in cross-sectional UKB data excluding individuals with longitudinal data available; approx. sample size shown in figure) and for the association P values for annual change (green; testing in longitudinal UKB data; approx. sample size shown in figure). Indicated in blue circles are the number of significant genetic-by-age interaction loci (d > 500 kb and r2 < 0.01) identified in the cross-sectional data (PGxAge < 5 × 10−8, or by the 2-step approach focused on marginal effects, P < 5 × 10−8; then PGxAge < 0.05/Meff). Green are QQ plots for the annual trait change association P values from the respective longitudinal UKB data
Fig. 5
Fig. 5
Manhattan plots of genetic-by-age interaction for BMI, LDL-C, and pulse pressure. The figure shows the genome-wide Manhattan plots of genetic-by-age interaction P values for A BMI, B LDL-C, and C pulse pressure. These are based on cross-sectional data from UKB excluding individuals with longitudinal data (cross-sectional N > 340,000). Significant genetic-by-age interaction loci (PGxAge < 5 × 10−8; or 2-step significant: marginal P < 5 × 10.8 and PGxAge < 0.05/Meff) are colored in blue, green, and magenta. The different coloring indicates association of the index variant with annual trait-change in independent longitudinal data from UKB (longitudinal N up to 52,000): blue indicates lack of annual trait-change association (1-sided PChange ≥ 0.05), green indicates nominal-significant, directionally consistent annual trait-change effects (1-sided PChange < 0.05), and magenta indicates Bonferroni-corrected significant, directionally consistent annual trait-change effects (1-sided PChange < 0.05/MGxAge, corrected for the number of significant genetic-by-age interaction loci per trait)
Fig. 6
Fig. 6
Comparison of genetic-by-age interaction and annual change effect sizes. Shown is a comparison of genetic-by-age interaction effect sizes with annual change effect sizes for the change-validated loci A six BMI-loci and B 26 pulse pressure loci. The loci displayed significant genetic-by-age interaction in cross-sectional data (UKB, excluding individuals with longitudinal data available; PGxAge < 5 × 10−8 or PGxAge < 0.05/Meff for variants with marginal P < 5 × 10−8; Bonferroni-corrected at trait-level for the number of effective tests estimated by PCA, Meff). Loci that further showed significant genetic effects on annual trait change in independent longitudinal data are colored magenta (all at 1-sided Pchange < 0.05/MGxAge; Bonferroni-corrected at trait-level for the number of genetic-by-age interaction loci, MGxAge). The effect directions of the variants were aligned to marginally trait-increasing alleles. Solid circles indicate variants with genome-wide significant marginal effects (marginal P < 5 × 10.−8)
Fig. 7
Fig. 7
Direction of genetic-by-age interactions for BMI and pulse pressure. For the variants with significant genetic-by-age interaction, the figures show the genetic effect estimates on A BMI and B pulse pressure, at 40, 55, and 70 years of age. The age-specific genetic effects were based on the observed genetic main and genetic-by-age interaction effect sizes from the genetic-by-age interaction regression model and by substituting ages 40, 55, and 70 into the model. The effect directions were aligned to trait-increasing alleles
Fig. 8
Fig. 8
Tissue-specific enrichment of gene expression at pulse pressure loci. For the 26 genetic-by-age interaction loci (PGxAge < 5 × 10−8 or significant in the 2-step approach, Additional file 1: Table S3), shown are A the clustered gene expression heatmap for 54 GTEx (v8) tissue types for the FUMA mapped genes (value shown is average expression per label, log2 transformed), B results from tissue-specific differentially expressed gene set enrichment analyses by FUMA (upper bars; significant enrichments highlighted in red, FDR < 5%), and C enrichment of gene expression analysis results by DEPICT for selected tissues and cell-types (upper bars; significant enrichments highlighted in red, FDR < 5%). For comparison, shown in B and C, respectively, are FUMA and DEPICT tissue-specific enrichment analysis results for 26 pulse pressure loci without genetic-by-age interaction (lower bars in B, C; i.e., PMarginal < 5 × 10.−8 and PGxAge > 0.48, Additional file 1: Table S5). Detailed FUMA results are shown in Additional file 1: Table S9. Results on all tissues by DEPICT are shown in Additional file 1: Table S10 and Additional file 2: Fig. S6

Similar articles

Cited by

References

    1. Sollis E, Mosaku A, Abid A, Buniello A, Cerezo M, Gil L, et al. The NHGRI-EBI GWAS Catalog: knowledgebase and deposition resource. Nucleic Acids Res. 2023;51:D977–85. - PMC - PubMed
    1. Paternoster L, Tilling K, Davey SG. Genetic epidemiology and Mendelian randomization for informing disease therapeutics: conceptual and methodological challenges. PLoS Genet. 2017;13:1–9. - PMC - PubMed
    1. Ko S, German CA, Jensen A, Shen J, Wang A, Mehrotra DV, et al. GWAS of longitudinal trajectories at biobank scale. Am J Hum Genet. 2022;109:433–45. 10.1016/j.ajhg.2022.01.018. - PMC - PubMed
    1. Venkatesh SS, Ganjgahi H, Palmer DS, Coley K, Wittemans LBL, Nellaker C, et al. The genetic architecture of changes in adiposity during adulthood. medRxiv Prepr Serv Heal Sci. 2023; Available from: http://www.ncbi.nlm.nih.gov/pubmed/36711652%0A; http://www.pubmedcentral.nih.gov/articlerender.fcgi?artid=PMC9882550.
    1. Gorski M, Rasheed H, Teumer A, Thomas LF, Graham SE, Sveinbjornsson G, et al. Genetic loci and prioritization of genes for kidney function decline derived from a meta-analysis of 62 longitudinal genome-wide association studies. Kidney Int. 2022;102:624–39. - PMC - PubMed

Substances

LinkOut - more resources