. 2024 Nov 29;19(1):92.
doi: 10.1186/s13024-024-00781-1.

Seeding activity of skin misfolded tau as a biomarker for tauopathies

Affiliations

Seeding activity of skin misfolded tau as a biomarker for tauopathies

Zerui Wang et al. Mol Neurodegener. .

Abstract

Background: Tauopathies are a group of age-related neurodegenerative diseases characterized by the accumulation of pathologically hyperphosphorylated tau protein in the brain, leading to prion-like aggregation and propagation. They include Alzheimer's disease (AD), progressive supranuclear palsy (PSP), corticobasal degeneration (CBD), and Pick's disease (PiD). Currently, reliable diagnostic biomarkers that directly reflect the capability of propagation and spreading of misfolded tau aggregates in peripheral tissues and body fluids are lacking.

Methods: We utilized the seed-amplification assay (SAA) employing ultrasensitive real-time quaking-induced conversion (RT-QuIC) to assess the prion-like seeding activity of pathological tau in the skin of cadavers with neuropathologically confirmed tauopathies, including AD, PSP, CBD, and PiD, compared to normal controls.

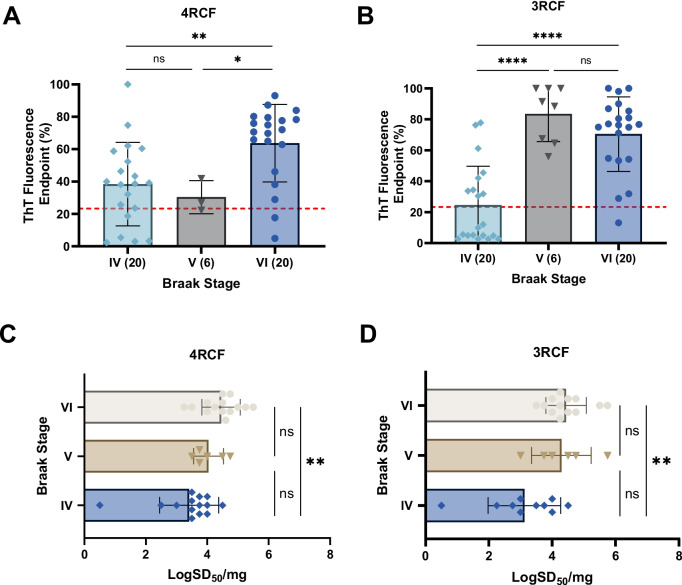
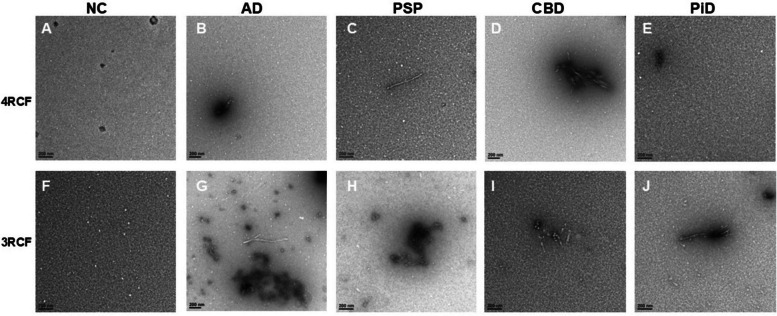
Results: We found that the skin tau-SAA demonstrated a significantly higher sensitivity (75-80%) and specificity (95-100%) for detecting tauopathy, depending on the tau substrates used. Moreover, the increased tau-seeding activity was also observed in biopsy skin samples from living AD and PSP patients examined. Analysis of the end products of skin-tau SAA confirmed that the increased seeding activity was accompanied by the formation of tau aggregates with different physicochemical properties related to two different tau substrates used.

Conclusions: Overall, our study provides proof-of-concept that the skin tau-SAA can differentiate tauopathies from normal controls, suggesting that the seeding activity of misfolded tau in the skin could serve as a diagnostic biomarker for tauopathies.

Keywords: Alzheimer’s disease; Real-time quaking-induced conversion (RT-QuIC); Seeding activity; Skin; Tau; Tauopathies.


Conflict of interest statement

Declarations. Ethics approval and consent to participate: All procedures and protocols were monitored and approved by the Institutional Review Boards (IRBs) of University Hospitals Cleveland Medical Center, Banner Sun Health Research Institute, and IRCCS Institute of Neurological Sciences of Bologna. Written informed consent was obtained from all living subjects undergoing skin biopsy or from family members for skin autopsy. For post-mortem sample collection, we obtained the specimens with respect to the wishes of the deceased and their family, following all legal and ethical guidelines. For skin biopsy procedures, all participants provided their informed consent prior to their inclusion in the study. Consent for publication: All participants in this study have provided written informed consent for their data and samples to be used in this research. Participants were also informed that the results of this study may be published and that all data would be fully anonymized to protect confidentiality. Competing interests: Authors declare that they have no competing interests.

Figures

Fig. 1
Fig. 1
Tau-seeding activity of skin samples from patients with tauopathies using 4RCF-based RT-QuIC. A Kinetic curves displaying the mean and standard deviation (SD) of tau-SA over time of skin samples from CBD (n = 5), AD (n = 46), PSP (n = 33), PiD (n = 6) and NC (n = 43). B Scatter plot illustrating the distribution of tau-SA across different tauopathies detected in panel A. C Lag phase, defined as the initial period before a significant increase in the ThT fluorescence intensity. D The end-point dilution analysis of quantitative tau-SA of skin samples from tauopathies. The half of maximal SA (SD50) was determined by Spearman-Kärber analyses and is shown as log SD50/mg skin tissue. E Receiver operating characteristic (ROC) curve analysis comparing tau-SA of skin samples between AD and control subjects, with an area under the curve (AUC) of 0.82. F ROC curve analysis comparing tau-SA of skin samples between total tauopathy and control subjects, with an AUC of 0.79. ns: p > 0.05; **: p < 0.01; ***: p < 0.001; ****: p < 0.0001
Fig. 2
Fig. 2
Tau-seeding activity of skin samples from patients with tauopathies using 3RCF-based RT-QuIC assay. A Kinetic curves displaying the mean and SD of tau-SA over time of skin samples from CBD (n = 5), AD (n = 46), PSP (n = 33), PiD (n = 6) and NC (n = 43). B Scatter plot illustrating the distribution of tau-SA across different tauopathies. C Comparison of lag phases of skin tau-SAA from different tauopathies and NC, same as above, as the initial delay before the ThT fluorescence intensity begins to rise. D The end-point dilution analysis of quantitative tau-SA of skin samples from various tauopathies. The half of maximal SA (SD50) determined by Spearman-Kärber analyses is shown as log SD50/mg skin tissue. E ROC curve analysis comparing skin tau-SA between AD and control subjects, with an AUC of 0.77. F ROC curve analysis comparing skin tau-SA between total tauopathy and control subjects, with an AUC of 0.72. *: p < 0.05; **: p < 0.01; ***: p < 0.001; ****: p < 0.0001
Fig. 3
Fig. 3
Correlation of tau-SA of skin samples from AD with their different Braak stages. Scatter plot of ThT fluorescence readings at end-points detected by RT-QuIC assays with the substrate 4RCF (A) or 3RCF (B) as a function of different Braak stages [IV (n = 20), V (n = 6) and VI (n = 20)]. Scatter plot of Braak stages with LogSD50/mg of skin tau-SA detected by RT-QuIC with the substrate 4RCF (C) or 3RCF (D), ns: p > 0.05; ** p < 0.01; ****p < 0.0001
Fig. 4
Fig. 4
Tau-SAA of skin samples from participants with AD, synucleinopathies, and NC using 4RCF-based RT-QuIC assay. Scatter plot illustrating the distribution of tau-SA at the endpoint fluorescence readings across skin samples from 21 cases with AD, different synucleinopathies including 6 cases with DLB, 6 with MSA and 10 with PD as well as 17 NCs. *: p < 0.05, **: p < 0.01, ***: p < 0.001; ****: p < 0.0001
Fig. 5
Fig. 5
Examination of tau-SA in biopsied skin samples from patients with AD and PSP. The scatter plot displays the endpoint ThT fluorescence percentage of skin tau-SA from AD (n = 16), PSP (n = 8), and NC (n = 10) detected by RT-QuIC using 4RCF (A) and 3RCF (B) as the substrates. Correlation analysis between MMSE and skin tau RT-QuIC seeding activity is shown in C (4RCF) and D (3RCF) **: p < 0.01; ***: p < 0.001
Fig. 6
Fig. 6
Characterization of RT-QuIC end products of skin tau from tauopathies using filter-trap assay probed with anti-3R (RD3) and anti-4R (RD4) tau antibodies. Scatter plots of ThT fluorescence values skin-tau RT-QuIC end products of selected samples from PSP (n = 4), AD (n = 4), CBD (n = 4), PiD (n = 4) and NC (n = 4), with 4RCF (A) and 3RCF(B) as the substrates. The filter-trap assay (FTA) of 3RCF-/4RCF-based RT-QuIC end products of skin samples from different tauopathies including PSP, AD, CBD, PiD and NC (4 cases/group) probed with RD4 (C) or RD3 (D) antibodies. Quantitative densitometry of FTA-dot blotting with 4RCF- (E) and 3RCF (F) -based RT-QuIC end products from panels (C) and (D). Correlation analysis between FTA-trapped protein dot intensity and skin tau-SA of 4RCF- (G)/3RCF(H) -based RT-QuIC end products
Fig. 7
Fig. 7
Transmission electron microscopy of SAA end products of skin misfolded tau from AD, other tauopathies and normal controls. Panels (A) through (E) show the representative images of tau 4RCF-based RT-QuIC end-products with normal controls (NC, A), AD (B), PSP (C), CBD (D) and PiD (E). Panels (F) through (J) exhibit the representative images of tau 3RCF-based RT-QuIC end-products with NC (F), AD (G), PSP (H), CBD (I) and PiD (J). Scale bars: 200 nm
Fig. 8
Fig. 8
PK-resistance and conformational stability assay of the end products of 4RCF-/3RCF-based tau RT-QuIC assay of skin samples from AD and controls. A-C Western blotting of PK titration of 4RCF-based SAA end-products of AD and non-AD skin samples and quantitative analysis of intensity of PK-resistant tau fragments with different molecular weights by densitometry. D-F: Western blotting of PK titration of 3RCF-based SAA end products of AD and non-AD skin samples and quantitative analysis of intensity of PK-resistant tau fragments with different molecular weights by densitometry. Probed with RD3 and RD4 antibodies against 3R or 4R tau isoforms, respectively. The 4RCF-(G)/3RCF(J)-based RT-QuIC end products of AD and non-AD skin samples were treated with different concentrations of GdnHCl and followed by PK digestion prior to western blotting probed with anti-tau antibodies RD4 against 4R (G) and RD3 against 3R (J) tau fragments. Quantitative analysis of GdnHCl/PK-resistant protein band intensity with different molecular weights by densitometry on blots (G and J). H and I for 4R tau; K and L: for 3R tau

Update of

References

    1. Coughlin D, Irwin DJ. Emerging Diagnostic and therapeutic strategies for tauopathies. Curr Neurol Neurosci Rep. 2017;17:72. - PMC - PubMed
    1. Prusiner SB. Biology and genetics of prions causing neurodegeneration. Annu Rev Genet. 2013;47:601–23. - PMC - PubMed
    1. Goedert M, Spillantini MG, Jakes R, Rutherford D, Crowther RA. Multiple isoforms of human microtubule-associated protein tau: sequences and localization in neurofibrillary tangles of Alzheimer’s disease. Neuron. 1989;3:519–26. - PubMed
    1. Liu L, Drouet V, Wu JW, Witter MP, Small SA, Clelland C, et al. Trans-synaptic spread of tau pathology in vivo. PLoS One. 2012;7:e31302. - PMC - PubMed
    1. Zhang K, Mizuma H, Zhang X, Takahashi K, Jin C, Song F, et al. PET imaging of neural activity, β-amyloid, and tau in normal brain aging. Eur J Nucl Med Mol Imaging. 2021;48:3859–71. - PubMed

LinkOut - more resources