. 2024 Nov 28;20(1):32.
doi: 10.1186/s12993-024-00260-z.

Uncovering hidden prosocial behaviors underlying aggression motivation in mice and young children

Affiliations

Uncovering hidden prosocial behaviors underlying aggression motivation in mice and young children

Chih-Lin Lee et al. Behav Brain Funct. .

Abstract

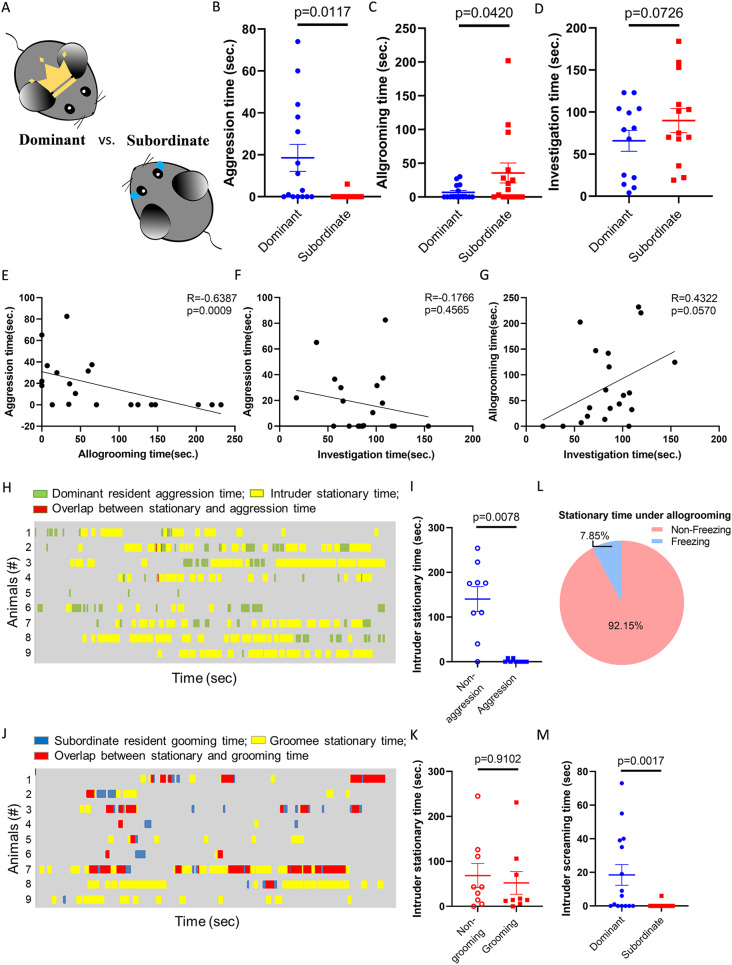
Background: Animals exhibit a wide range of social behaviors, including positive actions that promote social cohesion and negative behaviors associated with asserting dominance. While these behaviors are often viewed as opposites, they can also exist independently or coexist in complex ways, necessitating further investigation into their interrelationships.

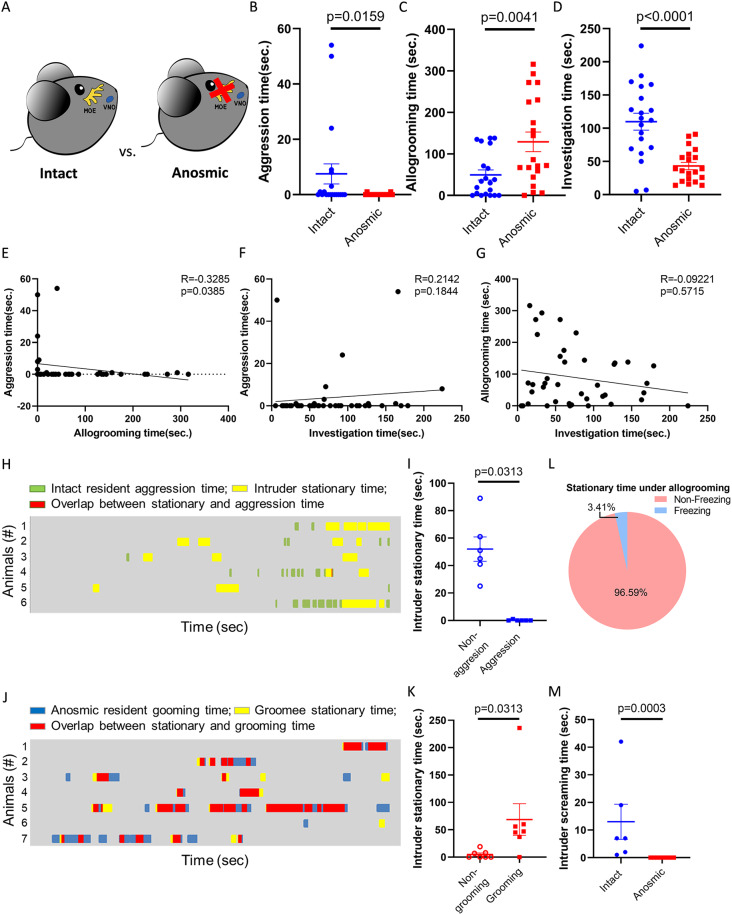
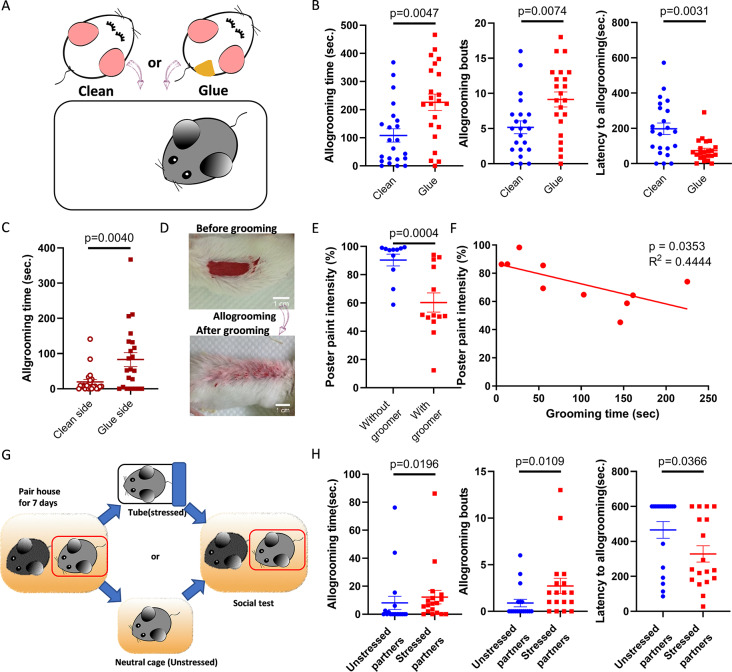
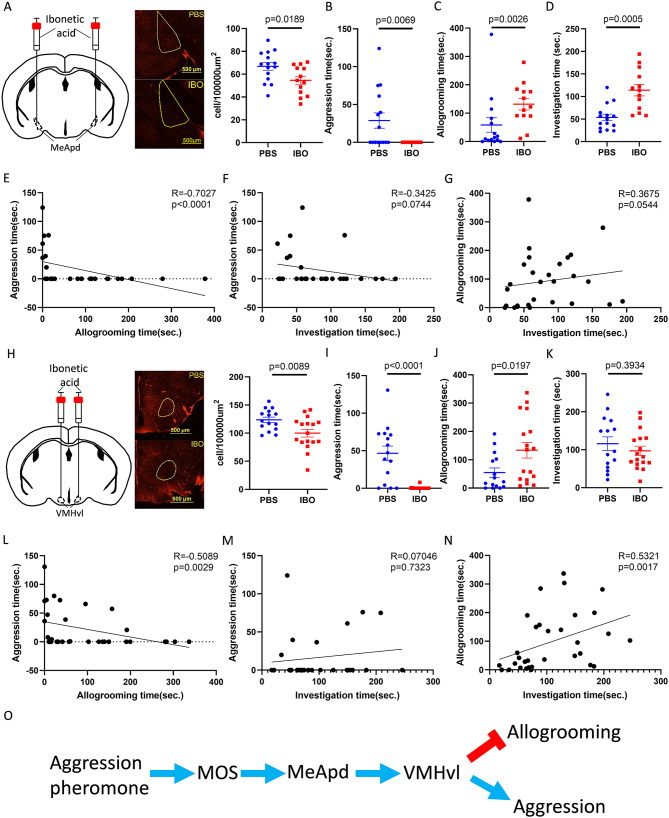
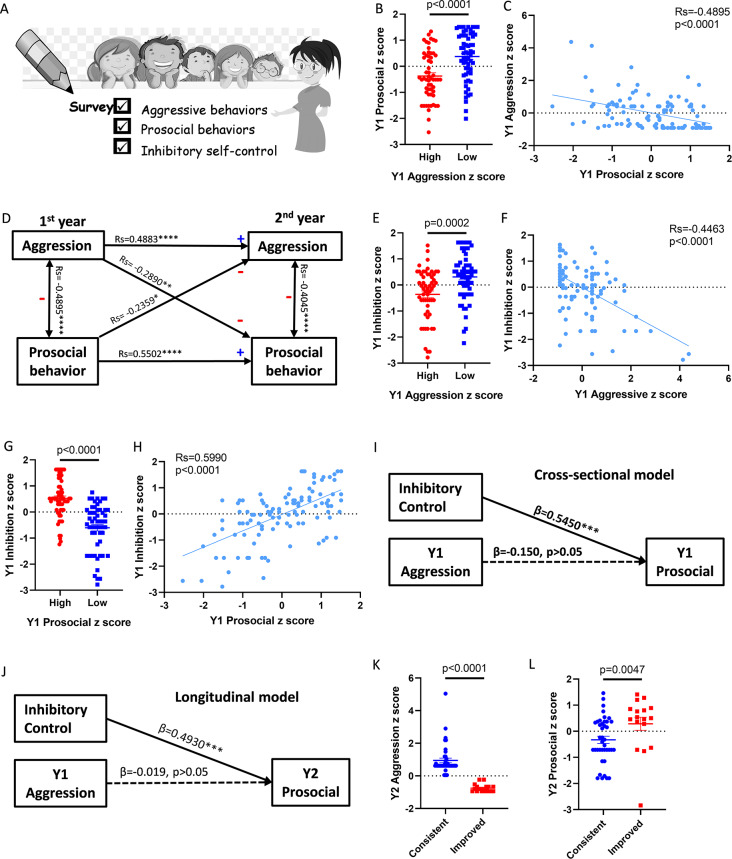
Results: To study the interplay between these two types of behaviors, we examined mouse social behaviors using resident-intruder assays and revealed a negative correlation between social aggression and prosocial allogrooming. Suppressing aggressive motivation through various manipulations, including social subordination, olfaction ablation, and inhibition of aggressive neural circuits, led to an increased display of allogrooming behavior. The mouse findings prompted us to further explore the relationship between aggression and prosocial behaviors in preschool children. Similarly, we observed a negative association between aggression and prosocial behaviors, which were potentially influenced by their inhibitory control abilities.

Conclusions: Through this cross-species study, we uncovered the inhibitory impact of aggressive neural circuits on mouse allogrooming and established a link between aggression and prosocial behaviors in children. These insights offer valuable implications for understanding and potentially influencing social interactions in both animal and human contexts, with potential applications in preschool education practices.

Keywords: Mouse allogrooming; Prosocial behaviors; Social aggression; Social behaviors.


Conflict of interest statement

Declarations. Ethics approval and consent to participate: All animal procedures were in compliance with institutional guidelines established and approved by the Institutional Animal Care and Use Committee of National Tsing Hua University 107043. Children studies were approved by the National Tsing Hua University Research Ethics committee 11206HT093). Consent for publication: Not applicable. Competing interests: The authors declare no competing interests.

Figures

Fig. 1
Fig. 1
Social subordination induced mouse allogrooming. (A) Comparison between dominant and subordinate residents individually in the resident-intruder assay. (B) Aggression time of dominant or subordinate residents (Wilcoxon test, n = 15 pairs). (C) Allogrooming time of dominant or subordinate residents (Wilcoxon test, n = 15 pairs). (D) Social investigation time of dominant or subordinate residents (Paired t-test, n = 13 pairs). (E) Correlation between aggression and allogrooming time of pair-housing mice toward intruders (Spearman correlation, n = 20). (F) Correlation between aggression and investigation time of pair-housing mice toward intruders (Spearman correlation, n = 20). (G) Correlation between allogrooming and investigation time of pair-housing mice toward intruders (Spearman correlation, n = 20). (H) Raster plot presenting the aggression of dominant residents and the stationary periods of intruders (n = 9). (I) Intruders’ stationary time under aggression or nonaggression behaviors of dominant residents (Wilcoxon test, n = 9 pairs). (J) Raster plot presenting the allogrooming of subordinate residents and the stationary periods of intruders (n = 9). (K) Intruders’ stationary time under grooming or nongrooming behaviors of subordinate residents (Wilcoxon test, n = 9). (L) Percentage of intruders’ freezing-like and non-freezing-like stationary time under subordinate residents’ allogrooming (n = 9). (M) Screaming time of intruders interacting with dominant or subordinate residents (Mann‒Whitney test, n = 15 pairs). Mean ± SEM
Fig. 2
Fig. 2
Elimination of olfaction resulted in mouse allogrooming. (A) Comparison between intact and anosmic residents who were treated with dichlobenil to ablate MOE in the resident-intruder assay. (B) Aggression time of intact or anosmic residents (Mann‒Whitney test, n = 20,20). (C) Allogrooming time of intact or anosmic residents (Mann‒Whitney test, n = 20,20). (D) Social investigation time of intact or anosmic residents (Unpaired t-test, n = 20,20). (E) Correlation between aggression and allogrooming time of intact and anosmic mice toward intruders (Spearman correlation, n = 40). (F) Correlation between aggression and investigation time of intact and anosmic mice toward intruders (Spearman correlation, n = 40). (G) Correlation between allogrooming and investigation time of intact and anosmic mice toward intruders (Spearman correlation, n = 40). (H) Raster plot presenting the aggression of intact residents and the stationary periods of intruders (n = 6). (I) Intruders’ stationary time under aggression or nonaggression behaviors of intact residents (Wilcoxon test, n = 6). (J) Raster plot presenting the allogrooming of anosmic residents and the stationary periods of intruders (n = 7). (K) Intruders’ stationary time under grooming or nongrooming behaviors of anosmic residents (Wilcoxon test, n = 7). (L) Percentage of intruders’ freezing-like and non-freezing-like stationary time under anosmic residents’ allogrooming (n = 7). (M) Screaming time of intruders interacting with intact or anosmic residents (Mann‒Whitney test, n = 6, 7). Mean ± SEM
Fig. 3
Fig. 3
Groomers engaged in allogrooming to clean and comfort the recipients. (A) Comparison of responses of residents treated with dichlobenil to clean intruders or intruders covered with unfamiliar materials (glue). (B) Allogrooming time, bouts and latency of anosmic residents to intruders with or without stick glue (time and latency, Mann‒Whitney test; bouts, Unpaired t-test, n = 22 pairs). (C) Allogrooming time on clean or glued sites of intruders (Wilcoxon test, n = 22 pairs). (D) Representative images showing the poster paint on anesthetized intruders before or after allogrooming provided by residents. (E) The paint intensity with or without groomer interaction (Mann‒Whitney test, n = 11,13). (F) Correlation between paint intensity and allogrooming time (Pearson correlation, n = 10). (G) Experimental scheme testing residents’ responses to distressed social partners. (H) The allogrooming time, bouts and latency of residents interacting with unstressed or distressed partners (Mann‒Whitney test, n = 18 pairs). Mean ± SEM
Fig. 4
Fig. 4
Suppressing aggression circuits enhanced mouse allogrooming. (A) Representative images and the density of neurons in MeApd injected with ibotenic acid (IBO) for lesion or PBS as control (Unpaired t-test, n = 15,13). (B) Aggression time of residents with PBS or IBO injection in MeApd (Mann‒Whitney test, n = 15,13). (C) Allogrooming time of residents with PBS or IBO injection in MeApd (Unpaired t-test, n = 15,13). (D) Social investigation time of residents with PBS or IBO injection in MeApd (Unpaired t-test, n = 15,13). (E) Correlation between aggression and allogrooming time of MeApd sham and lesion mice toward intruders (Spearman correlation, n = 28). (F) Correlation between aggression and investigation time of MeApd sham and lesion mice toward intruders (Spearman correlation, n = 28). (G) Correlation between allogrooming and investigation time of MeApd sham and lesion mice toward intruders (Spearman correlation, n = 28). (H) Representative images and the density of neurons in VMHvl injected with ibotenic acid (IBO) for lesion or PBS as control (Mann‒Whitney test, n = 15,17). (I) Aggression time of residents with PBS or IBO injection in the VMHvl (Mann‒Whitney test, n = 15,17). (J) Allogrooming time of residents with PBS or IBO injection in the VMHvl (Mann‒Whitney tes, n = 15,17). (K) Social investigation time of residents with PBS or IBO injection in the VMHvl (Unpaired t-test, n = 15,17). (L) Correlation between aggression and allogrooming time of VMHvl sham and lesion mice toward intruders (Spearman correlation, n = 32). (M) Correlation between aggression and investigation time of VMHvl sham and lesion mice toward intruders (Spearman correlation, n = 32). (N) Correlation between allogrooming and investigation time of VMHvl sham and lesion mice toward intruders (Spearman correlation, n = 32). (O) Inhibitory role of aggression circuits in mouse allogrooming. Mean ± SEM
Fig. 5
Fig. 5
Inhibitory control ability modulates negative relationship between aggression and prosocial behaviors in preschool children. (A) Teachers’ evaluation of children’s behaviors in the 1st (Y1) and the 2nd (Y2) years. (B) Prosocial z score of children with positive (high) or negative (low) aggression z score (Mann‒Whitney, n = 57,61). (C) Correlation between prosocial and aggression z scores (Spearman correlation, n = 118). (D) The cross-sectional and longitudinal relationships between aggression and prosocial behaviors. (E) Self-inhibition z score of children with positive (high) or negative (low) aggression z score (Mann‒Whitney, n = 57,61). (F) Correlation between self-inhibition and aggression z score (Spearman correlation, n = 118). (G) Self-inhibition z score of children with positive (high) or negative (low) prosocial z scores (Mann‒Whitney, n = 62,56). (H) Correlation between self-inhibition and prosocial z score (Spearman correlation, n = 118). (I) Cross-sectional model for the effect of aggression on prosocial behaviors after controlling inhibitory self-control (Hierarchical regression analysis, n = 118). (J) Longitudinal model for the effect of aggression on prosocial behaviors after controlling inhibitory self-control (hierarchical regression analysis, n = 118). (K) Y2 aggression z score in the consistent group (positive aggression score in both years) or improved group (positive aggression score in Y1 but negative aggression score in Y2) (Mann‒Whitney test, n = 40,17). (L) Y2 prosocial z score in the consistent group or improved group (Mann‒Whitney test, n = 40,17). Mean ± SEM

Similar articles

References

    1. Eron LD, Huesmann LR. The relation of prosocial behavior to the development of aggression and psychopathology. Aggressive Behav. 1984;10:201–11.
    1. Dugatkin LA. Principles of animal behavior. Third ed. W. W. Norton & Company, Inc.; 2014.
    1. Eivers AR, Brendgen M, Vitaro F, Borge AI. Concurrent and longitudinal links between children’s and their friends’ antisocial and prosocial behavior in preschool. Early Child Res Q. 2012;27:137–46.
    1. Pulkkinen L, Tremblay RE. Patterns of boys’ social adjustment in two cultures and at different ages: a longitudinal perspective. Int J Behav Dev. 1992;15:527–53.
    1. Feshbach S, Feshbach ND. Aggression and altruism: a personality perspective. Altruism and aggression: Biological and social origins, 189–217 (1986).

LinkOut - more resources