. 2024 Nov;532(11):e70000.
doi: 10.1002/cne.70000.

Myelinated Glial Cells: Their Proposed Role in Waste Clearance and Neurodegeneration in Arachnid and Human Brain

Affiliations

Myelinated Glial Cells: Their Proposed Role in Waste Clearance and Neurodegeneration in Arachnid and Human Brain

Ruth Fabian-Fine et al. J Comp Neurol. 2024 Nov.

Abstract

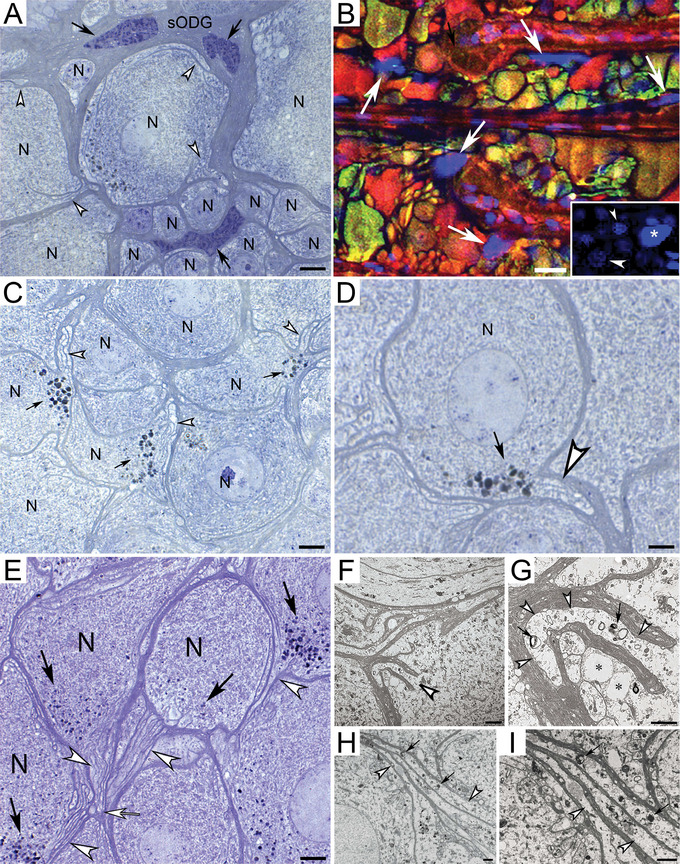
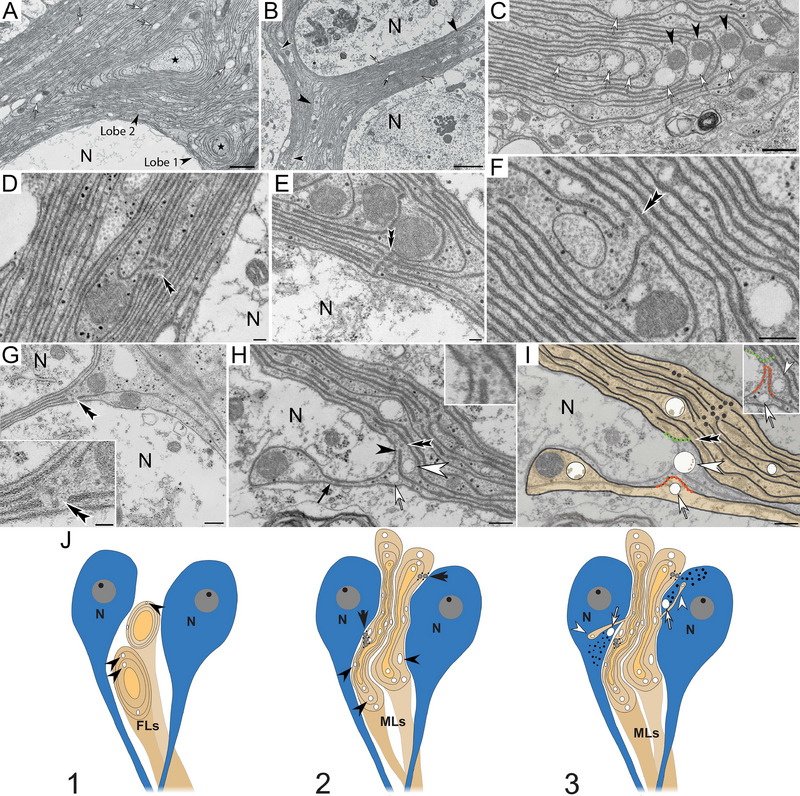
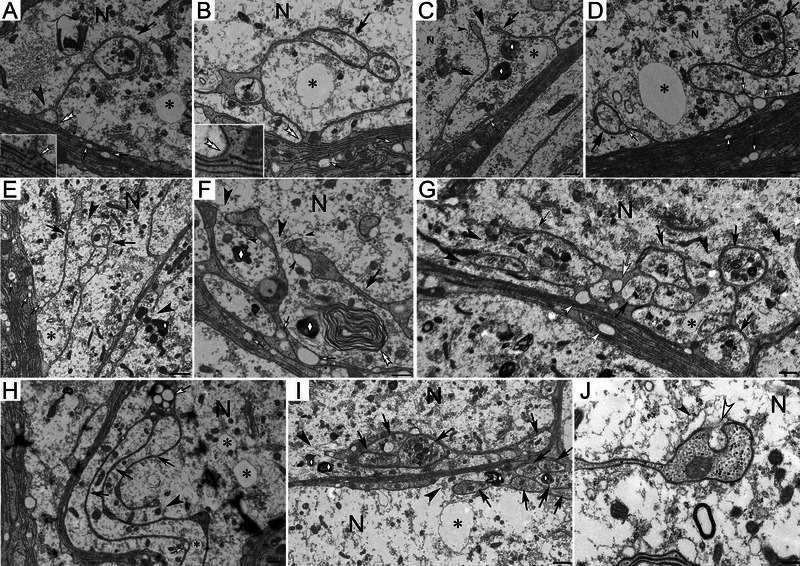
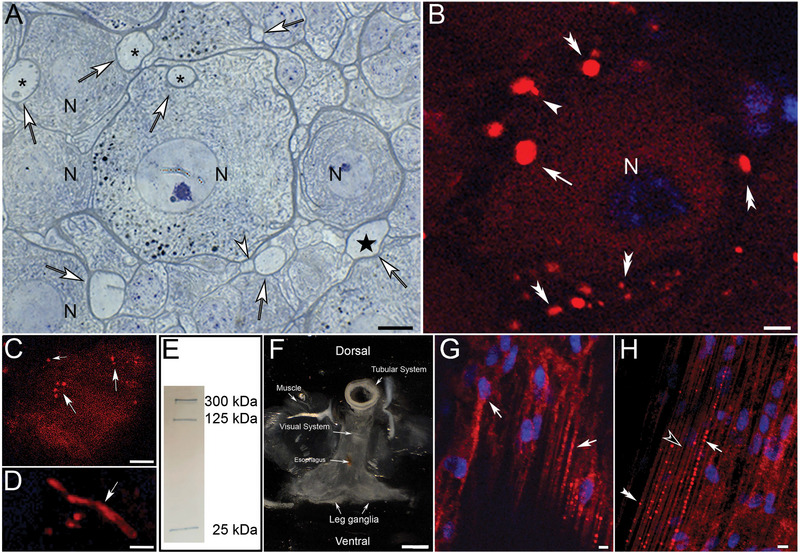
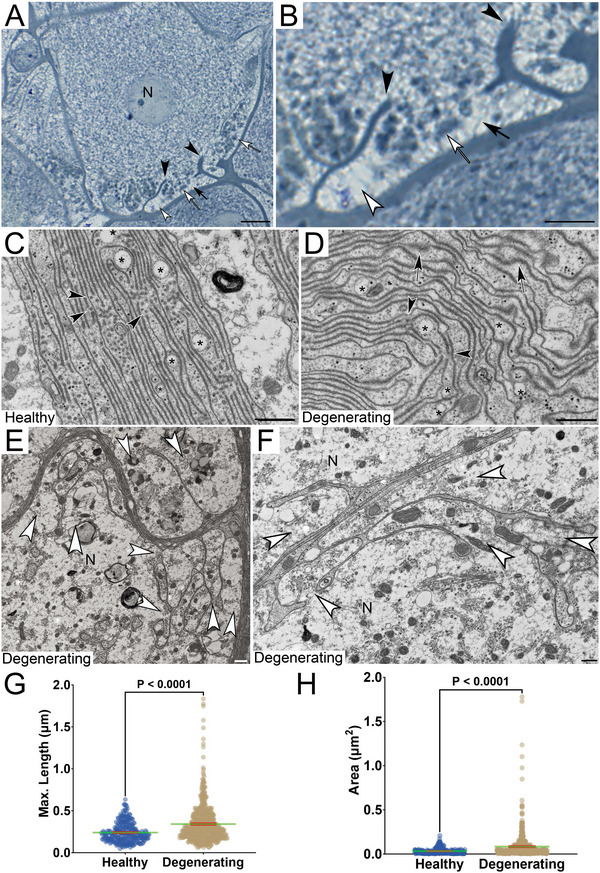
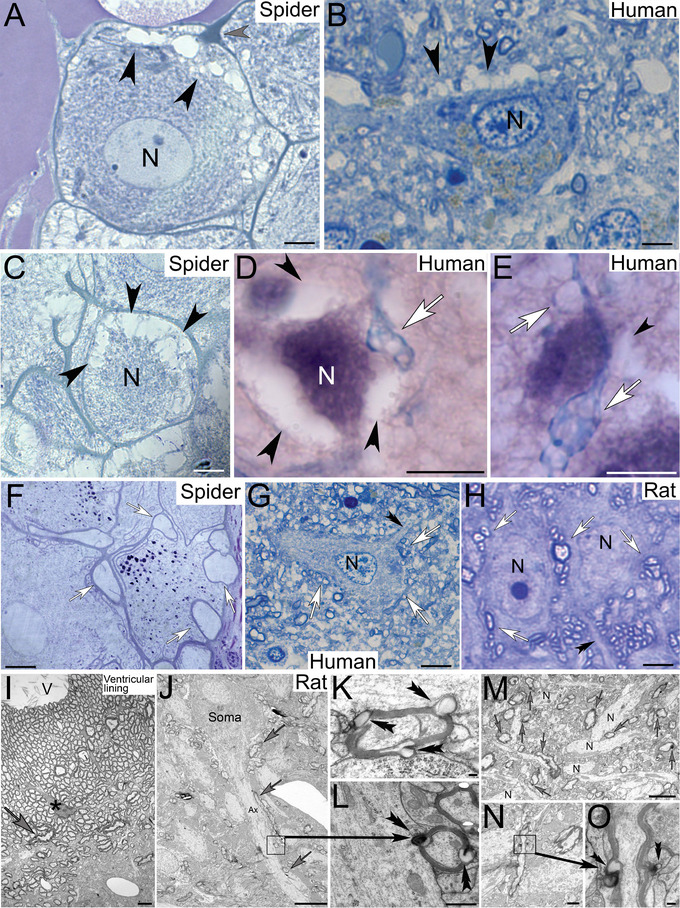
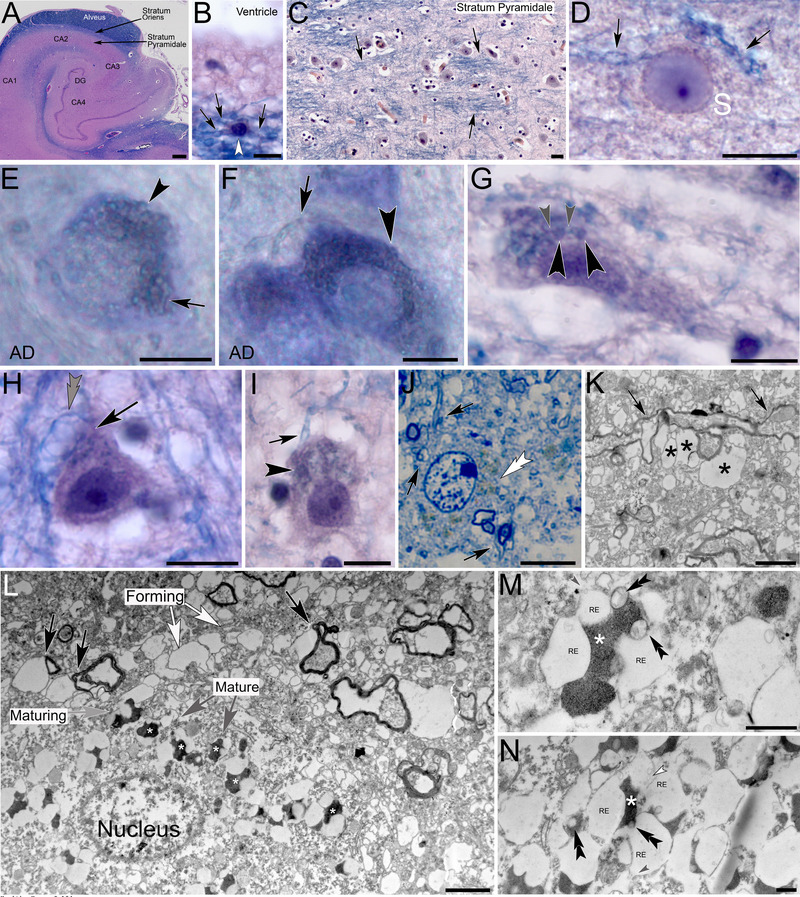
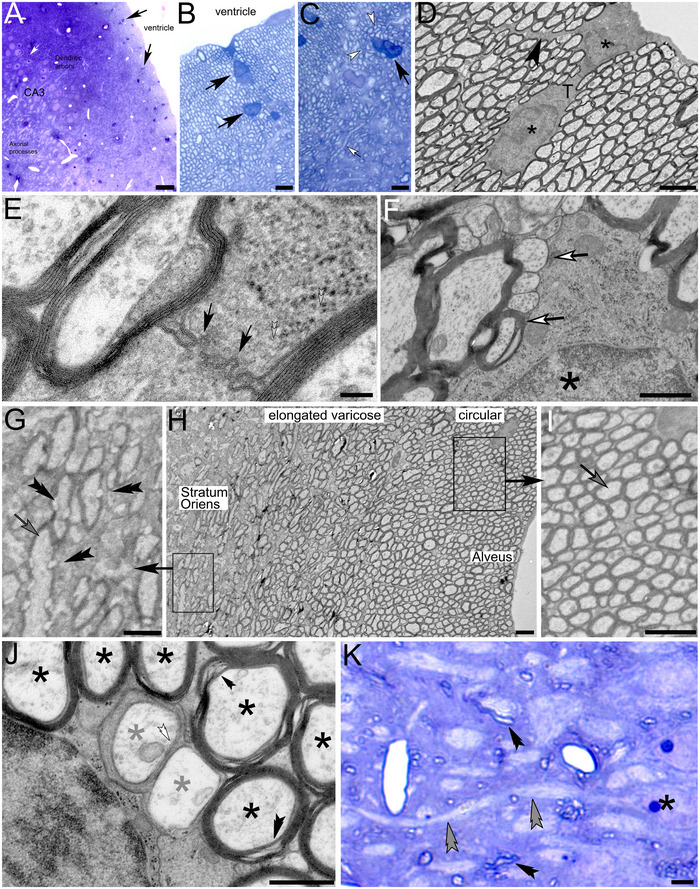
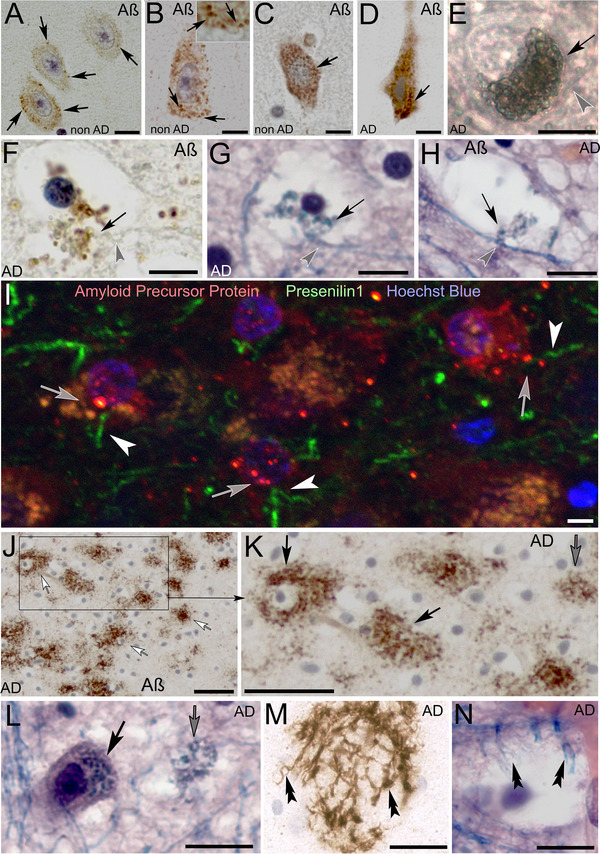
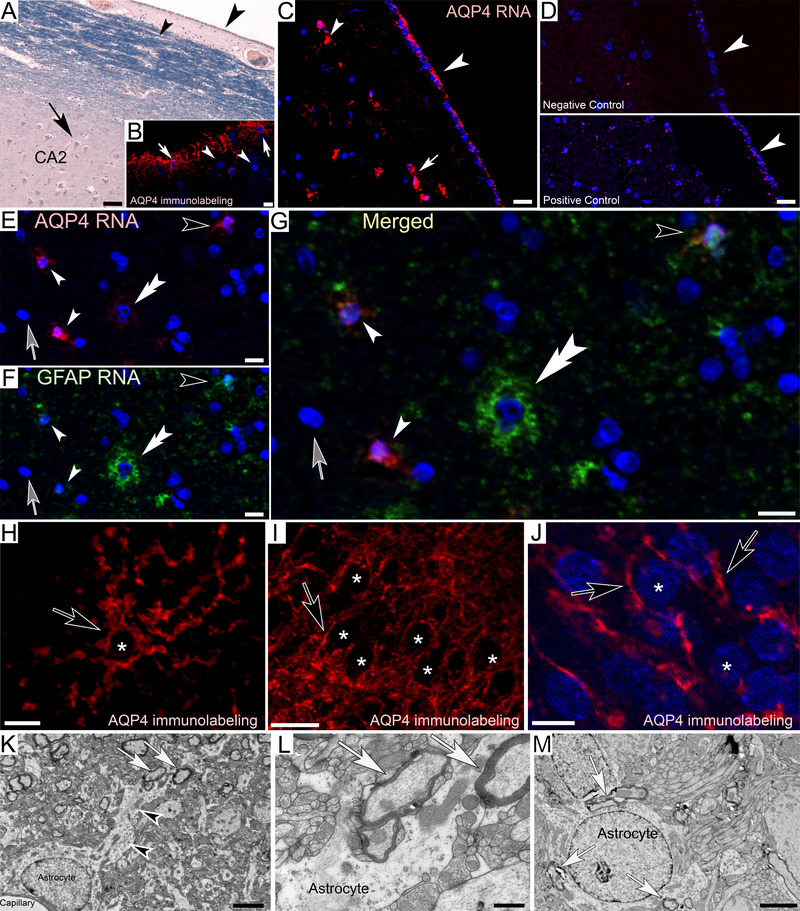
One of the most important goals in biomedical sciences is understanding the causal mechanisms of neurodegeneration. A prevalent hypothesis relates to impaired waste clearance mechanisms from the brain due to reported waste aggregation in the brains of Alzheimer patients, including amyloid-β plaques and neurofibrillary tau tangles. Currently, our understanding of the mechanisms by which waste is removed from the brain is only fragmentary. Here we provide compelling evidence that waste clearance from brain tissue is highly conserved in arachnids and humans. Utilizing RNAscope in situ hybridization, immunohistochemical, ultrastructural, and histological approaches, we demonstrate that cellular debris in spider neurons is engulfed by myelin-forming ependymal glial cells that transect into neuronal somata and form myelin-derived waste-internalizing receptacles. These canal systems channel this debris into the lymphatic system likely in an aquaporin-4 (AQP4) water channel-dependent manner. We provide robust evidence that a similar process may be true in human hippocampus where vast numbers of myelinated AQP4-immunoreactive ependymal glial cells send cellular projections into the somata of neurons and glial cells where they differentiate into waste internalizing receptacles. In the brains of Alzheimer decedents, hypertrophic impairment of these myelinated glial cells leads to the catastrophic obstruction and depletion of neuronal cytoplasm into the ependymal glial cells. At the cellular level, the structural impairment of macroglia leads to swelling myelin protrusions that appear as electron-lucent circular profiles, explaining spongiform abnormalities associated with the neurodegenerative diseases described here. We propose to term this novel type of macroglia-mediated cell death "gliaptosis."

Keywords: Alzheimer disease; Cupiennius salei; glymphatic system; tanycyte; waste clearance.


Conflict of interest statement

Together with Saint Michael's College, R.F.‐F. holds a provisional patent to assess AQP4 activity in context with neurodegeneration.

Figures

FIGURE 1
FIGURE 1
Neurons and sODG in leg and opisthosomal ganglia of Cupiennius salei. (A) sODG with large nuclei (black arrows) is closely associated with neuronal somata (N) and form finger‐like projections into the neuronal cytoplasm (open arrowheads). (B) Confocal image of neurons labeled for Hoechst blue nuclear stain, glutamate (red), and gamma‐aminobutyric acid (green) demonstrates the large size of the chromatin‐rich glial nuclei (white arrows) in comparison to neuronal nuclei (inset; small arrowhead: nucleus of small neuron, large arrowhead: nucleus of large neuron, asterisk: nucleus of sODG). Unstained glial membranes can be observed around neurons. (C and D) Cellular waste (black arrows) accumulates near glial‐canals (open arrowheads). (E) Longitudinal section through extra‐neuronal glial‐canals (open arrowheads) that project from neuronal somata (N) to a common central canal (open arrow), Black arrows: Cellular waste particles. (F–I) Electron micrographs showing large glial‐canals (open arrowheads) in close proximity to each other (black arrows: cellular waste within the canals). Images G and I depict higher magnifications of images F and H, respectively. Asterisks in G: Neuronal glial‐canals. Scale bars: (A) 10 µm, (B) 20 µm, (C) 7 µm, (D and F) 4 µm, (E) 6 µm, (G) 2.5 µm, and (H and I) 2 µm. sODG, spider‐oligodendroglia.
FIGURE 2
FIGURE 2
Ultrastructure of spider‐oligodendroglia in leg ganglia. (A) Forming lobes (FLs; Lobes 1 and 2) comprised glial‐arms (star symbol) surrounded by membrane rings. Glial aqua canals (GACs; open arrow). (B) Mature lobes (MLs, open arrow) with linearly arranged membranes (gray arrowhead). Cytoplasm‐rich lobe endings (black arrowheads: ML 1; open arrowheads: ML 2). (C) Glial lobe containing GACs (open arrow) and mitochondria (arrowhead). (D–G) MLs with microtubule‐associated break points (MAB's, double arrowheads). Inset in G: Higher zoom of MAB. (H) Partially detached glial membrane (black arrow). MAB at the attachment site of the glial membrane (double arrowhead; inset). Open arrow: GACs. White arrowhead: neuronal aqua canal. Black arrowhead: microtubule‐associated membrane. (I) Illustration of proposed glial‐canal formation and translocation of GACs into the neuronal cytoplasm. Dissociation of the microtubule (double arrowhead in H) causes the associated membrane (black arrowhead in H) to fuse with the glial membranes indicated by orange and green dotted lines (inset in I), resulting in glia‐canal formation that contains a GAC (open arrow) and a neuronal aqua canal (white arrowhead). (J) Schematic depiction of the proposed myelin lobe maturation. (1) Forming sODG processes (FLs) that contain glial aqua canals (black arrowheads) grow toward neurons (N). (2) the maturing lobes (MLs) elongate, causing adjacent myelin sheaths to arrange in a linear fashion. The myelin is cleaved and the free ends are attached to microtubules (black arrows). (3) Individual myelin sheaths are uncoupled from their microtubule anchors and translocte into the neuronal cytoplasm (white arrowheads) together with the aqua canals (white arrowheads) that swell and create a proposed convective bulk flow into the canals. Black dots: cellular debris. Scale bars: (A) 1 µm, (B) 2 µm, (C) 500 nm, (D) 70 nm, (E) 60 nm, (F) 100 nm, (G) 120 nm, (inset) 60 nm (H and I) 250 nm.
FIGURE 3
FIGURE 3
Ultrastructure of spider glial‐canals. (A) Glial process with debris‐filled distal tip (black arrow). MAB with associated microtubule at the attachment site to the glial lobe (double open arrowhead, higher zoom in inset). Glial aqua canal (GAC) devoid of cellular debris (gray arrowhead). (B) Glial process (black arrow) with neuronal aqua canal (NAC; asterisk). MAB lacking a visible microtubule (white double arrowhead). (C–G) Anatomically diverse glial extensions form canals that engulf cytoplasmic organelles and debris (diamond). (H) Unraveling glial processes during detachment stage. Detaching glial membranes (black arrow) form multiple glial‐canals (open arrow). (I) Debris containing glial‐canals (arrow). Open glial‐canals in the neuronal cytoplasm (black arrowhead). Open diamond: cellular waste. (J) Fenestration (open arrowhead) in the distal tip of a glial projection. Symbols: black arrow: canal‐forming glial processes; open arrow: GACs; large black arrowhead: canal openings; small black arrowhead: membrane cisternae near the distal tips of glial processes; asterisk: NACs. (N) Neuronal cytoplasm. Scale bars: (A, B, D, G) 500 nm, (C) 550 nm, (E) 800 nm, (F) 400 nm, (H) 400 nm, (I) 800 nm, and (J) 280 nm.
FIGURE 4
FIGURE 4
Aquaporin‐4‐immunolabeled cell projections in leg ganglia of Cupiennius salei. (A) Toluidine blue‐stained semithin section through neuronal somata (N) shows numerous glial‐canals with distinct, unstructured lumina (open arrow). Although some canals are present on the outer edges of neuronal somata (star), others send their projections into the neuronal cytoplasm (asterisk). Arrowhead: Glial‐canals in close contact indicative of branching profiles. (B and C) AQP4‐immunoreactive glial‐canals within healthy neurons (white arrows) and surrounding spider oligodendroglia (double arrowheads). Note that the cytoplasm of the oligodendroglia and neurons appear immunoS‐negative. (D) Longitudinal section through aquaporin‐immunoreactive glial‐canals (arrow). (E) Western blot analysis reveals specific bands around 25, 125, and 300 kDa, which is within the range of reported molecular weights for AQP4 monomers and polymers. (F) Coronal section with attached structures shows the proximity of the CNS to the dorsal canal system that is continuous with the gastric tract of the animals. (G) Strongly immunoreactive spider tanycytes (arrows) in the lining of the tubular tract form slender projections that contain fluorescent particles. (H) Spider tanycytes with varying amounts of fluorescent particles (arrowhead: devoid, double arrowhead: few particles; arrow: numerous particles). Hoechst blue: cell nuclei. Scale bars: (A) 10 µm, (B) 5 µm, (C) 10 µm, (D) 5 µm, (F) ∼3 mm, (G) 5 µm, and (H) 6 µm.
FIGURE 5
FIGURE 5
Degeneration onset in spider leg ganglion. (A and B) Neuron with largely intact cytoplasm (N) shows localized unraveling oligodendroglia whose membranes project into neuronal cytoplasm (black arrow) and engulf cytoplasmic content (open arrow). Translocated NACs increase in diameter, causing a translucent appearance of the cytoplasm (open arrowhead). (C and D) Ultrastructure of healthy (C) and degenerating oligodendrocytes (D). Membranes in healthy spider‐oligodendroglia (sODG) are regularly aligned and contain numerous MABs (black arrowheads) compared to degenerating cells that show signs of structural disintegration (black arrows). Asterisks: GACs. (E and F) Ultrastructural depiction of area shown in B reveals numerous glial‐canals (white arrowheads) in the neuronal cytoplasm (N) engulfing cytoplasmic content. (G) Average maximum diameter of the GACs originating from two 12‐month‐old healthy spiders and three 36‐month‐old degenerating animals is significantly larger in degenerating (0.342 µm) compared to healthy tissue (0.240 µm; t(841.2) = 8.555, p = 5.546 × 10−17, unpaired t‐test). (H) The average area of the GACs is significantly larger in degenerating (0.084 µm2) compared to healthy tissue (0.033 µm2; t(697.8) = 7.650, p = 6.691 × 10−14, unpaired t‐test). Scale bars: (A) 10 µm, (B) 5 µm, (C–F) 500 nm.
FIGURE 6
FIGURE 6
Healthy and degenerating neurons in (a) spider leg ganglia, (b) human motor cortex and hippocampus from patients with Alzheimer disease neuropathologic change, and (c) healthy rat hippocampus. (A) Spider neuron with swelling NACs (black arrowheads) at the cell cortex near hypertrophic sODG (gray arrowhead). (B) Motor cortex neuron (N) with spongiform abnormalities (black arrowheads). (C) Progressing degeneration of a spider neuron (N) shows advanced cytoplasmic depletion around the cellular cortex (black arrowheads). (D and E) Similar peripheral cytoplasmic depletion (black arrowheads) around degenerating hippocampal neurons originates from hypertrophic Luxol blue‐stained ependymal cell processes (white arrows). (F–H) Healthy spider (F), human (G), and rat (H) neurons are closely associated with glial cell profiles whose inner lumina appear clear (open arrows) in comparison with the cytoplasmic appearance of neurites (double arrowheads). (I) Ultrastructural appearance of myelinated glial cell projections in rat hippocampus. Varicose myelinated cell processes (gray arrow) are formed by ependymal glial cells (asterisk) in the ependymal lining. (J) Rat hippocampal pyramidal cell is contacted by myelinated glial cells including along the axon hillock (ax) adjacent to the neuronal soma (gray arrows) and more distal axonal areas. Although the glial cells are myelinated, the clearly identifiable neuronal axon lacks myelination. (K and L) Higher magnification of varicosity‐forming myelinated glial projections that project into adjacent cell profiles (double arrowheads). The glial profile in L contacts the neuronal axon shown in J (arrow) and contains electron‐dense material in the forming varicosity indicative of cellular waste. (M) Lower magnification of rat hippocampus demonstrates the consistency by which myelinated glial cells form varicose protrusions (gray arrows) onto adjacent neuronal processes (N). (N and O) Longitudinal section through a myelinated glial cell process that forms varicose protrusions (box) into adjacent cell profiles (double arrowheads in O). Scale bars: (A) 7 µm, (B) 5 µm (C) 9 µm, (D–G) 10 µm, (H) 4 µm, (I) 2 µm, (J) 5 µm, (K) 2 µm, (L) 0.8 µm, (M and N) 100 nm, and (O) 500 nm.
FIGURE 7
FIGURE 7
Myelinated ependymal cell processes in human hippocampus form varicose protrusions that give rise to waste internalizing receptacles. (A) Luxol H&E‐stained hippocampus shows the abundance of (blue‐stained) myelin within the alveus. (B) Ependymal cell soma in the alveus (white arrowhead) with slender varicose processes that appear strongly stained for Luxol blue indicative of the myelinated nature (black arrows). (C) Vast numbers of myelinated glia processes transect into the stratum pyramidale (black arrows). (D) Glia processes (black arrows) transect into a neuronal soma (S) and give rise to circular protrusions. The blue appearance of the protrusions is indicative of their myelin‐derived nature. (E and F) Toluidine blue‐stained vibratome sections show neuronal somata in the brain of an Alzheimer decedent (AD) that are densely obstructed with myelin‐derived protrusions (black arrowheads) Black arrows: glia processes. (G–I) Luxol H&E‐stained sections through cell somata of an AD decedent show the formation of numerous myelin‐derived varicose protrusions (black arrowheads). Black arrows: glial processes; gray arrowheads: fine processes that connect adjacent protrusions. Please note the spongiform glial process adjacent to the neuron in H (gray double arrowhead). (J) Toluidine blue‐stained 1‐µm semithin section through a neuronal soma with myelin‐derived receptacles that appear light brown in coloration (white double arrowhead). Black arrows: myelinated glial processes. (K) Electron micrograph of myelinated, varicose glial process (black arrows) that forms peripheral myelin‐derived protrusions (asterisks). (L) Electron micrograph of myelin‐derived protrusions that emanate from glial processes (black arrows) and transect into a neuronal soma (nucleus). Electron‐lucent forming protrusions (forming) differentiate (maturing) into waste internalizing (mature) receptacles that internalize cellular debris (white asterisks). (M and N) Higher magnification of mature waste receptacles. Central compartments are filled with electron‐dense material (white asterisks). Openings that contain vesicular structures (black double arrowheads in M) connect central compartments with electron‐lucent interconnected (gray arrowhead) receptacles (RE) that contain membranous and vesicular structures (white arrowhead). Scale bars: (A) 1 mm, (B–J) 10 µm, (K and L) 2 µm, (M and N) 500 nm.
FIGURE 8
FIGURE 8
Myelinated ependymal cells in the ventricular lining near the CA3 region of rat hippocampus. (A–C) Toluidine blue semithin sections show scattered somata with characteristic large nuclei in the alveus adjacent to the lateral ventricle (black arrows). Numerous myelinated circular processes (white arrowheads) emanate from the ependymal cells. Increasing elongation can be observed in dark‐blue‐stained myelinated processes that pull into the stratum oriens (white arrow in C). (D) Two nuclei (asterisks) within connected cytoplasm demonstrate the syncytial and reticular nature of these cells (black arrowhead). (E) Myelin‐projects from the cytoplasm of a glial cell toward forming myelinated processes. (F) Forming cell processes at varying stages of myelination (white arrows). Asterisk: glial nucleus. (G–I) Lower magnification images of the alveus demonstrate the gradual formation of protrusions (double arrowheads in G) along myelinated glial processes that pull into the stratum oriens. Ventricle‐facing processes appear circular with fewer protrusions (arrow in I). (J) Cross sections through forming (gray asterisks), unmyelinated profiles (white double arrowhead), and myelinated glial profiles (black asterisks) with prominent myelination that is transected by canal‐like structures (black double arrowheads). (K) Toluidine blue‐stained semithin section through the stratum pyramidale containing narrow glial processes whose myelin sheath appears dark blue (black arrowheads). Double arrowhead: Axon projecting from the soma of a pyramidal cell (asterisk). Please note the absence of dark myelination around the axon in both proximal and distal areas relative to the neuronal soma. Scale bars: (A) 20 µm, (B and C) 3 µm, inset in (B) 8 µm, (D) 2 µm, (E) 100 nm, (F) 500 nm, (G) 1 µm, (H) 2 µm, (I) 1 µm, (J) 500 nm, (K) 4 µm.
FIGURE 9
FIGURE 9
Amyloid β labeling in neurons of non‐Alzheimer (non‐AD) and Alzheimer‐affected (AD) human brain. (A–C) Amyloid β immunolabeling within neurons in AD‐unaffected brain tissue demonstrates the initial formation of few Aβ‐immunoreactivity sites around the cellular cortex (arrows in A–C) resembling differentiating waste receptacles in the neuronal cytoplasm (arrows and inset in B). (D) Neuron in the early stage of degeneration is densely obstructed with swelling Aβ‐immunolabeled waste receptacles (black arrow). (E) Vibratome section containing a glial cell soma that is densely obstructed with swelling waste receptacles. Gray arrowhead: varicose cell process that pulls toward the soma. (F and G) Glial cell profile with cell processes (Aβ‐labeled in F and Luxol H&E‐stained in G) that proliferate into waste receptacles as as they (gray arrowheads in F, G) enter the cell (arrows). Please note the absence of Aβ‐staining along the tanycyte process prior to entering the cell in F (gray arrowhead). (H) Cell profile with waste receptacles (arrow) that protrude from a Luxol H&E‐stained glial process (gray arrowhead). (I) Presenilin 1 (green), amyloid precursor protein (red) double labeled vibratome section of the CA2 region of a non‐AD decedent. In areas where varicose presenilin 1 immunoreactive glial processes (arrowheads) penetrate into cell somata (Hoechst blue‐stained nuclei), circular amyloid precursor protein labeled circular profiles can be observed (arrows). (J and K) Structures in the CA2 stratum pyramidale commonly described as Aβ plaques (white arrows in J) resemble degenerating neurons that are densely obstructed with Luxol H&E‐stained tanycyte receptacles (compare black arrows in K and L). Smaller plaques resemble remaining waste receptacles in degenerated neurons (compare gray arrows in K and L). (M and N) Amyloid β plaque and Luxol H&E‐stained tanycyte‐like profiles with varicose protrusions are remaining in advanced degeneration. Scale bars: (A–D) 10 µm, (E) 16 µm, (F and G) 12 µm, (H) 25 µm, (I) 5 µm, (J and K) 50 µm, (L) 25 µm, (M and N) 30 µm.
FIGURE 10
FIGURE 10
Myelinated ependymal glial cells in the human hippocampus of an AD‐decedent transect into neurons and form myelin‐derived waste internalizing receptacles. (A) Strongly AQP4 immunoreactive tanycyte processes that emanate from the alveus form numerous varicosities (arrows) and circular processes (arrowheads, insets). Blues stain: Hoechst Blue nuclear stain. (B) Ependymal glia soma (asterisk) in the alveus forms myelinated cell processes indicated by Luxol blue stain (arrows). (C and D) Glial somata in the alveus (asterisks) and their varicose processes (arrows) are immunoreactive for tau protein. (E–H) Myelinated tanycyte processes that project from the alveus into the stratum pyramidale show Luxol myelin stain (E and G) and anti‐tau immunolabeling (F and H). Electron‐lucent varicosities that form along the slender glia cell processes are void of both myelin and anti‐tau stain (arrows). (I) Luxol H&E‐stained soma is transected by a myelinated glia cell process (arrow) that gives rise to spherical myelin‐derived receptacles within the soma (arrowhead). (J) Anti‐tau‐stained neuronal soma with spherical inclusions (arrowhead) is transected by a varicose anti‐tau immunolabeled glial process (arrow). (K) Luxol H&E‐stained neuronal soma is transected by myelinated glial process (arrow) that gives rise to numerous spherical inclusions (arrowhead) indicative of their myelin‐derived origin. (L) Toluidine blue‐stained neuronal soma that is transected by varicose glial processes (arrow) that give rise to intraneuronal spherical protrusions (arrowheads). (M–O) Different focal planes through an anti‐tau labeled neuronal soma that is transected by a varicose glial process (arrow) that transects into the neuron where it forms numerous varicose protrusions (arrowheads). (P) Luxol H&E‐stained tanycyte process (gray arrowheads) transects into neuronal soma where it branches into three projections (arrows). (Q) Anti‐tau immunolabeled neuron is transected by a varicose glial process (arrowhead) that is visible within the neuronal soma (arrows). (R) Typical varicose appearance of an ependymal glia process consisting of bulging electron‐lucent areas (small arrows) and anti‐tau immunolabeled areas (large arrows). (S and T) Ultrastructural depiction of myelinated glial processes shows the characteristic compartmentalization into bulging electron‐lucent (small arrows) and electron‐dense (large arrows) compartments. AQP4, aquaporin‐4; N, neuronal nuclei. Scale bars: (A and B) 5 µm, (C–Q) 10 µm, (R) 5 µm, (S) 500 nm, (T) 2 µm.
FIGURE 11
FIGURE 11
Aquaporin‐4 (AQP4) and glial fibrillary acid protein (GFAP) expression in human hippocampus. (A) Luxol H&E‐stained section adjacent to the ventricular lining in the temporal horn of the lateral ventricle. Somata of ependymal cells can be observed lining the ventricular border (large arrowhead) and in the adjacent Luxol blue‐stained alveus (small arrowhead). Arrow: CA 2 stratum pyramidale. (B) AQP4‐immunolabeling in the alveus shows abundant immunolabeling in ependymal cells and their long, slender processes (white arrows) that project into the stratum pyramidale. Other cells whose Hoechst blue‐stained nuclei are clearly visible lack immunolabeling (white arrowheads). (C) AQP4 RNA in situ hybridization (RNAscope) shows strong AQP4 expression in a subpopulation of ependymal cells of the outer ependymal lining (large arrowhead) and in the alveus (small arrowhead) consistent with AQP4‐immunolabeling. Fluorescent processes of neighboring somata appear connected via fluorescent processes (white arrow). (D) Negative controls show only random background labeling (white arrowhead in top panel). Positive controls for the housekeeping gene Peptidylpropyl isomerase B show RNA staining at expected levels (white arrowhead bottom panel). (E–G) RNA co‐expression for AQP4 and GFAP reveals at least four differently stained cell groups. (a) AQP4‐expressing ependymal cells whose somata are ∼10 µm (small white arrowheads), (b) co‐expressing ependymal cells (black arrowheads), (c) cells with somata > 10 µm that show GFAP expression only (white double arrowhead), (d) cells that do not express either gene (Hoechst blue nuclei, gray arrows). (H–J) AQP4‐immunolabeling of astrocyte (H) and neuronal (I and J) cell profiles demonstrate the lack of immunoreactivity within their somata (asterisks). Varicose, immunoreactive cell processes can be observed along the outside of the somata (black arrows). (K–M) Ultrastructural depiction of astrocyte somata and their processes (black arrowheads) that are closely associated with varicose, myelinated cell profiles (white arrows). Scale bars: (A) 35 µm, (B) 10 µm (C) 20 µm, (D) 40 µm, (E) 20 µm, (F–I) 10 µm, (J) 16 µm, (K) 2 µm, (L) 500 nm, (M) 2 µm.
FIGURE 12
FIGURE 12
Schematic illustration of proposed waste removal glial‐canals in healthy and degenerating spider (A and B) and human (C and D) neurons. (A) Spider neuron (blue) and surrounding sODG (beige) are transected by aquaporin‐LIR tanycyte‐like glial processes (green). Both types of glial cells contribute to the formation of glial‐canals that channel cellular debris from the neuron into the lymphatic system and out of the CNS. Large black arrowheads: glial‐canal openings; black arrows: canal‐forming glial membranes; small black arrowheads: membrane cisternae; black double arrowhead: microtubule‐associated break point; white arrowhead: closed glial‐canal; open arrow: neuronal aqua canal (B) sODG with hypertrophic abnormalities lead to uncontrolled formation of glial‐canals and excessive depletion of neuronal cytoplasm resulting in gliaptosis. (C) Human hippocampal pyramidal cell (blue) is contacted by myelinated AQP4‐IR ependymal glial cells (beige, insets 1, 2, 3, 6, 11) that form varicose projections into the neuron for removal of cellular debris (inset 9), arrows indicate postulated flow of debris toward the alveus. (D) Degenerating neurons are contacted by tau‐protein immunoreactive glial processes (insets 4, 5, 7, 8, 12). Numerous hypertrophic myelin‐derived receptacles obstruct and deplete the neuronal cytoplasm of affected neurons (insets 10, 13, 14). Schematics not drawn to scale.

References

    1. Abbott, N. J. , Pizzo M. E., Preston J. E., Janigro D., and Thorne R. G.. 2018. “The Role of Brain Barriers in Fluid Movement in the CNS: Is There a ‘Glymphatic’ System?.” Acta Neuropathologica 135, no. 3: 387–407. 10.1007/s00401-018-1812-4. - DOI - PubMed
    1. Agre, P. , King L. S., Yasui M., et al. 2002. “Aquaporin Water Channels—From Atomic Structure to Clinical Medicine.” Journal of Physiology 542, no. 1: 3–16. 10.1113/jphysiol.2002.020818. - DOI - PMC - PubMed
    1. Alonso, R. , Pisa D., Marina A. I., et al. 2015. “Evidence for Fungal Infection in Cerebrospinal Fluid and Brain Tissue From Patients With Amyotrophic Lateral Sclerosis.” International Journal of Biological Sciences 11, no. 5: 546–558. - PMC - PubMed
    1. Amiry‐Moghaddam, M. , and Ottersen O. P.. 2003. “The Molecular Basis of Water Transport in the Brain.” Nature Reviews Neuroscience 4, no. 12: 991–1001. - PubMed
    1. Askenazi, M. , Kavanagh T., Pires G., Ueberheide B., Wisniewski T., and Drummond E.. 2023. “Compilation of Reported Protein Changes in the Brain in Alzheimer's Disease.” Nature Communications 14, no. 1: 4466. 10.1038/s41467-023-40208-x. - DOI - PMC - PubMed

LinkOut - more resources