. 2024 Nov 14:16:1477327.
doi: 10.3389/fnagi.2024.1477327. eCollection 2024.

Identification of altered immune cell types and molecular mechanisms in Alzheimer's disease progression by single-cell RNA sequencing

Affiliations

Identification of altered immune cell types and molecular mechanisms in Alzheimer's disease progression by single-cell RNA sequencing

Hua Lin et al. Front Aging Neurosci. .

Abstract

Introduction: Alzheimer's disease (AD) is a progressive neurodegenerative disorder characterized by gradual loss of cognitive function. Understanding the molecular mechanisms is crucial for developing effective therapies.

Methods: Data from single-cell RNA sequencing (scRNA-seq) in the GSE181279 dataset and gene chips in the GSE63060 and GSE63061 datasets were collected and analyzed to identify immune cell types and differentially expressed genes. Cell communication, pseudotime trajectory, enrichment analysis, co- expression network, and short time-series expression miner were analyzed to identify disease-specific molecular and cellular mechanisms.

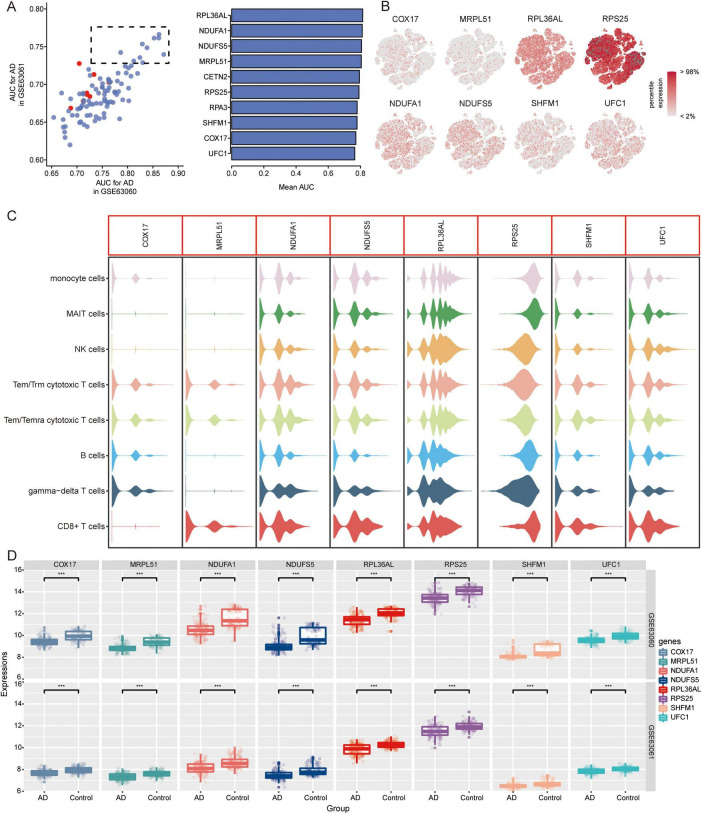
Results: We identified eight cell types (B cells, monocytes, natural killer cells, gamma-delta T cells, CD8+ T cells, Tem/Temra cytotoxic T cells, Tem/Trm cytotoxic T cells, and mucosal-associated invariant T cells) using scRNA-seq. AD samples were enriched in monocytes, CD8+ T cells, Tem/Temra cytotoxic T cells, and Tem/Trm cytotoxic T cells, whereas samples from healthy controls were enriched in natural killer and mucosal-associated invariant T cells. Five co-expression modules that were identified through weighted gene correlation network analysis were enriched in immune- inflammatory pathways. Candidate genes with higher area under the receiver operating characteristic curve values were screened, and the expression trend of Ubiquitin-Fold Modifier Conjugating Enzyme 1 (UFC1) gradually decreased from healthy controls to mild cognitive impairment and then to AD.

Conclusion: Our study suggests that peripheral immune cells may be a potential therapeutic target for AD. Candidate genes, particularly UFC1, may serve as potential biomarkers for progression of AD.

Keywords: Alzheimer’s disease; UFC1; immune cells; monocytes; single-cell RNA sequencing; tlymphocytes.


Conflict of interest statement

The authors declare that the research was conducted in the absence of any commercial or financial relationships that could be construed as a potential conflict of interest.

Figures

FIGURE 1
FIGURE 1
Characterization of cell populations in AD with scRNA-seq profiling. (A) The T-distributed stochastic neighbor embedding (tSNE) plot showing major cell types. (B) The tSNE plot showing subtypes of immune cells. (C) Dot plot showing average expression of marker genes of immune cell types. The color represents the average expression level of marker genes. (D) The tSNE plot showing subtypes of T cells. (E) The tSNE plot showing all cells in the AD and normal control groups. (F) Proportion of cell types in AD and normal control samples. AD, Alzheimer’s disease.
FIGURE 2
FIGURE 2
Single cell immune landscape in ARDS and healthy controls. (A) Cellular interaction number and strength. (B) Pseudotime trajectory analysis of major immune cells. (C) Heatmap of gene expression in immune cells of branches.
FIGURE 3
FIGURE 3
Co-expression modules and their association with immune cells. (A) Different soft-thresholding for screening scale-free network. (B) Hierarchical clustering tree of 5 modules of co-expression. (C) Score of each module in immune cells. The color represents the score level of top 25 hub genes. (D) Top 10 hub genes within individual modules were determined by kME values. ME, module eigengenes. (E) Correlation between modules and immune cells in different clinical traits. *P < 0.05, **P < 0.01, ***P < 0.001. (F) Differential condition of cell types in each module. *P < 0.05, **P < 0.01, ***P < 0.001.
FIGURE 4
FIGURE 4
Contribution of immune cell types, analysis of differentially expressed genes, and metabolic pathway enrichment analysis in AD. (A) Contribution of different immune cell subtypes to AD. (B) Volcano plot of differentially expressed genes in various immune cell types between AD and control samples. (C) Metabolic pathway enrichment analysis based on differentially expressed genes. (D) Quantitative analysis of metabolic pathways in different immune cell types.
FIGURE 5
FIGURE 5
Identification of differentially expressed genes and biological roles of immune cells based on scRNA-seq. (A) Differentially expressed genes in each cell type compared to others. The top 5 up- or downregulated expressed genes are labeled. (B) Biological processes of differentially expressed genes in all cell types. The size represents the count of cells. The color represents the FDR. (C) KEGG pathways of differentially expressed genes in all cell types. The size represents the count of cells. The color represents the FDR. FDR, false discovery rate.
FIGURE 6
FIGURE 6
Identification of differentially expressed genes and biological roles of immune cells based on gene-chip data. (A) Differentially expressed genes between AD and normal controls in the GSE63060 dataset. The top 3 up- or downregulated expressed genes are labeled. (B) Differentially expressed genes between AD and normal controls in GSE63061 dataset. The top 3 up- or downregulated expressed genes are labeled. (C) Common DEGs were screened with the intersection of up-expressed genes or down expressed genes in both datasets. (D) Functional enrichment analysis of common DEGs through Metascape.
FIGURE 7
FIGURE 7
Identification of candidate genes. (A) AUC values of common DEGs in GSE63060 and GSE63061 datasets. Red represents high expression and blue represents low expression in AD. AUC, area under receiver operating characteristic curve. (B) Expression of candidate genes in 8 immune cells. The color represents the expression levels. (C) Violin plots showing the expression of candidate genes in 8 immune cells. (D) Expression of candidate genes in AD and normal controls in GSE63060 and GSE63061 datasets. ***P < 0.001. AD, Alzheimer’s disease.
FIGURE 8
FIGURE 8
Analysis of pathways in AD and immune cells. Top 5 activated or inhibited intersecting KEGG signaling pathways in GSEA in GSE63060 (A) and GSE63061 (B) datasets. NES, normalized enrichment score. (C) Enrichment of pathways in 8 immune cells. The color represents the enrichment levels.
FIGURE 9
FIGURE 9
Expression trends of genes in STEM analysis. Genes with the same expression trend in GSE63060 (A) and GSE63061 (B) datasets. AD, Alzheimer’s disease; NC, normal control.
FIGURE 10
FIGURE 10
Clustered Heatmap of common DEGs and signaling pathways in AD, MCI, and NC groups. Expression heatmap of common DEGs and their major biological functions involved in GSE63060 (A) and GSE63061 (B) datasets. AD, Alzheimer’s disease; MCI, mild cognitive impairment; NC, normal control.

References

    1. Ballard C., Gauthier S., Corbett A., Brayne C., Aarsland D., Jones E. (2011). Alzheimer’s disease. Lancet 377 1019–1031. 10.1016/S0140-6736(10)61349-9 - DOI - PubMed
    1. Bettcher B. M., Tansey M. G., Dorothee G., Heneka M. T. (2021). Peripheral and central immune system crosstalk in Alzheimer disease - a research prospectus. Nat. Rev. Neurol. 17 689–701. 10.1038/s41582-021-00549-x - DOI - PMC - PubMed
    1. Chandra A., Valkimadi P. E., Pagano G., Cousins O., Dervenoulas G., Politis M. (2019). Applications of amyloid, tau, and neuroinflammation PET imaging to Alzheimer’s disease and mild cognitive impairment. Hum. Brain Mapp. 40 5424–5442. 10.1002/hbm.24782 - DOI - PMC - PubMed
    1. Davis D. H., Creavin S. T., Noel-Storr A., Quinn T. J., Smailagic N., Hyde C., et al. (2013). Neuropsychological tests for the diagnosis of Alzheimer’s disease dementia and other dementias: A generic protocol for cross-sectional and delayed-verification studies. Cochrane Database Syst. Rev. 2013:CD010460. 10.1002/CD010460 - DOI - PMC - PubMed
    1. Eissman J. M., Dumitrescu L., Mahoney E. R., Smith A. N., Mukherjee S., Lee M. L., et al. (2022). Sex differences in the genetic architecture of cognitive resilience to Alzheimer’s disease. Brain 145 2541–2554. 10.1093/brain/awac177 - DOI - PMC - PubMed

LinkOut - more resources